

If you are the agency employee or marketer in charge of social media, then it is your job to tie social activity back to business results. Period.
But how can you show the real impact of social media? More importantly; how can you do it consistently, without going crazy in the process?
Many unfortunate marketers spend countless, soul-crushing hours retrieving, formatting and spewing “vanity” metrics, that in reality, mean squat for the business.
But you are going to be different, my friend.
You are going to implement a simple, effective data analytics process for your agency or business that lets you show the impact of your work, without any pain involved.
In this article, you are going to get step-by-step instruction and a plug-andplay template you can use to fully automate your Facebook and Instagram data analysis.
By the end, you will have:
1. An understanding of the right social media wall post metrics to report on.
2. An automated system to collect those metrics, straight from their source.
3. A ready-made, automated dashboard to visualize this data and share it with your team.
Alright, let’s begin!
ETL Tools Are Good For Marketers
ETL stands for Extract, Transform, and Load. It is a software tool that helps eliminate the pain involved with retrieving useful data.
As the name implies, ETL tools extract data from their original source, transforms the data while in transit, and then load the data into a target data storage.
As a marketer, why would you need to extract, transform, and load data?
You could manually use the native dashboards that Facebook and Instagram provide. But that process is time-consuming, inefficient, and can lead to incorrect data and affect your decision making going forward.
Why Relying On Native Facebook and Instagram Dashboards Alone Can Be Problematic
What if you want to compare FB + Instagram campaigns together in one dataset? To really dig into relative performance between the two platforms, you will want to join them up and look at consolidated results.
You can’t do that in a time-effective way without jumping back and forth between platforms. This makes the process more complex and tedious than it has to be when you want to find and analyze information.
Another issue that comes from relying on the native FB and Instagram platforms is that you can’t prioritize the data you really want to see.
For example, when it comes to analyzing the success of my client campaigns, I prefer to follow Avinash Kaushik’s approach to social media metrics over at Occam’s Razor (one of the best blogs around on data analytics and marketing).
As he explains it, a lot of marketers focus on "Vanity" Metrics, which look impressive but don’t necessarily drive sales. The problem is, you can’t make business decisions based on those metrics.
So instead, we focus on the key social media metrics Avinash Kaushik recommends:
Conversation: comments per post.
Amplification: shares per post.
Applause: likes or reactions per post.
There are several reasons we prioritize these metrics:
They give us an indication of whether or not people are aware, interested, and ready for the next stage of the journey.
They show us how much value each of the individual ad sets, campaigns, or/and ads contribute.
They give us an idea of which content pieces in the content mix are hitting the mark with your audience from a branding perspective.
Another advantage of these metrics is that they are public information, so you can easily compare your content strategy with any competitor and benchmark on your individual competitive space.
Now, I only want to see the metrics that really matter to me (just the comments, likes, and shares). So, I use an ETL tool that transforms the data I want from the native FB and Instagram dashboards and loads it onto a dashboard that I have created and customized to increase efficiency and to improve analysis and decision making.
What Is Included In the Customized Dashboard?
We have built a Google Sheets + Data Studio template that allows you to automate the daily process of joining together organic Facebook and Instagram results.
[If you are ready to dive straight into the template, you can access the template here]
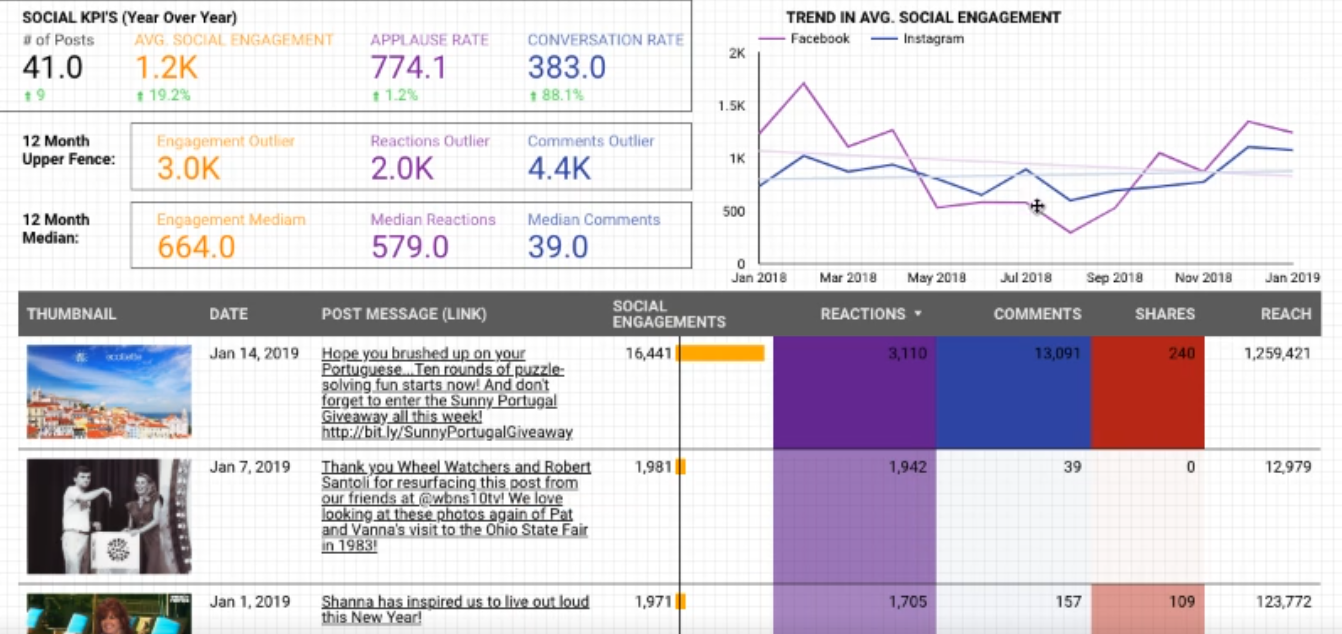
The template’s goal is to provide all the information you need at a glance to make decisions for the Facebook and Instagram pages you manage. It provides some aggregate metrics, as well as a post-level table for deeper dives. Here is what the template looks like:
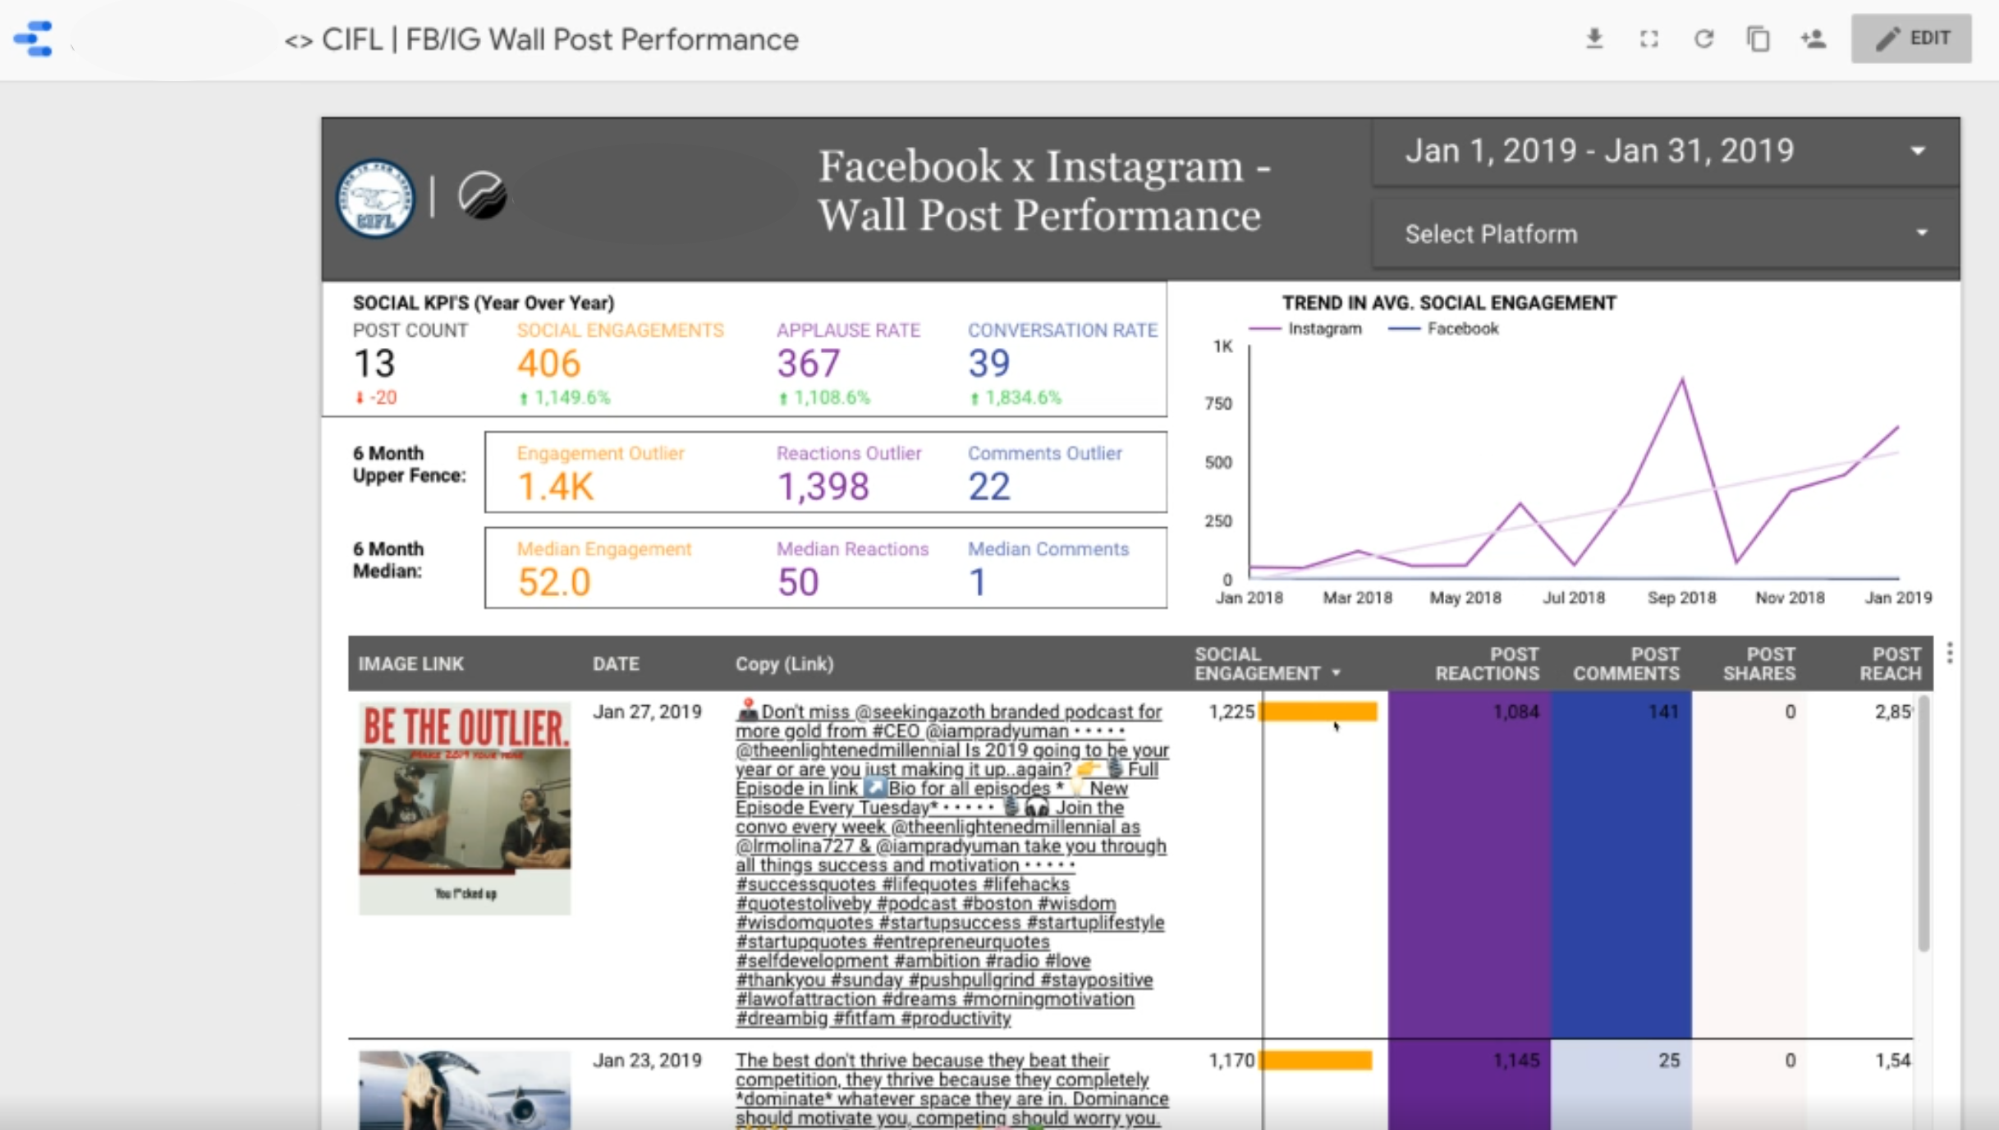
We will get into how you can set this up to analyze and monitor your own FB and Instragam campaigns, but first, let me walk you through how and why I have set it up this way. The three “stars” of the dashboard are the metrics, the median, and the ability to compare Facebook and Instagram in one sheet.
Metrics
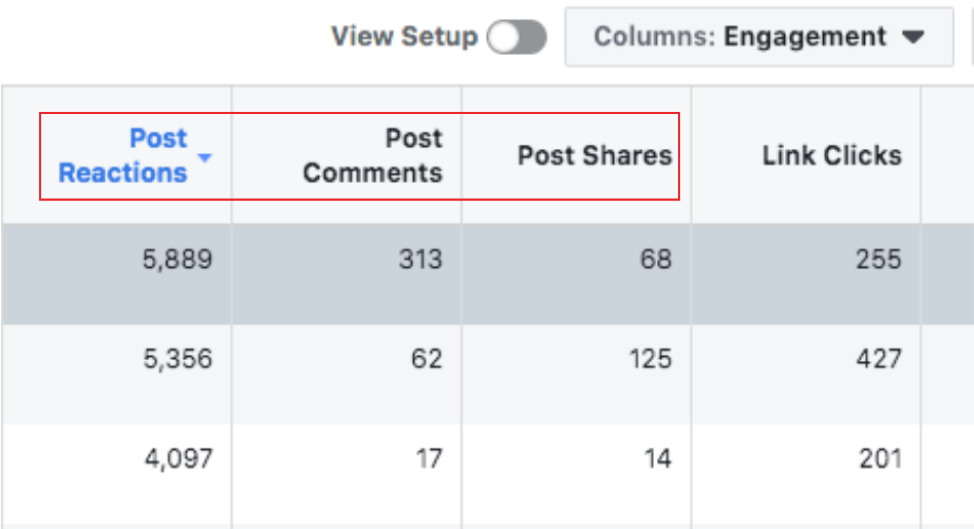
You will notice that the metrics I used align with Avinash Kaushik’s approach - Social Engagement, Post Reactions, and Post Comments.
These are pulled directly from Facebook:
The Median
Another customization on the dashboard is a section for the median engagement, as well as outlier data for the last 6 months:
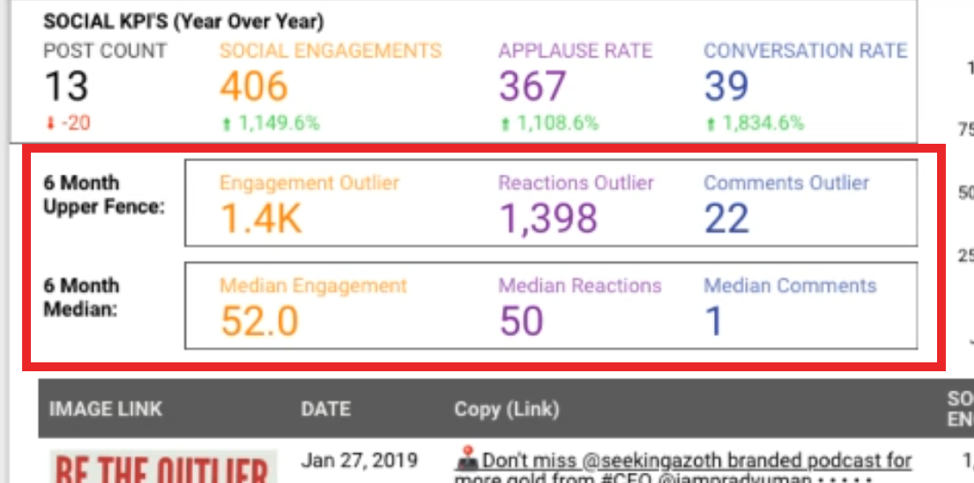
The reason I include the median as a baseline is it acts as a goal metric I aim to surpass.
This baseline is determined from the level of engagement you have received in the past; to find it, we use the median of the reactions for a specific time period. For example, when starting to work with a client, I first want to answer two questions:
What is the baseline (median) for post comments, shares, and likes? What does an outlier (successful post) look like?Including these median baselines in the Data Studio template makes these easy to answer.
How to Make Your Own Custom Dashboard that Automatically Compares FB and Instagram Data
Now that you have some background into why it is set up this way, let's dive into how to set it up.
Step 1: Copy This Google Sheet
So the first thing you are going to do is click here to make a copy of this Google Sheet. Name it whatever you would like.
This new sheet you have copied is going to be your base file. Use this as a starting point whenever you onboard a new client or whenever you want to make the automation in the report for a new account.
Step 2: Run Supermetrics
If you haven’t downloaded Supermetrics yet, you are definitely going to need that in your toolbox. It is one of the best software products I have downloaded in my career. I highly recommend it. There is a free trial, so there is no downside.
Step 3: Duplicate This Sheet for Facebook & Instagram Accounts
Next, you need to duplicate this sheet for your Facebook and Instagram accounts. We are going to do that by clicking “Add Ons” —> “SuperMetrics” (launch it first).
Once Supermetrics is running, then go to “Supermetrics” —> “Duplicate this file for another account”.
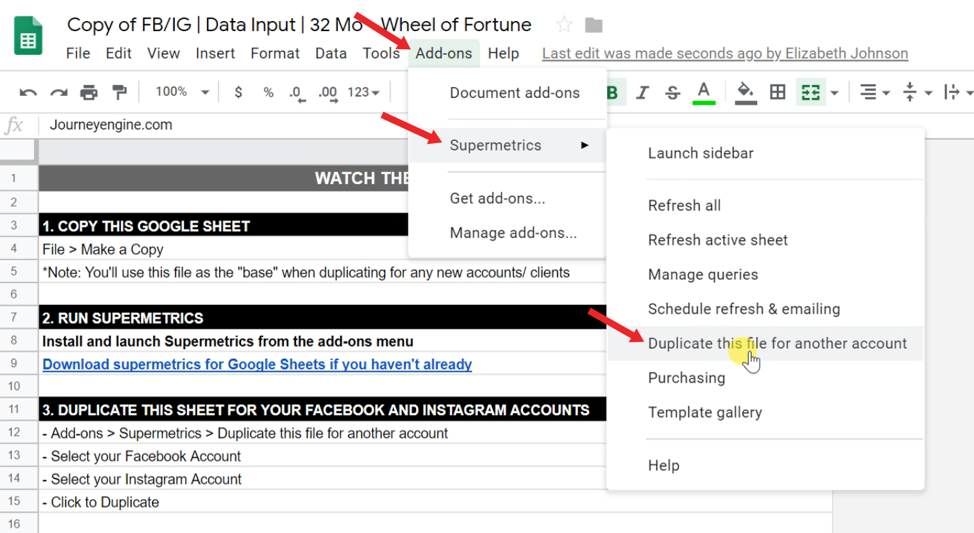
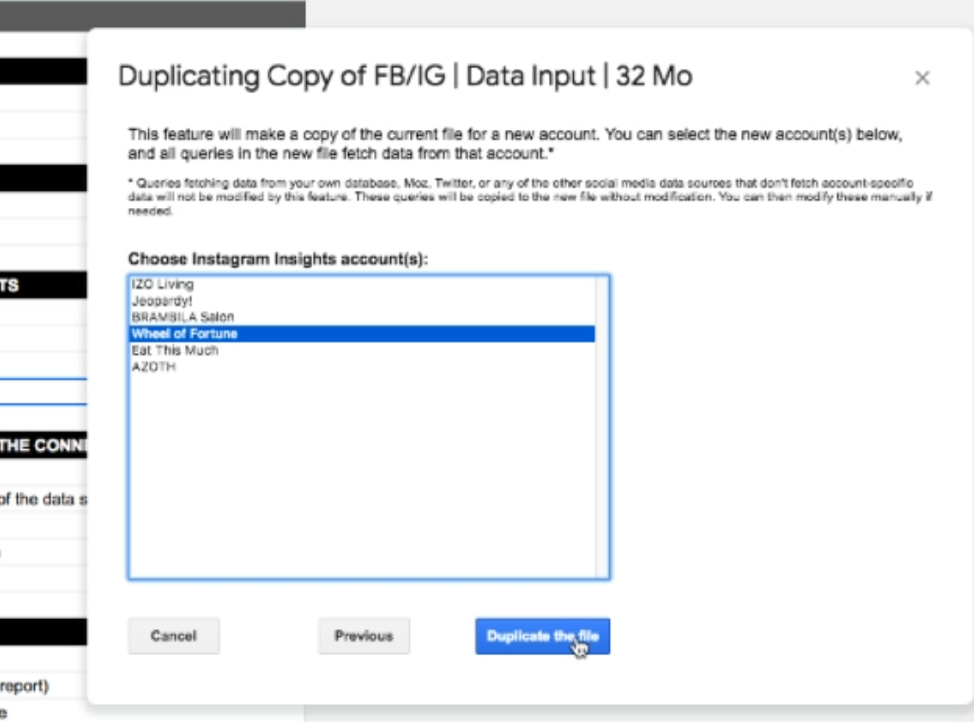
From there, a box will pop up that will allow you to choose your Facebook insights account:
Choose the Facebook insights account you want to create the report for (if you are not logged in, it will ask you to log in first).
Select the same brand’s Instagram account.
Finally, click “Duplicate this file”.
What it is doing now is actually creating a new Google sheet, like a spoke off the main hub sheet that you will have.
Once the files have duplicated successfully, it will refresh all of the Supermetrics queries that are in the base file. This can take some time.
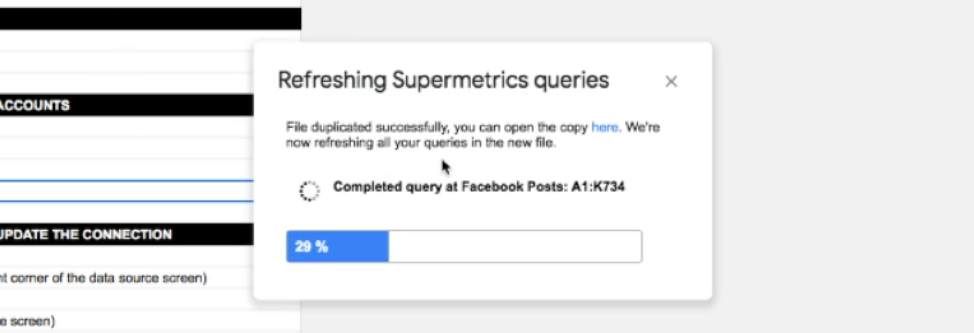
Once the refresh is complete, click “here” to access your brand new file.
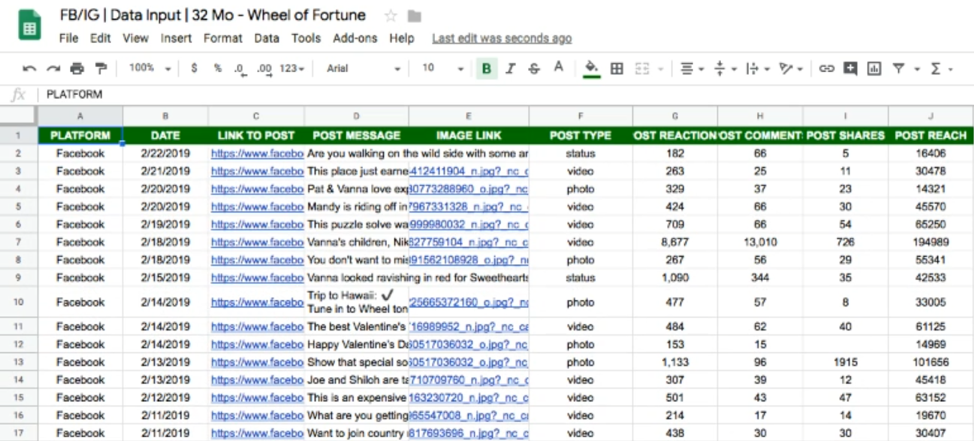
Now, as you can see, the new file is named “Copy of Copy of FB/IG | Data Input | 32 Mo - Wheel of Fortune.” You will notice it has the new brand name at the end. Feel free to delete “Copy of Copy of”.
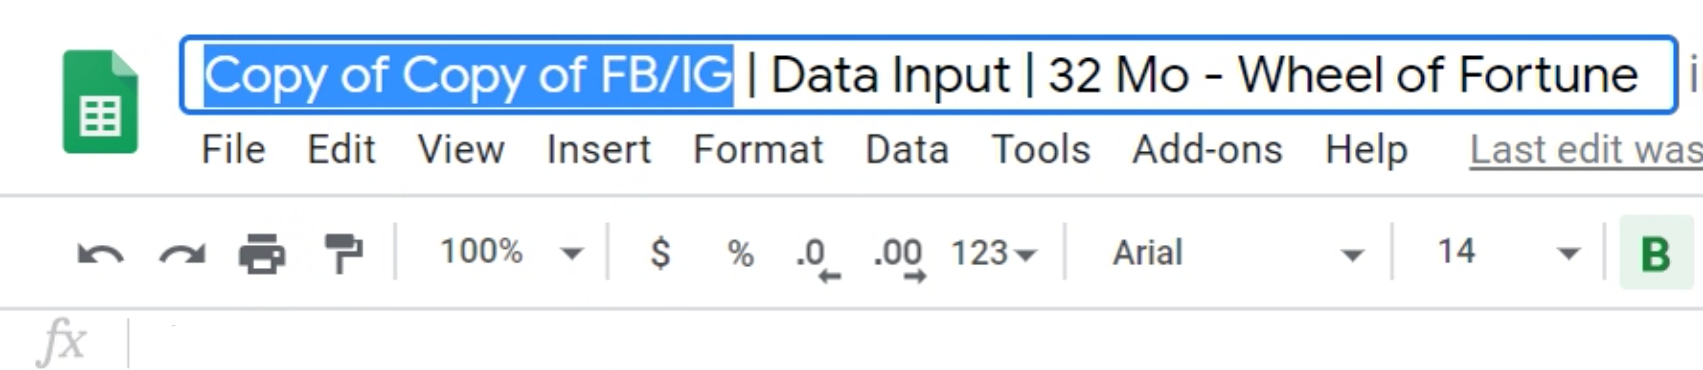
Now you have your new data set for the new brand.
Note that I have three separate queries here from Supermetrics:
A Facebook posts insights query.
An Instagram insights query.
And a third tab is a Stacking query where I use the query function to basically stack the Facebook and Instagram post tabs on top of each other.
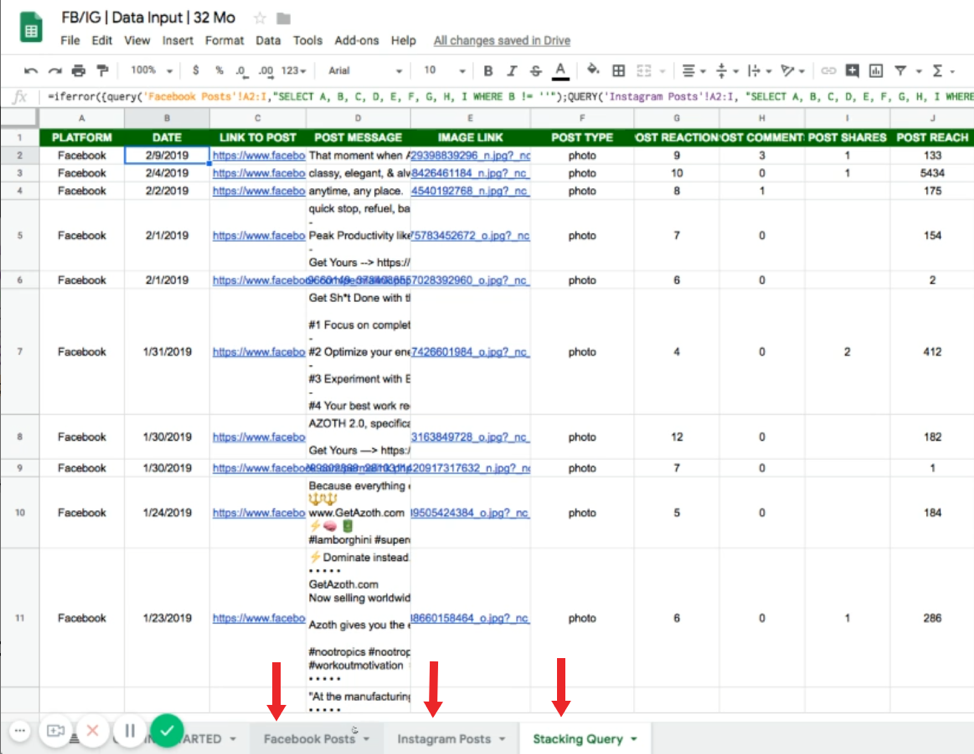
So if you look under “Facebook Posts” you can see that all of the Facebook post data has populated correctly, and it is the same thing under “Instagram Posts”.
The “Stacking Query” tab, the one that is most important to us, is the one that puts Facebook on top of the Instagram table. You can scroll down and confirm that they are both there.
And it is beautiful...
Step 4: Make a Copy of The Data Studio Data Source
Now, head back to the FB/IG | Data Input sheet, to step #4, where you will navigate to the Data Studio Data Source.
Make a copy of the data source by clicking on the two rectangular icons in the top right corner, and then choose “Copy data source”:
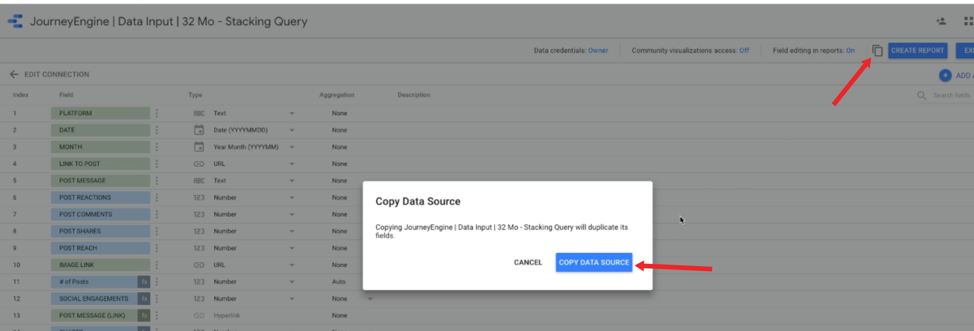
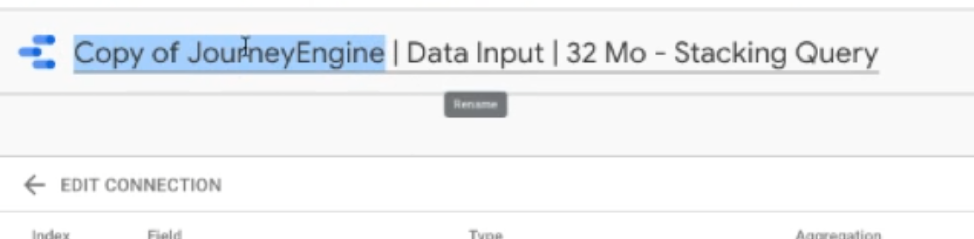
Once that is done copying, you can rename the file for the brand you are working on:
Then click “Edit Connection”:
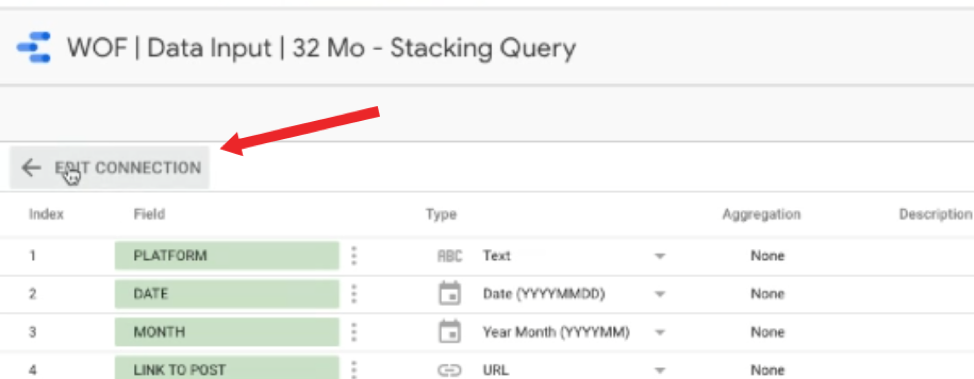
In the list, you can see the name of the datasheet you just created. Now, this is very important; you need to select “Stacking Query” and then select the blue “Reconnect” button in the top right corner.

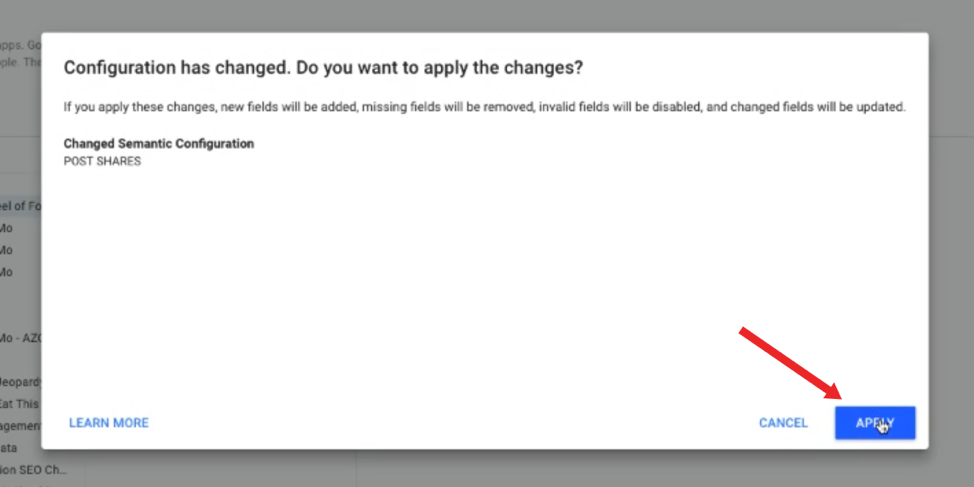
If you get a pop up like the one below, that is ok, just click “Apply”:
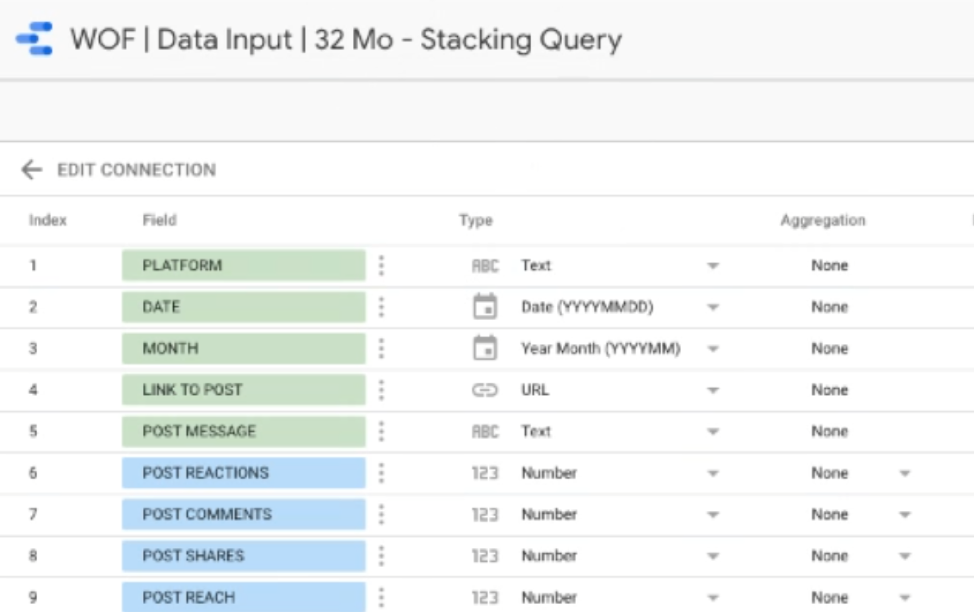
Now you have your new data source all set and ready to go:
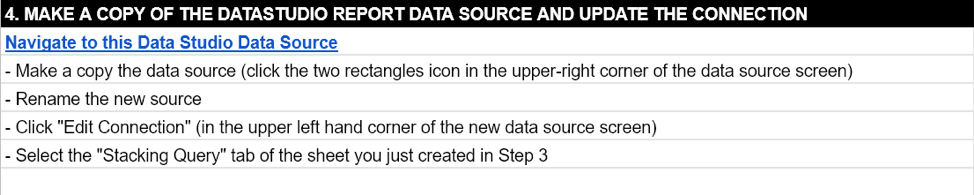
Step #5: Make a Copy of the Data Studio Report Template
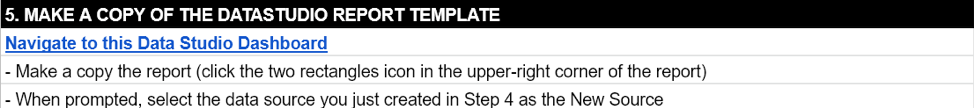
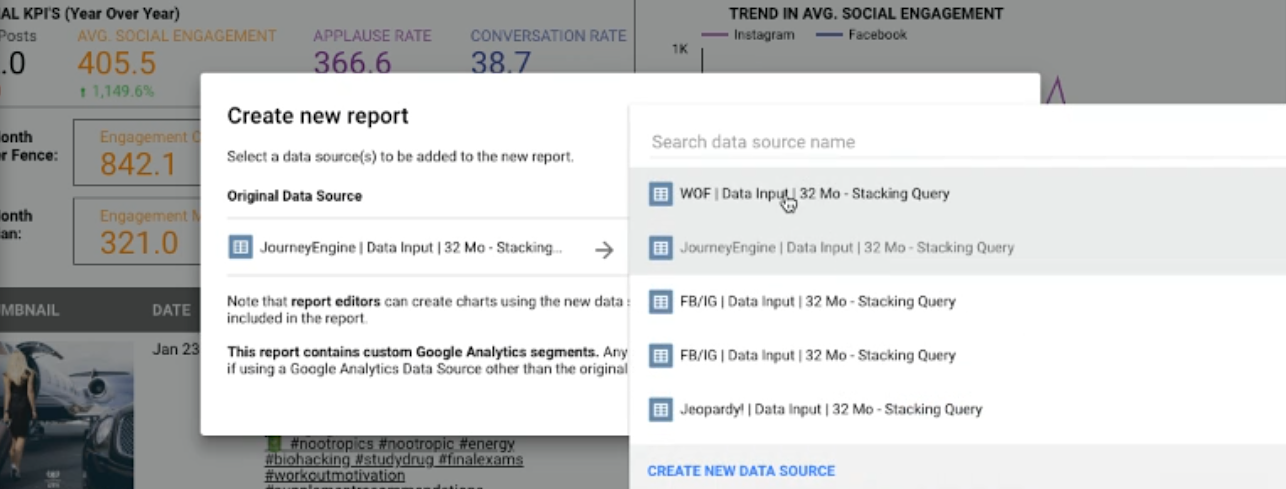
Click the link on the FB/IG | Data Input sheet under #5. Once that is open, you will make a copy of the report. Click on the rectangles again and then choose the correct name under “New Data Source”:
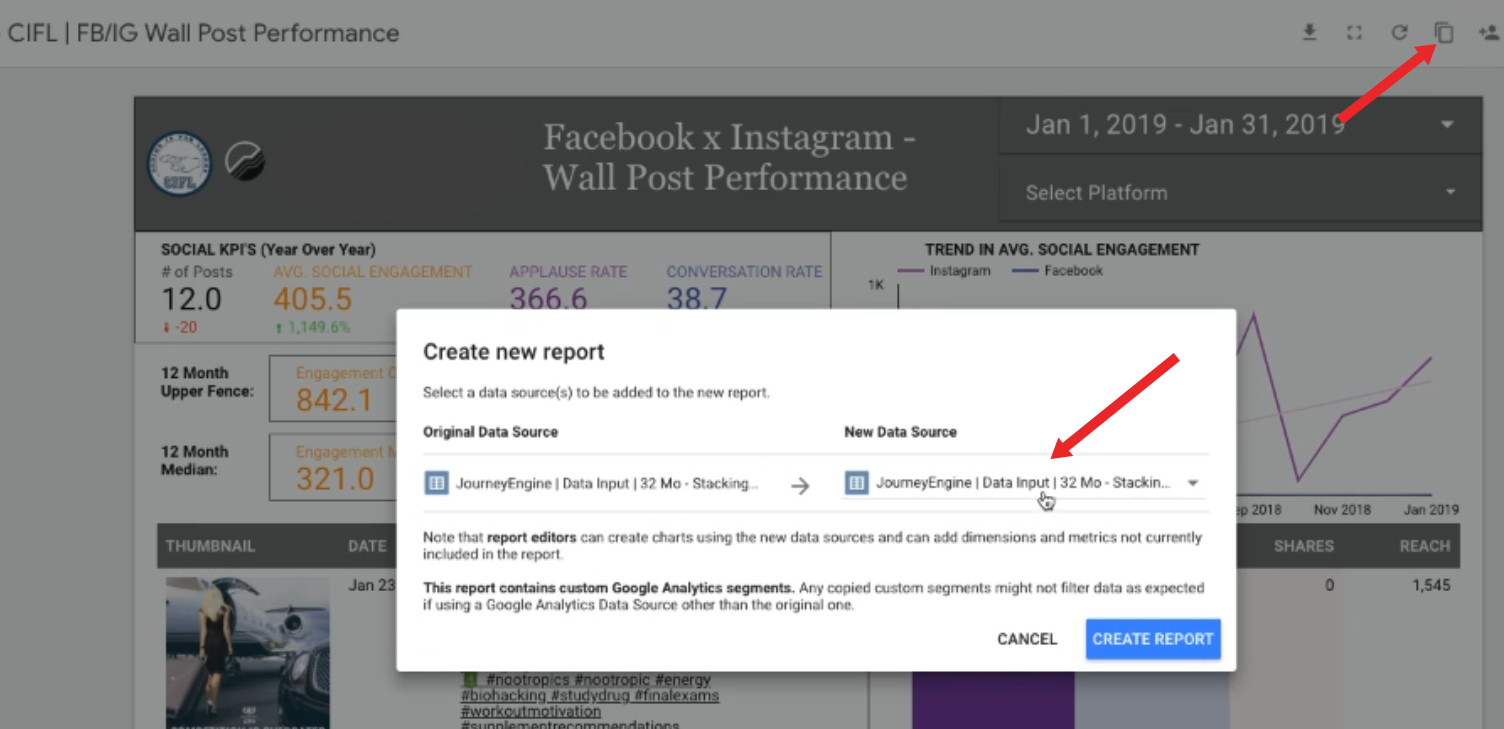
Select the same data source you just created:
Click “Create Report”:
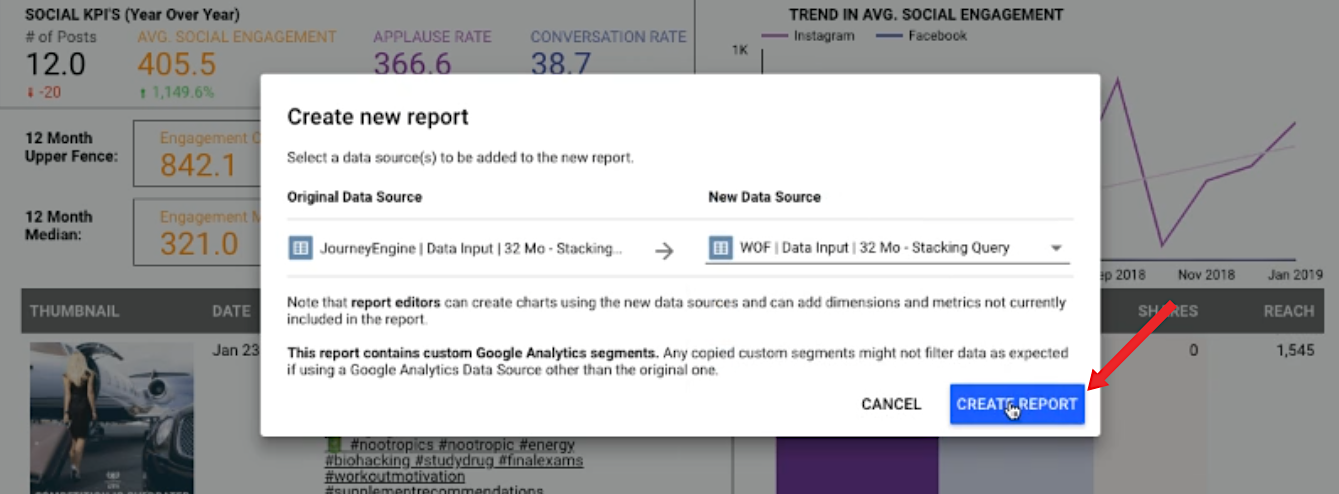
And BOOM! Here you are, your complete Facebook and Instagram Wall Post Dashboard:
An ETL for Every Marketer - Data Analysis The Easy Way
From one marketer to another, I know the reality of trying to comb through data, jump from platform to platform to get what I need, and then analyze it. Using an ETL tool along with this customizable dashboard to zero in on the exact data I want to see, in the way I want to see it, has drastically changed the way I work.
Another benefit is that I can give my clients access and they can immediately see, at a glance, the kinds of results and the direction we are taking with their campaigns.
If you would like to set this up for your campaigns, you can get a copy of the Google Sheets template here and the Google Data Studio template here (no opt-in).
Innovative SEO services
SEO is a patience game; no secret there. We`ll work with you to develop a Search strategy focused on producing increased traffic rankings in as early as 3-months.
A proven Allinclusive. SEO services for measuring, executing, and optimizing for Search Engine success. We say what we do and do what we say.
Our company as Semrush Agency Partner has designed a search engine optimization service that is both ethical and result-driven. We use the latest tools, strategies, and trends to help you move up in the search engines for the right keywords to get noticed by the right audience.
Today, you can schedule a Discovery call with us about your company needs.
Source:


