

Across search engines, there’s only one thing that’s constant — change. Google’s ever-changing SERPs are both offering opportunities (and causing frustration) to SEO and marketing professionals.
If you want to understand your own rankings and see what's behind your ups and downs, checking what’s going on across the SERP landscape is an absolute must. And it’s not a one-time job.
Using insights from Semrush Sensor, we’ve analyzed SERPs across 25 industries in the U.S. Within each industry, we’ve selected the top 20 search results’ day-to-day changes (data from March 23 to April 22) across both desktop and mobile SERPs.
We’re now ready to share the overview results which helped us:
Determine industries with the highest and lowest SERP volatility Pinpoint mobile vs. desktop SERP volatility differences Identify the most and least displayed SERP features Measure the frequency of Google Ads’ appearance across industriesSERP Volatility Across Industries
DESKTOP
MOBILE
Category
Average volatility over the period
Category
Average volatility over the period
News
7.9
News
8.2
Arts & Entertainment
7.0
Arts & Entertainment
7.0
Sports
6.9
Sports
7.0
Games
6.3
Games
6.5
Online Communities
5.9
Online Communities
6.1
Shopping
5.8
Shopping
5.9
Internet & Telecom
5.5
Internet & Telecom
5.8
Business & Industrial
5.4
Business & Industrial
5.5
Home & Garden
5.2
Home & Garden
5.2
Beauty & Fitness
4.7
Beauty & Fitness
4.8
Computers & Electronics
4.6
Computers & Electronics
4.6
Finance
4.5
Finance
4.5
Jobs & Education
4.5
Jobs & Education
4.5
Law & Government
4.5
Law & Government
4.5
Autos & Vehicles
4.3
Hobbies & Leisure
4.4
People & Society
4.2
Autos & Vehicles
4.3
Hobbies & Leisure
4.1
People & Society
4.3
Food & Drink
4.0
Reference
4.1
Science
3.9
Food & Drink
4.0
Books & Literature
3.6
Books & Literature
3.8
Reference
3.6
Science
3.7
Health
3.5
Health
3.5
Pets & Animals
3.5
Travel
3.4
Travel
3.5
Pets & Animals
3.3
Real Estate
2.4
Real Estate
2.2
Comparing desktop vs. mobile SERPs, we see that the top-14 most volatile industries are identical:
News comes as the most unstable industry. This comes as little surprise — volatility is at the heart of this sector, and it’s expected to see news-category SERPs with a 7.9 mark, the high-volatility range. As per Semrush Sensor, any volatility above five is considered to be high. Shopping — an industry we expected to see among the top five — actually comes in sixth, giving way to Arts & Entertainment, Sports, Games, and Online Communities.The slight differences in mobile-desktop SERPs only start occurring within the more stable categories:
The top three least volatile industries are Pets & Animals, Travel, and Real Estate. The latter actually appears to be featuring the most stable SERPs across both mobile and desktop web.SERP Volatility: Mobile-Desktop Discrepancies
With the average volatility being at the same 4.8 mark across both mobile and desktop SERPs, we start seeing some differences at a more granular level:
When we look at volatility counts across industries that are more prone to change, mobile SERPs are showing higher fluctuation: 5.1 against desktop’s 4.9. Curiously, desktop is showing higher volatility rates among the most stable SERPs.The Most Frequently Displayed SERP Features
Mobile SERPs turn out to be more SERP feature-rich, returning no SERP features in only 1.2% of all cases (against 2.6% on desktop).
Looking at the average frequency of appearance of various SERP features across all industries on both desktop and mobile SERPs, we can see the following patterns:
Desktop SERP Feature%Mobile SERP Feature%Site Links72.60%Site Links71.70%People Also Ask57.20%People Also Ask51.30%Review49.90%Review47.70%Images44.70%Carousel32.80%Knowledge Graph28.30%Knowledge Graph24.10%Local Pack19.80%Local Pack20.80%News7.90%Video20.30%Tweet6.50%Images14.80%Video6.40%AMP*12.70%Featured Snippet6.30%News7.90%Instant Answer4.80%Application7.70%Shopping Results3%Tweet6.20%No SERP Features2.60%Featured Snippet5.50%Carousel2.40%Shopping Results3.80%Featured Video0.40%Instant Answer3.70% No SERP Features1.20% Featured Video0.10%*In regard to AMP data, as we referenced above, was for data compiled from March 23 through April 22. This data was prior to Google's recent AMP changes after the July 2021 Core Update.
The Most Popular SERP Features
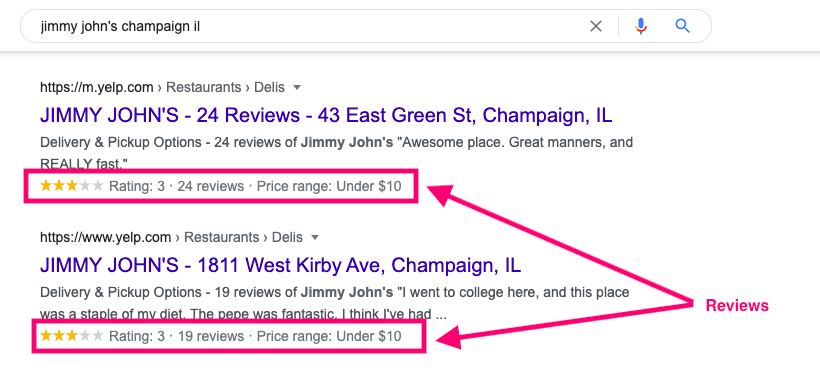
The top three most displayed SERP features on desktop and mobile web are Site Links (73% and 72%), People Also Ask (57% and 51%), and Review (50% and 48%).
While site links dominate across the majority of industries, there are a few exceptions:
Review comes as the most displayed SERP feature within Beauty & Fitness and Food & Drink sectors (on both mobile and desktop SERPs). People Also Ask is the most popular SERP feature across Computers & Electronics (on both mobile and desktop SERPs). Images show up the most within Hobbies & Leisure, Home & Garden, and Shopping industry SERPs on mobile web.The Least Popular SERP Features
Featured video (do not confuse with Video) is the least displayed SERP feature, appearing only in 0.4% of cases on desktop, and 0.1% on mobile. Across mobile SERPs, this feature only occurs across Arts & Entertainment and Hobbies & Leisure industries.
Desktop SERPs only return a carousel around 2.4% of the time — this SERP feature is most popular within the Books & Literature and Games industries.
This pattern is not true for mobile — carousel shows up in 33% of all cases, appearing more than 40% of the time in Home & Garden (49%), Business & Industrial (48%), Sports (46%), Arts & Entertainment (44%), Hobbies & Leisure (44%), and Shopping (41%).
Instant Answer also makes it to the top five least displayed SERP features across both desktop and mobile SERPs.
Curious SERP Feature Patterns Across Select Industries
While we’ve tried to generalize the data to spot some common patterns across industries and mobile-desktop SERPs, there were a few things that stood out within certain sectors:
Knowledge Graph — the fifth most popular SERP feature on both desktop and mobile web — appears in a whopping 75-77% of results for Arts & Entertainment. Sports is the second industry where this SERP feature shows up the most, yet mobile SERPs only return it 45% of the time (desktop — 48%). As you’d expect, Food & Drink-related SERPs return Review in almost 90% of the cases on both mobile and desktop. The Shopping SERP feature appears the most across the Home & Garden industry (20%). Images show up way more across desktop — 45% against mobile’s 15%. The most popular industries that return this SERP feature are Home & Garden (78%), Hobbies & Leisure (74%), and Business & Industrial (69%). Instant Answer, typically one of the least displayed SERP features across both desktop and mobile, shows up much more frequently across Reference (37% and 29%) and Finance (31% and 25%) sectors.The biggest mobile-desktop discrepancy we spotted occurred within Video. Mobile is much more video-prone, returning this SERP feature in 20% of all cases, while desktop-only does so 6.4% of the time.
Biggest and Smallest Google Ads Investors
We also managed to pinpoint which industries advertise the most and where the largest share of ads is located.
Measuring the averages across all industries, desktop features higher shares of ads — mobile SERPs only trigger 4.3% of the top ads (vs. 5.7% on desktop) and 1.6% of the bottom ads (vs. 2.5% on desktop).
Google Ads on Desktop SERPs
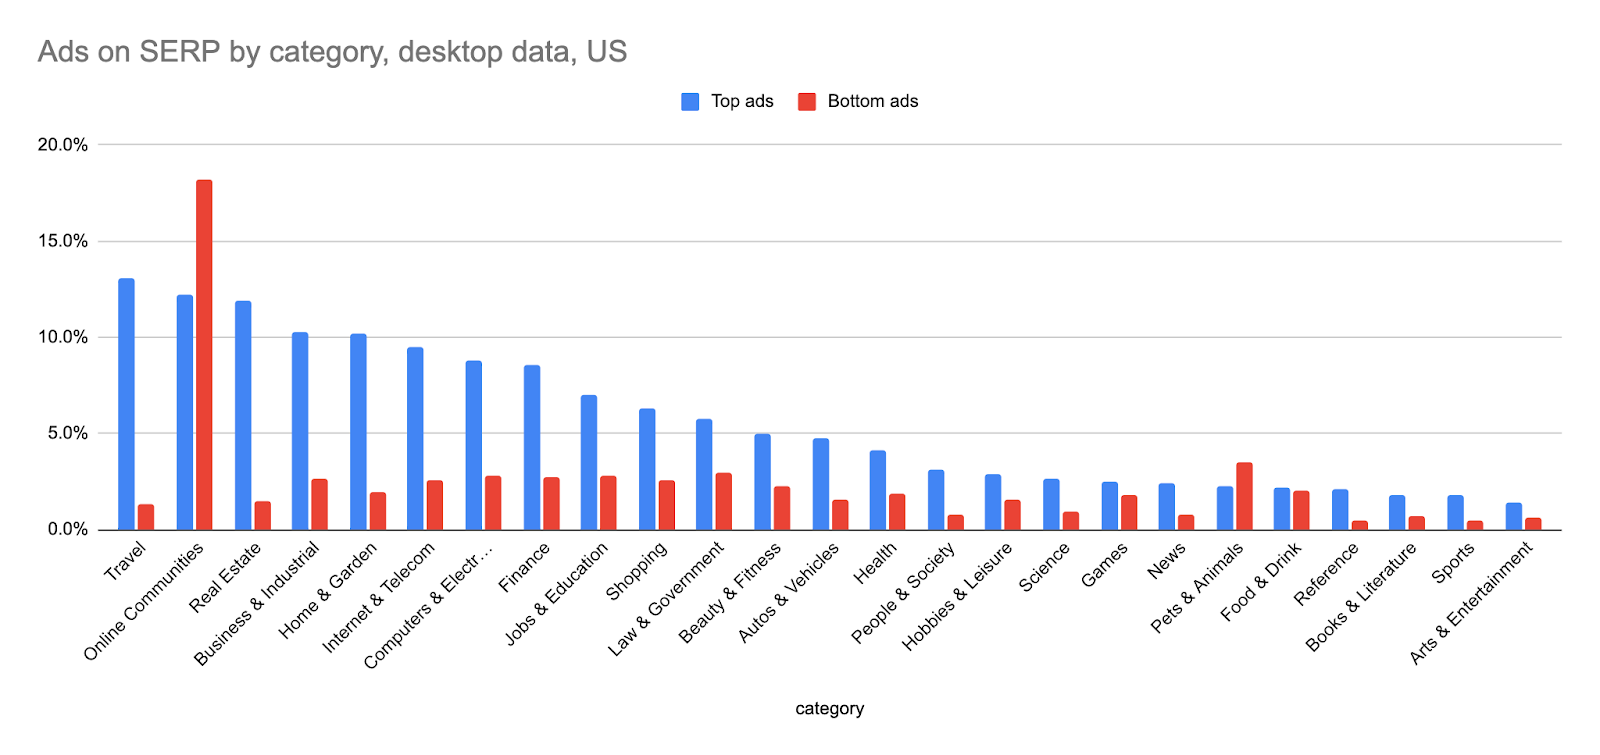
Travel-industry SERPs show the highest number of Google ads compared to other sectors in regard to top ads (13%).
The second-largest advertiser (12%) for top ads — Online Communities — actually comes in first when it comes to bottom ad spots. The industry features them 18% of the time, which is almost six times more than the second-biggest bottom-ad-spender, Pets & Animals (3.5%).
The latter actually triggers more bottom ads (3.5%) than top ads (2.3%), which is an unusual pattern for most industries.
Google Ads on Mobile SERPs
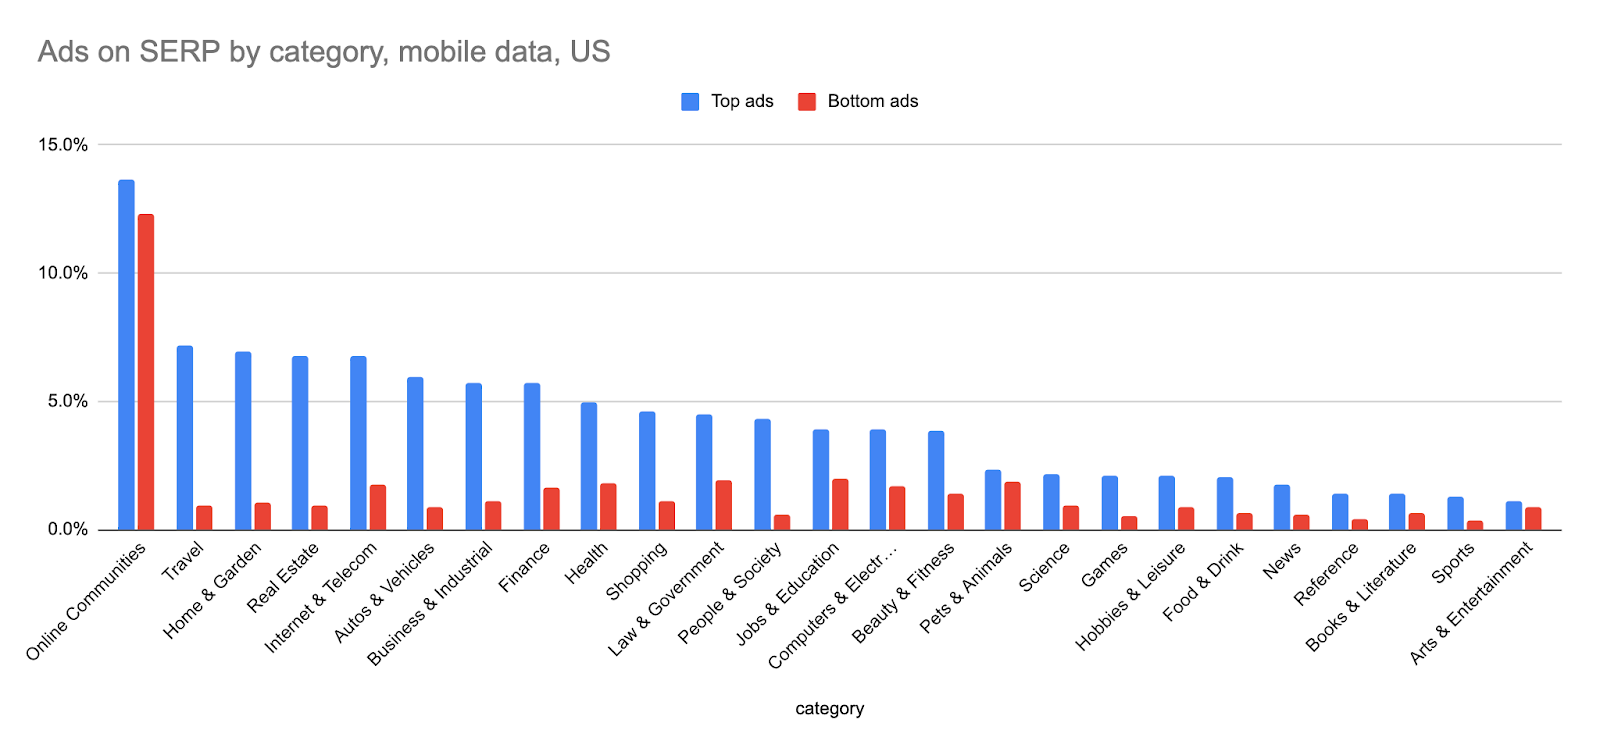
When it comes to mobile SERPs, top ads completely dominate the ad landscape across all industries.
With top ads, the Online Communities industry has the largest share of ad usage. This sector wins across both top (14%) and bottom (12%) ad space.
The second-biggest advertisers appear to be within the Travel sector, returning Google ads results 7% of the time. Home & Garden comes very close, with its 7% figure.
While the Jobs & Education sector doesn’t feature many top ads (4%), across bottom ads space, it’s actually the second industry that comes up within the most frequent Google advertisers.
The least active ad spenders on mobile turned out to be within the Sports and Arts & Entertainment industries — it’s true for both top and bottom ads.
HTTP Usage
While it may have seemed like the HTTP vs. HTTPs question is closed, we spotted that there are some lags when it comes to the security protocol adoption across various industries:
HTTPs usage is the highest among Business & Industrial, Finance, and Shopping sectors. More than 97% of these industries’ URLs that appear on both desktop and mobile SERPs come as security protocol-friendly. Across Pets & Animals and Science industries, the HTTPs migration is in place for less than 92% of the sites.With a narrow 0.1% margin, we can see that, on average, mobile SERPs feature more HTTPs sites (95.4%) than desktop.
Final Words
Monitoring SERP changes and understanding industry-specific SERP nuances are key to developing a successful SEO strategy.
Tools like Semrush Sensor help you stay in tune with the ever-shifting SERP landscape, explain what’s going on in your industry, and can provide some insight into the sudden drops or spikes.
Rankings, however, aren’t only influenced by algorithm changes or general volatility surges.
Google is always experimenting with the SERP and its features, so make sure to stay up to date on SERP features, any changes, and get detailed guidance on how to optimize your site for each of them.
Innovative SEO services
SEO is a patience game; no secret there. We`ll work with you to develop a Search strategy focused on producing increased traffic rankings in as early as 3-months.
A proven Allinclusive. SEO services for measuring, executing, and optimizing for Search Engine success. We say what we do and do what we say.
Our company as Semrush Agency Partner has designed a search engine optimization service that is both ethical and result-driven. We use the latest tools, strategies, and trends to help you move up in the search engines for the right keywords to get noticed by the right audience.
Today, you can schedule a Discovery call with us about your company needs.
Source:

![How To Create a Strategic Dashboard in Excel Using Semrush Data [Excel Template Included]](https://allinclusive.agency/uploads/images/how-to-create-a-strategic-dashboard-in-excel-using-semrush-data-excel-template-included.svg)
