If you have an app and have it listed on the Play Store (Google) and App Store (Apple), you’ve probably dug into the ins and outs of optimization for these platforms.
Textbook recommendations might not necessarily do the trick, though. That’s why we teamed up with MobileAction, a renowned tool for App Store Optimization and mobile user acquisition, developer of Mobile App Insights app in Semrush App Center, to dissect the best practices of the apps that make it into the top 10 in the App Store and Play Store.
App Store Optimization Study: Highlights
Any good content has a teaser, so we’ll reveal some of the most interesting findings from our study. Take a sneak peek at our most compelling discoveries and dive into the full study:
The App Store appears to have a more diverse landscape when it comes to app developers. The Play Store typically features fewer competitors across the analyzed categories. Brand awareness is the underlying success factor for your app. Both iOS and Android users tend to use brand names when they search for various apps. Reviews, unlike ratings, seem to have a direct correlation with rankings. Play Store users are generally more generous with reviews — the average app within the top 10 on Play Store gets 267K reviews, while in the App Store, that number goes down to 31.7K. Apps ranking for #1 positions are more likely to have a target keyword within their app name. Guess which app store features apps with more MBs? Right, it’s the App Store. An average iOS app is triple the size of an Android app. Does this have any impact on rankings? It’s counterintuitive, but heavier apps take higher positions across both stores.What Is App Store Optimization?
App Store Optimization (ASO) is an organic approach to growing your app’s visibility on major app stores. All through optimization.
Think of it as SEO, only for the Play Store (Android devices) and App Store (iOS devices).
Just like Google search, the two biggest app stores keep their ranking factors a secret. But the general consensus among ASO specialists is that app rankings can be influenced by:
App Store
Play Store
App name / app title
✅
✅
Keywords*
✅
✅
App subtitle
✅
—
App URL
✅
—
Number of installs
✅
✅
Reviews
—
✅
Ratings
✅
✅
App updates
✅
✅
In-app purchases
✅
✅
*Note: Play Store and App Store have different approaches to indexing keywords. The former considers the entire content (including title and descriptions), while the latter also indexes keywords added to a designated keywords field and the app subtitle.
We’ve looked at each variable to unwrap the extent of their influence on rankings and to pinpoint the best practices that you can use to give your app a potential visibility boost.
ASO Study Methodology
Together with the MobileAction team we defined a list of categories from both the Play Store and the App Store. We’ve pinpointed six categories where ASO plays the biggest role: Finance, Food and Drink, Games, Health and Fitness, Social Networking, and Shopping.
For each category, the MobileAction team pulled the top 100 most popular keywords, while our job was to:
Choose the 10 top-ranking apps for each keyword in both the App Store and Play Store. Collect a number of metrics and features for further analysis (app name, developer, icon features, date of app’s last update, app size, description, category, screenshots, reviews, and ratings).App Store and Play Store metrics and features (example):
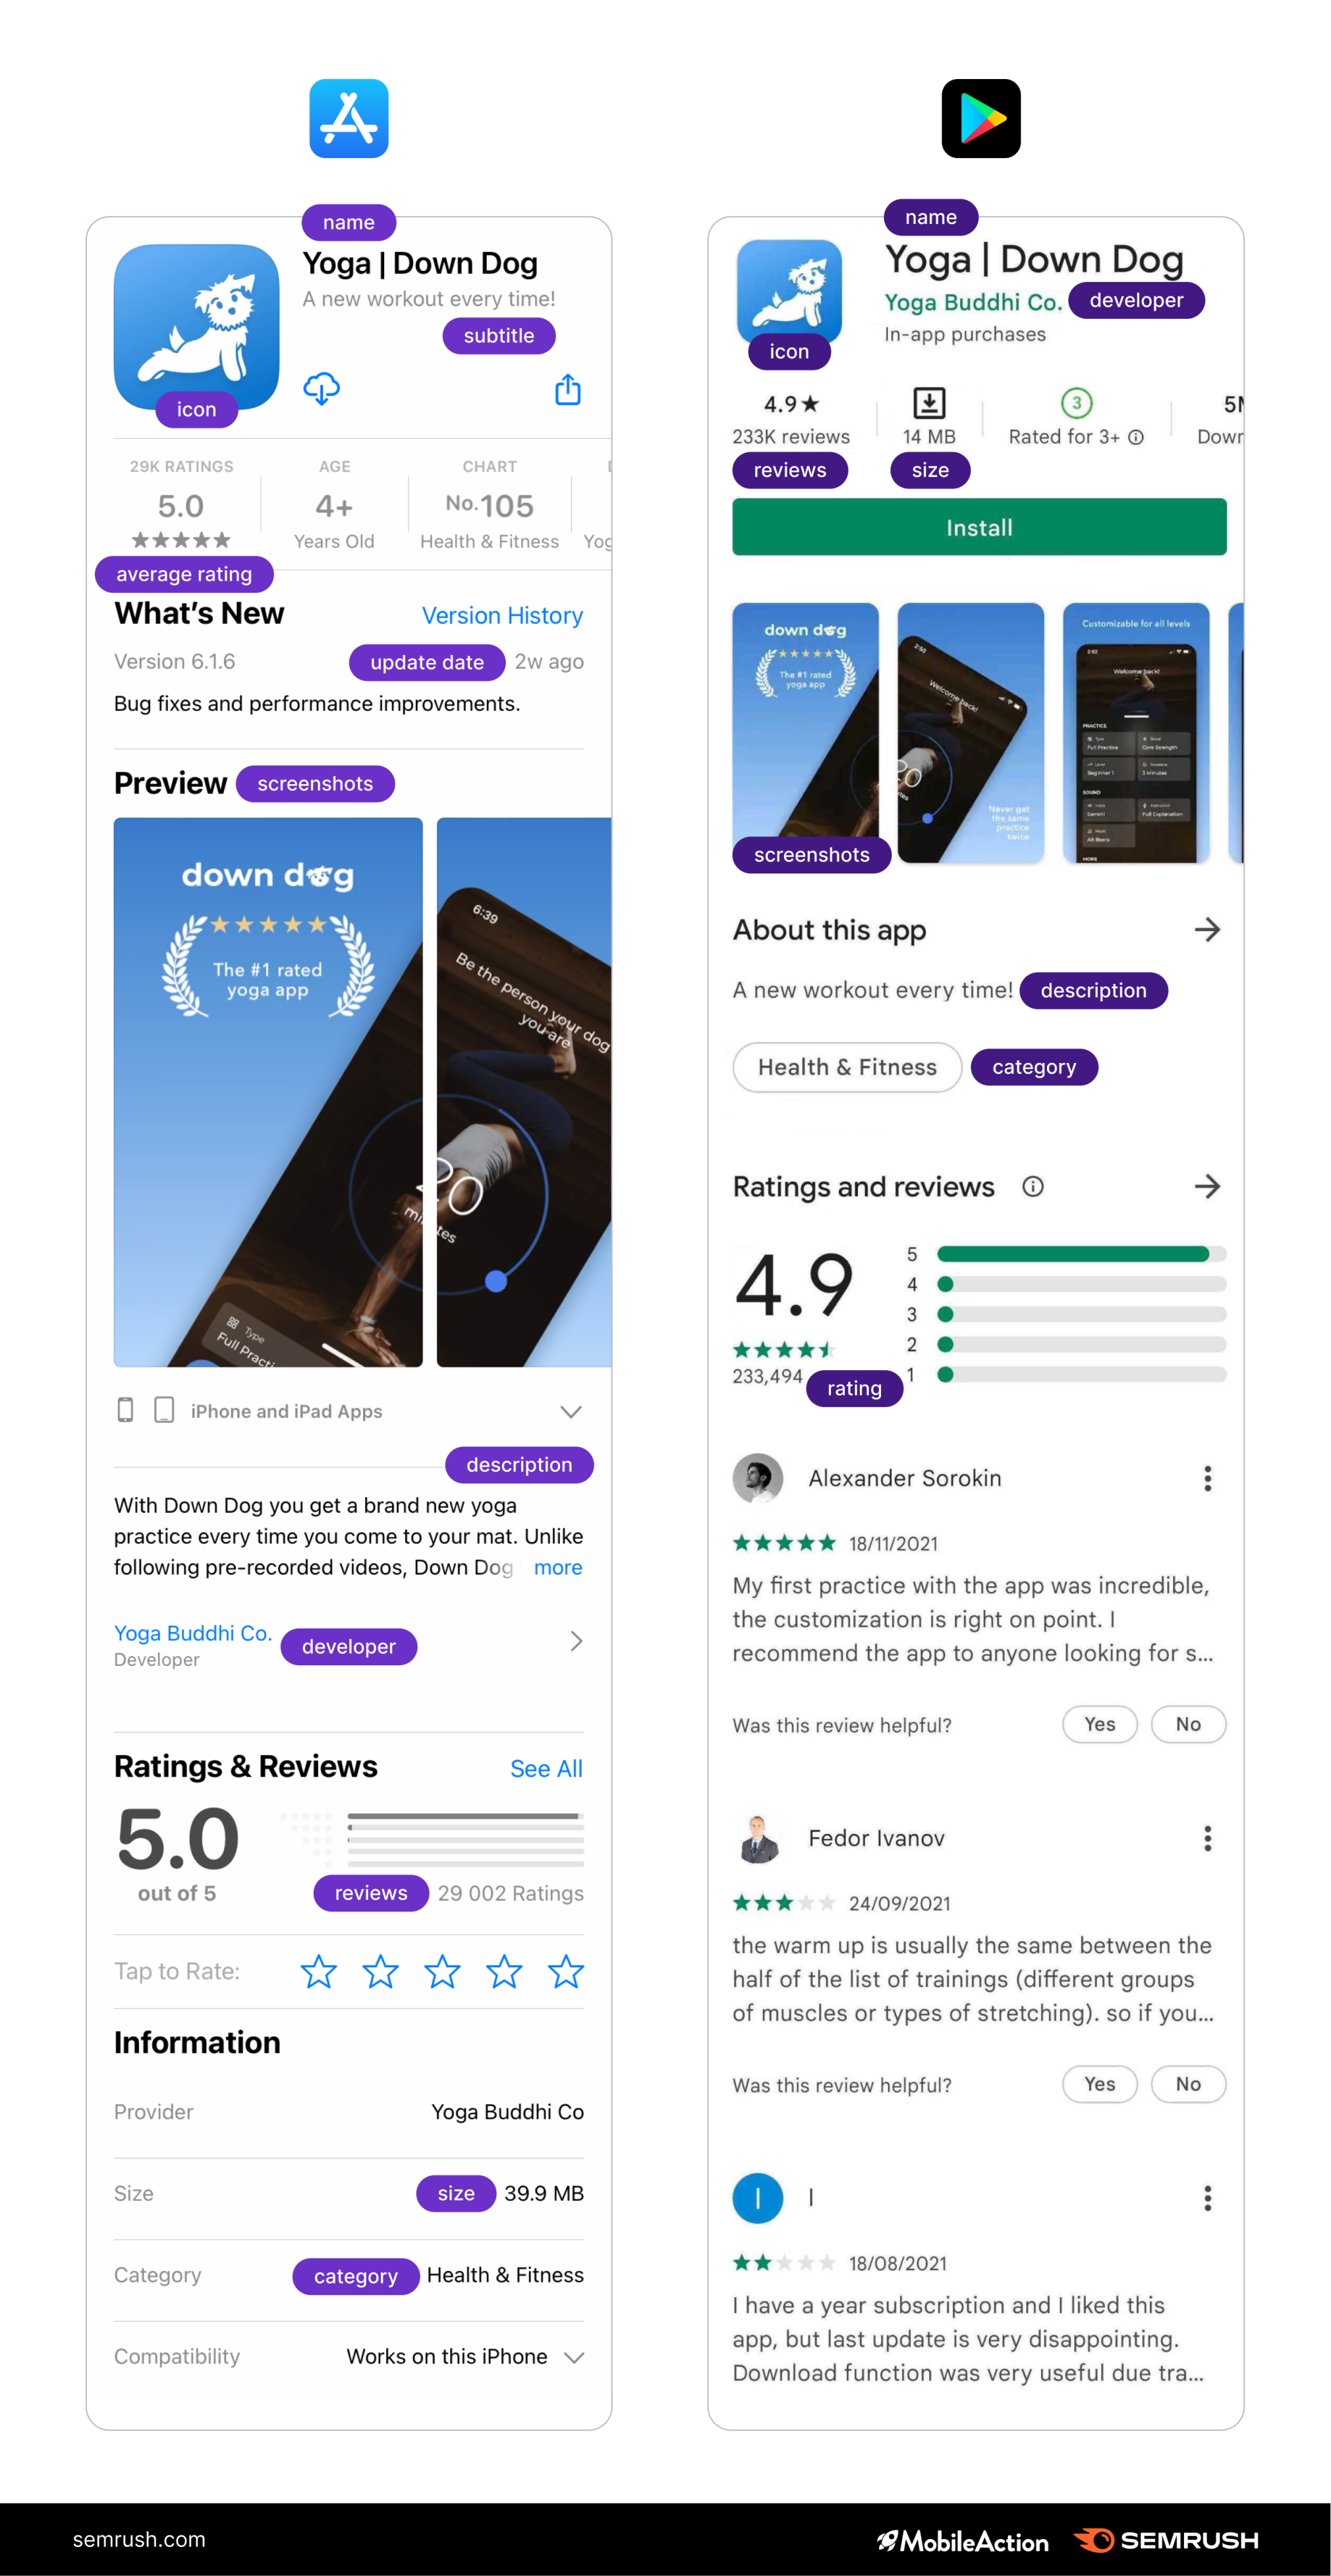
Once we had pulled all the data, we grouped the metrics into four categories:
User-driven factors: how ratings, comments, and other user evaluation criteria affect apps’ performance in search. Representation features: potential impact on rankings of everything from app name and subtitle to description and icons. Technical features: how things like app size or monetization model potentially influence apps’ visibility. Branding factors: possible importance of the weight of the brand.App Store Optimization: Examining the Top-Performing Apps
Although similar, the Play Store and the App Store each have their peculiarities. So, we’ve separated our study into two key parts:
Findings for the App Store; and Findings for the Play Store.Now, let’s see what it is that shapes the top-notch performance of the 10 best-ranking apps within their categories.
Dissecting ASO For the App Store (iOS)
(How) Do User-Driven Factors Affect Apps’ Rankings?
Ratings
Our analysis shows that ratings don’t determine an app’s position within the top 10. In fact, the average ratings for apps that make it into the top 3 tend to be lower than for apps ranking below position 3.
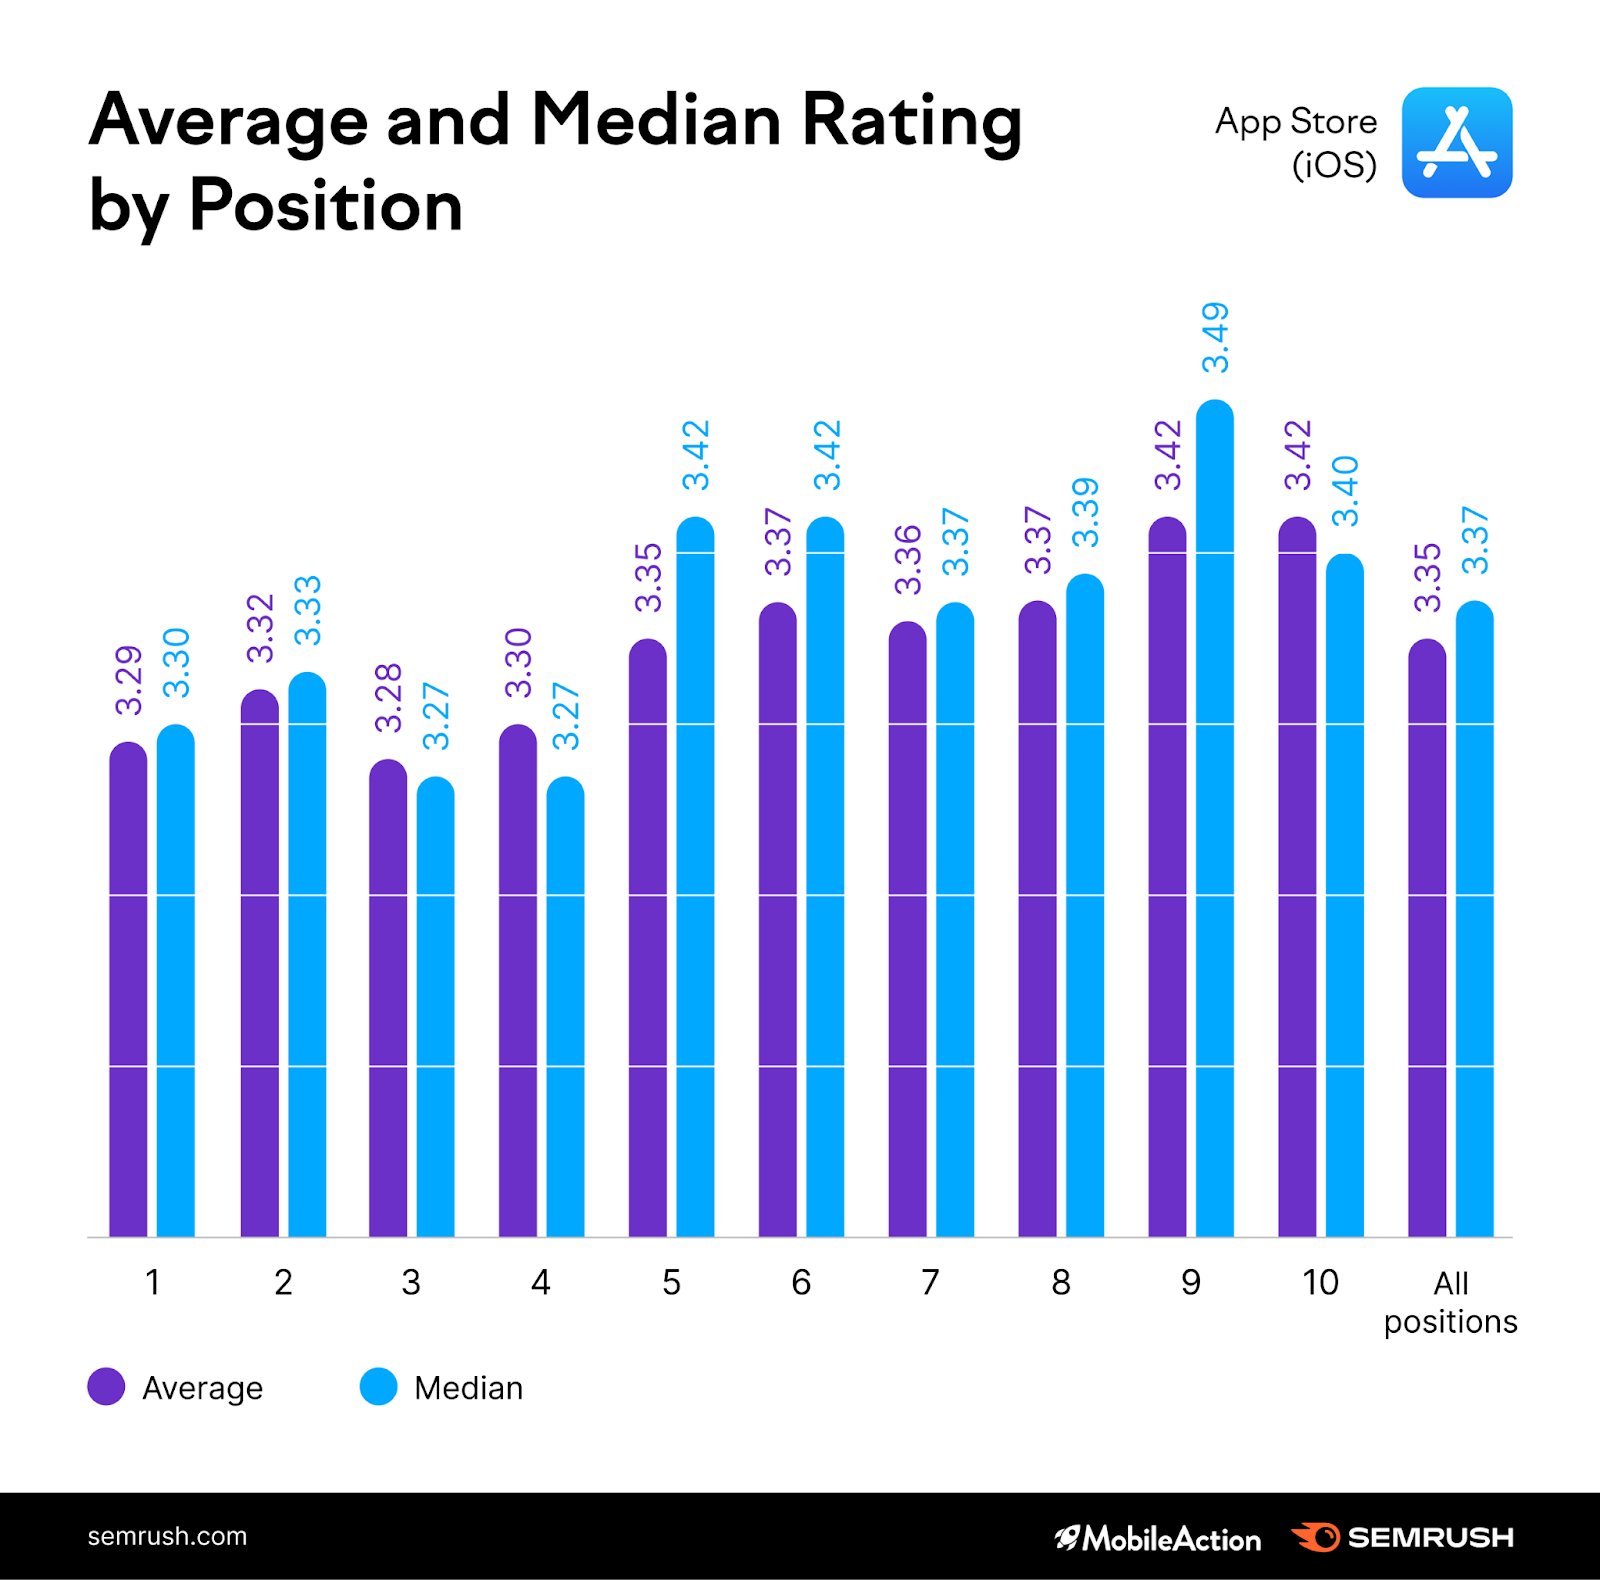
If you think that your rankings lag because you lack a 5-star rating, you’re mistaken. The average app rating for positions 1 to 5 is about 3.3 stars.
Maybe there are some differences from one category to another? We looked at that too.
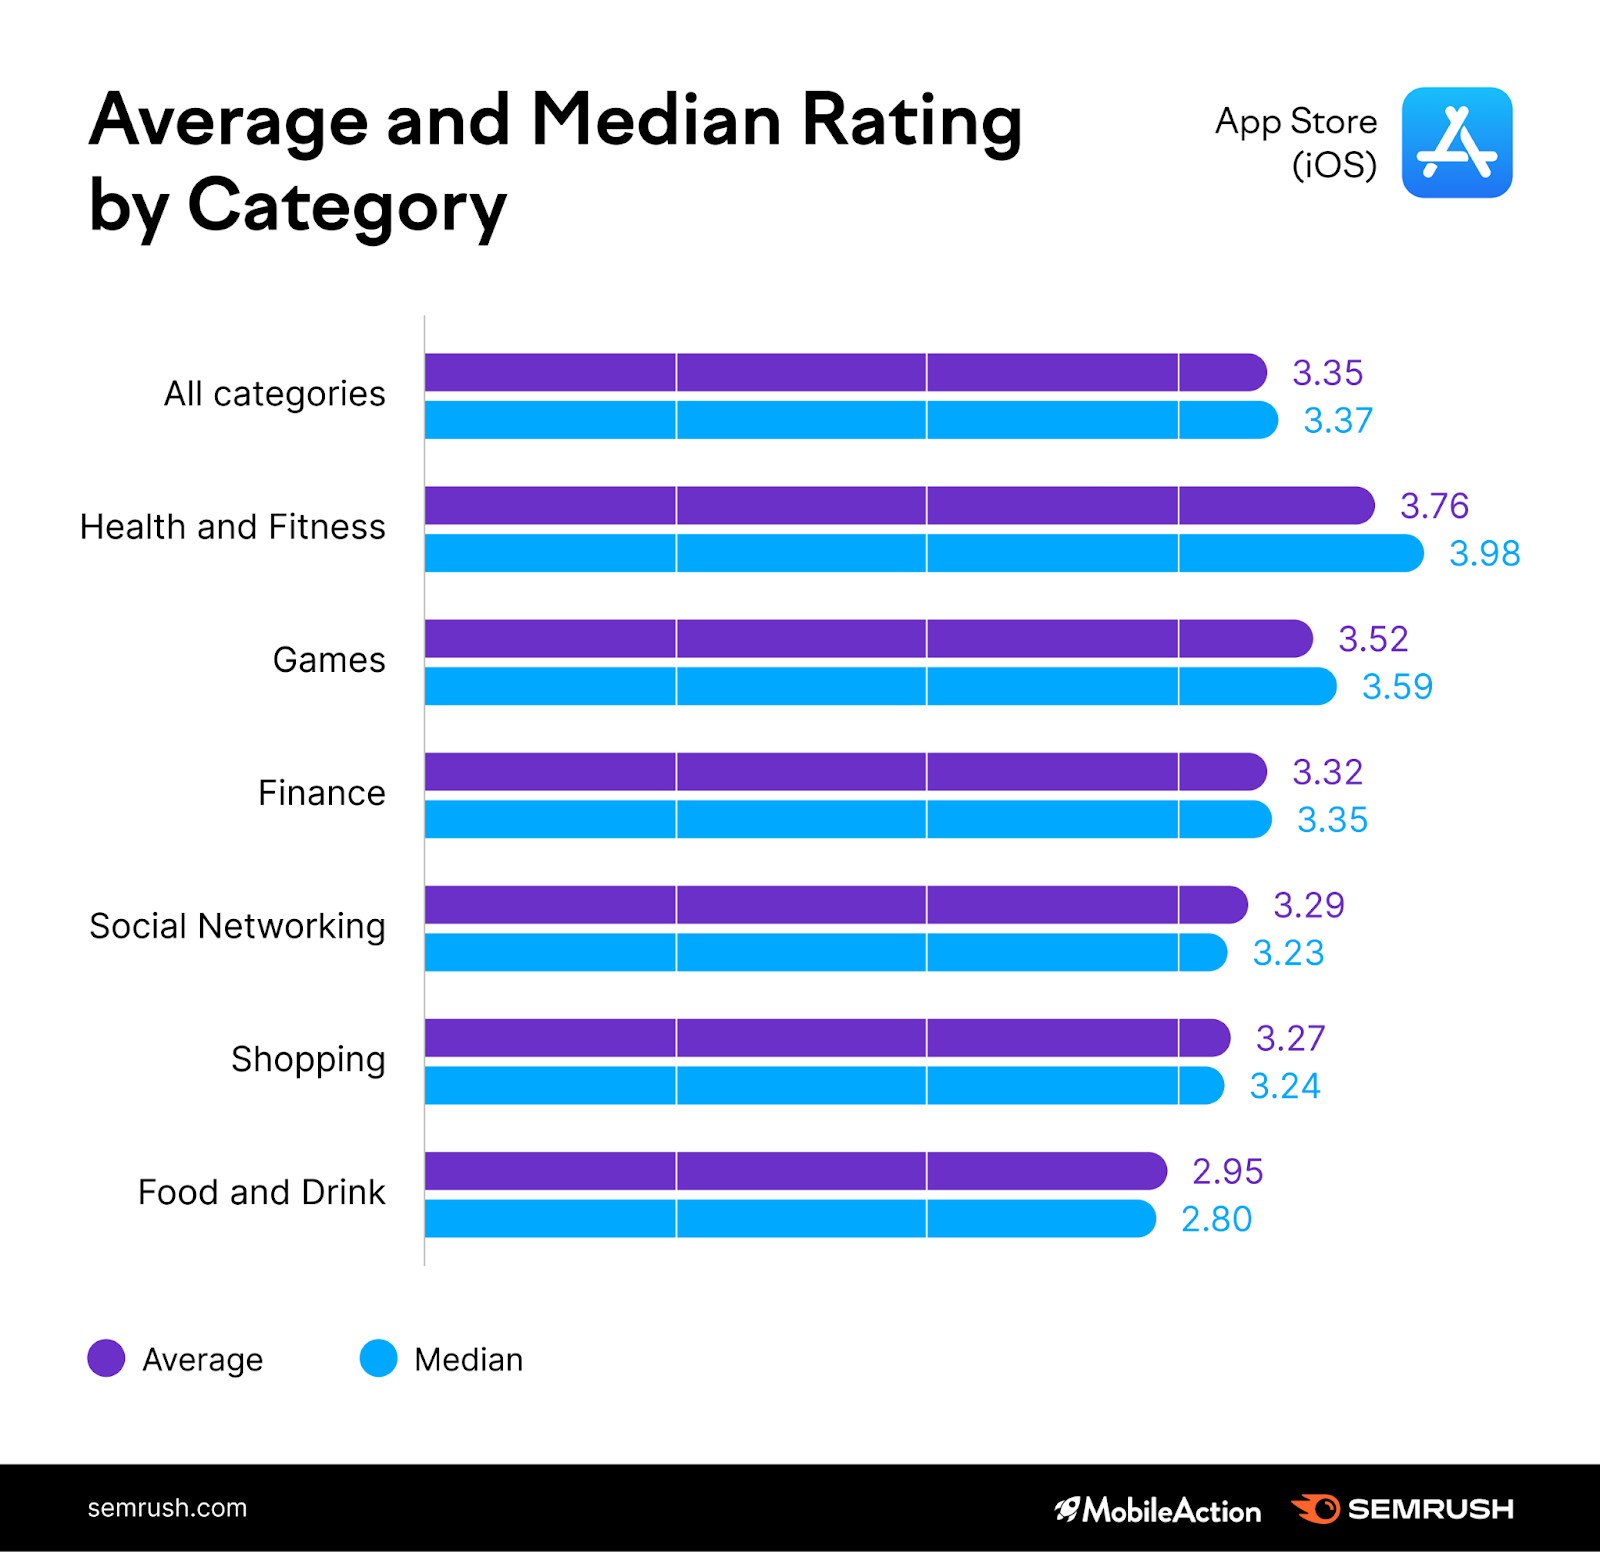
Apps in the Health and Fitness category tend to get the highest ratings from users; their average is close to 4 stars. The only category that shows a significant drop in user satisfaction is Food and Drink — the averages here don’t even make it to 3 stars.
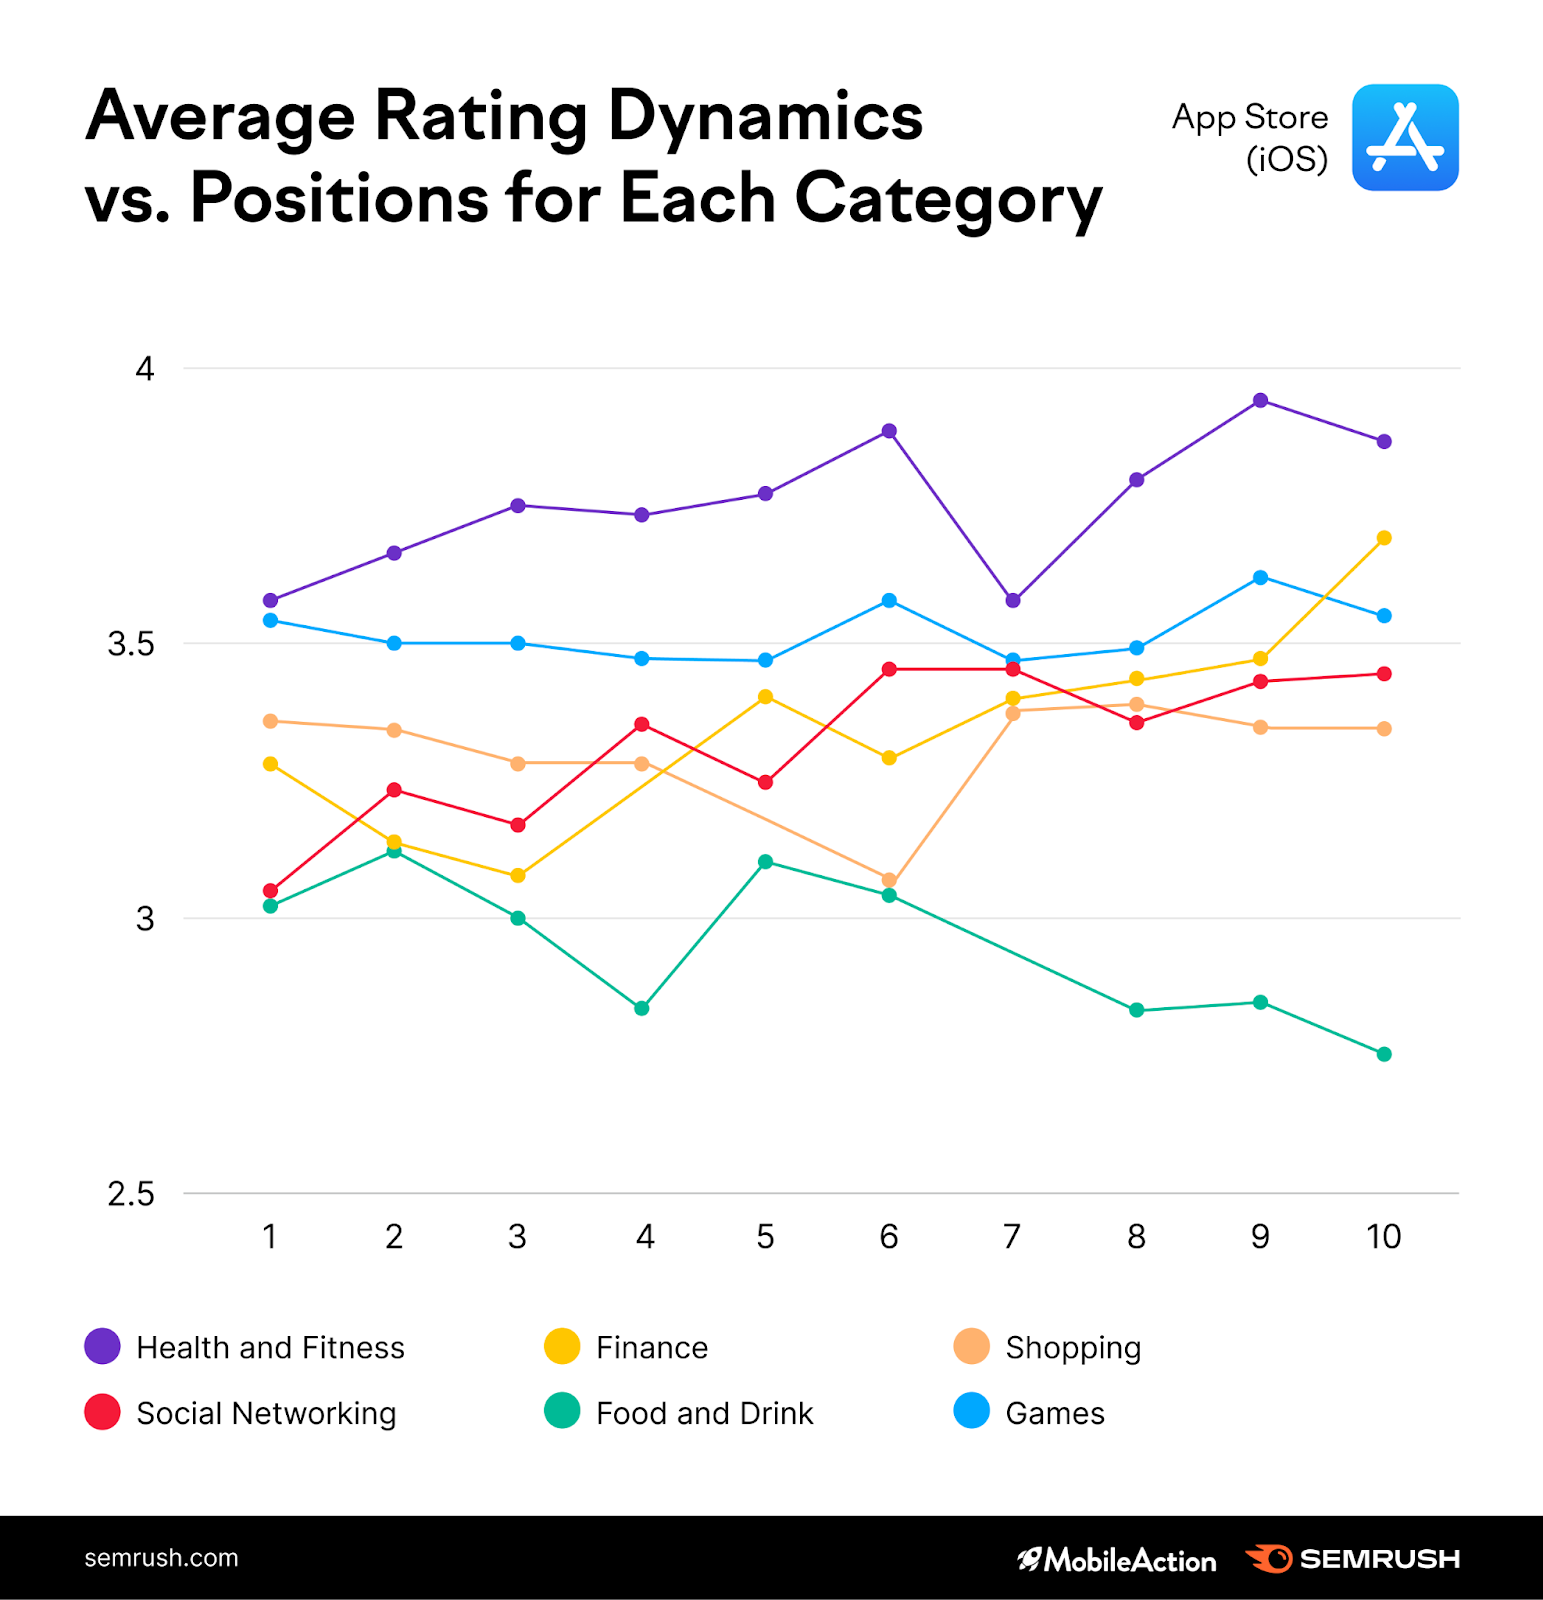
As for rating dynamics versus app position, we can see that various categories show somewhat mixed trends. While Food and Drink apps return a more coherent picture — the lower the ratings, the lower the rankings — Finance and Social Networking apps witness a reverse trend.
Pro tip: While the App Store doesn’t seem to care much about ratings when ranking apps, users do pay attention. So, while ratings don’t directly impact apps’ performance, they might have an indirect impact, influencing conversions, which in turn affect your rankings.
Reviews
Unlike ratings, reviews have a more direct correlation with rankings. Our data shows that the more reviews you have, the higher the position you take.
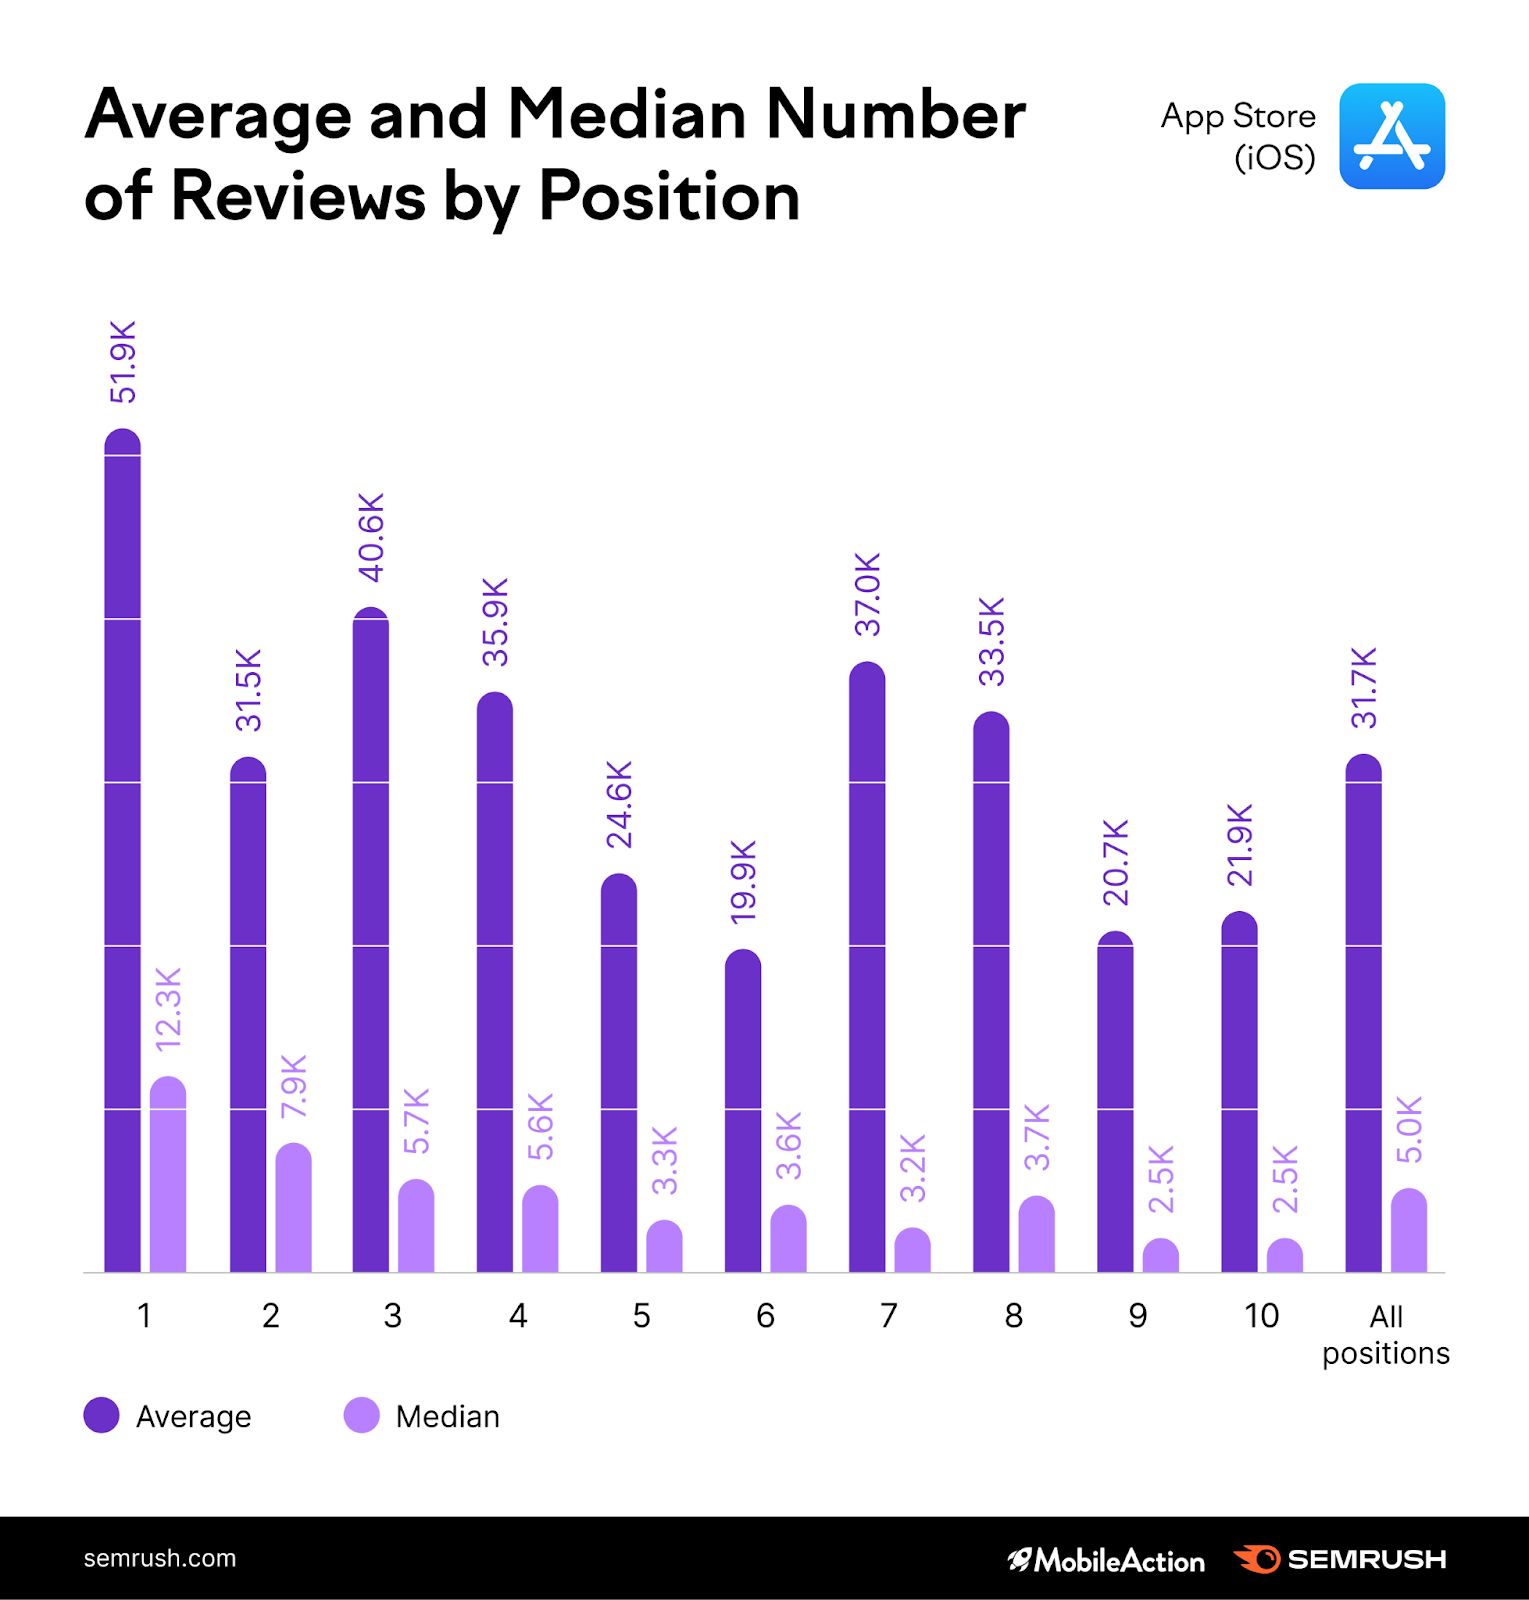
As you can see, with reviews, the averages tend to show a high discrepancy with the median values. This implies that some apps return a lot more reviews than the rest. Therefore, it’s the median numbers you should be looking at here.
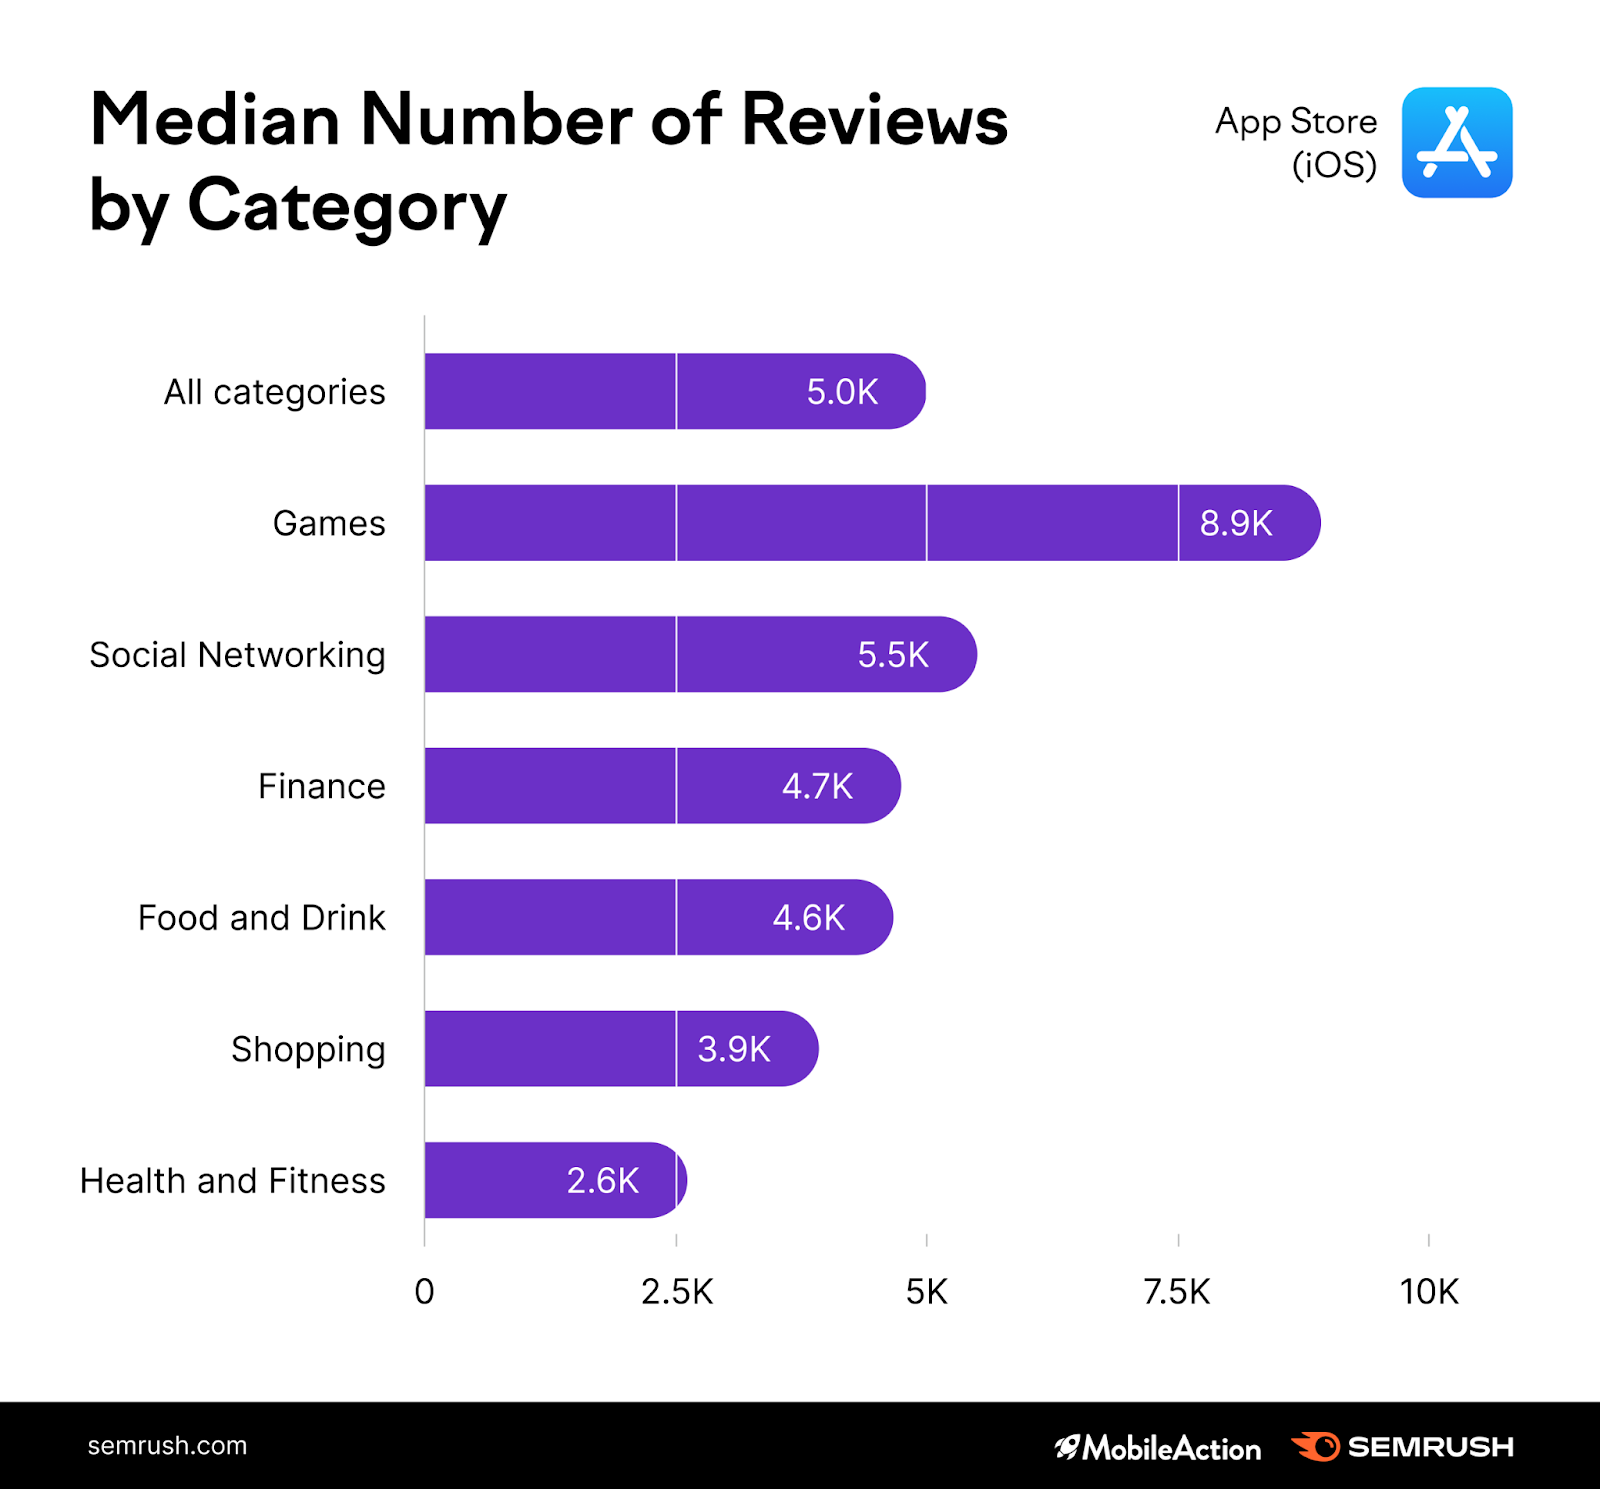
Category-wise, Gaming apps attract the largest amount of user feedback, with the average being at 9K reviews. The category that shows the lowest volume of reviews is Health and Fitness, our ratings leader.
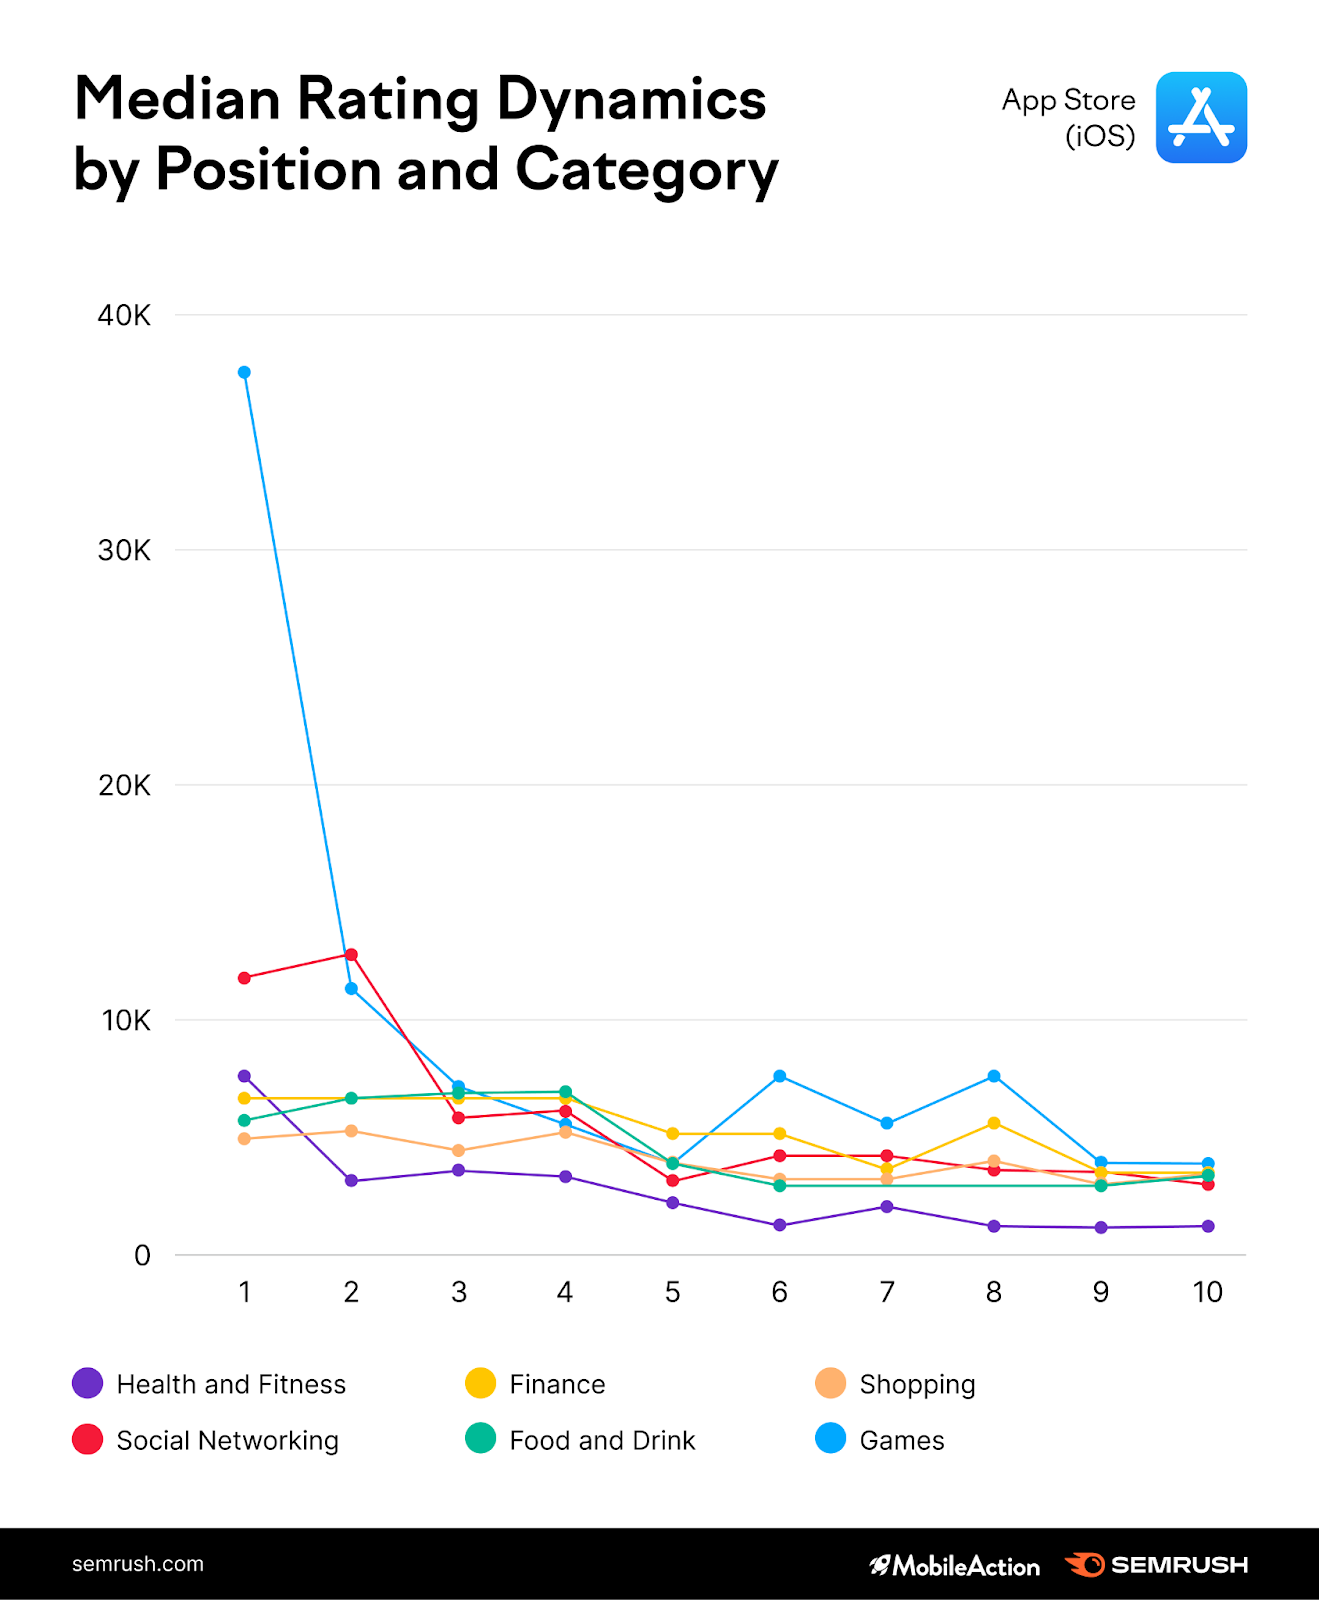
When we look at the reviews-position pairing, it’s the Games category once again that witnesses a sharp decrease in rankings due to a drop in user feedback. Other niches show more even patterns, without any dramatic downturns.
(How) Does the Way You Present Your App Impact Position?
App name
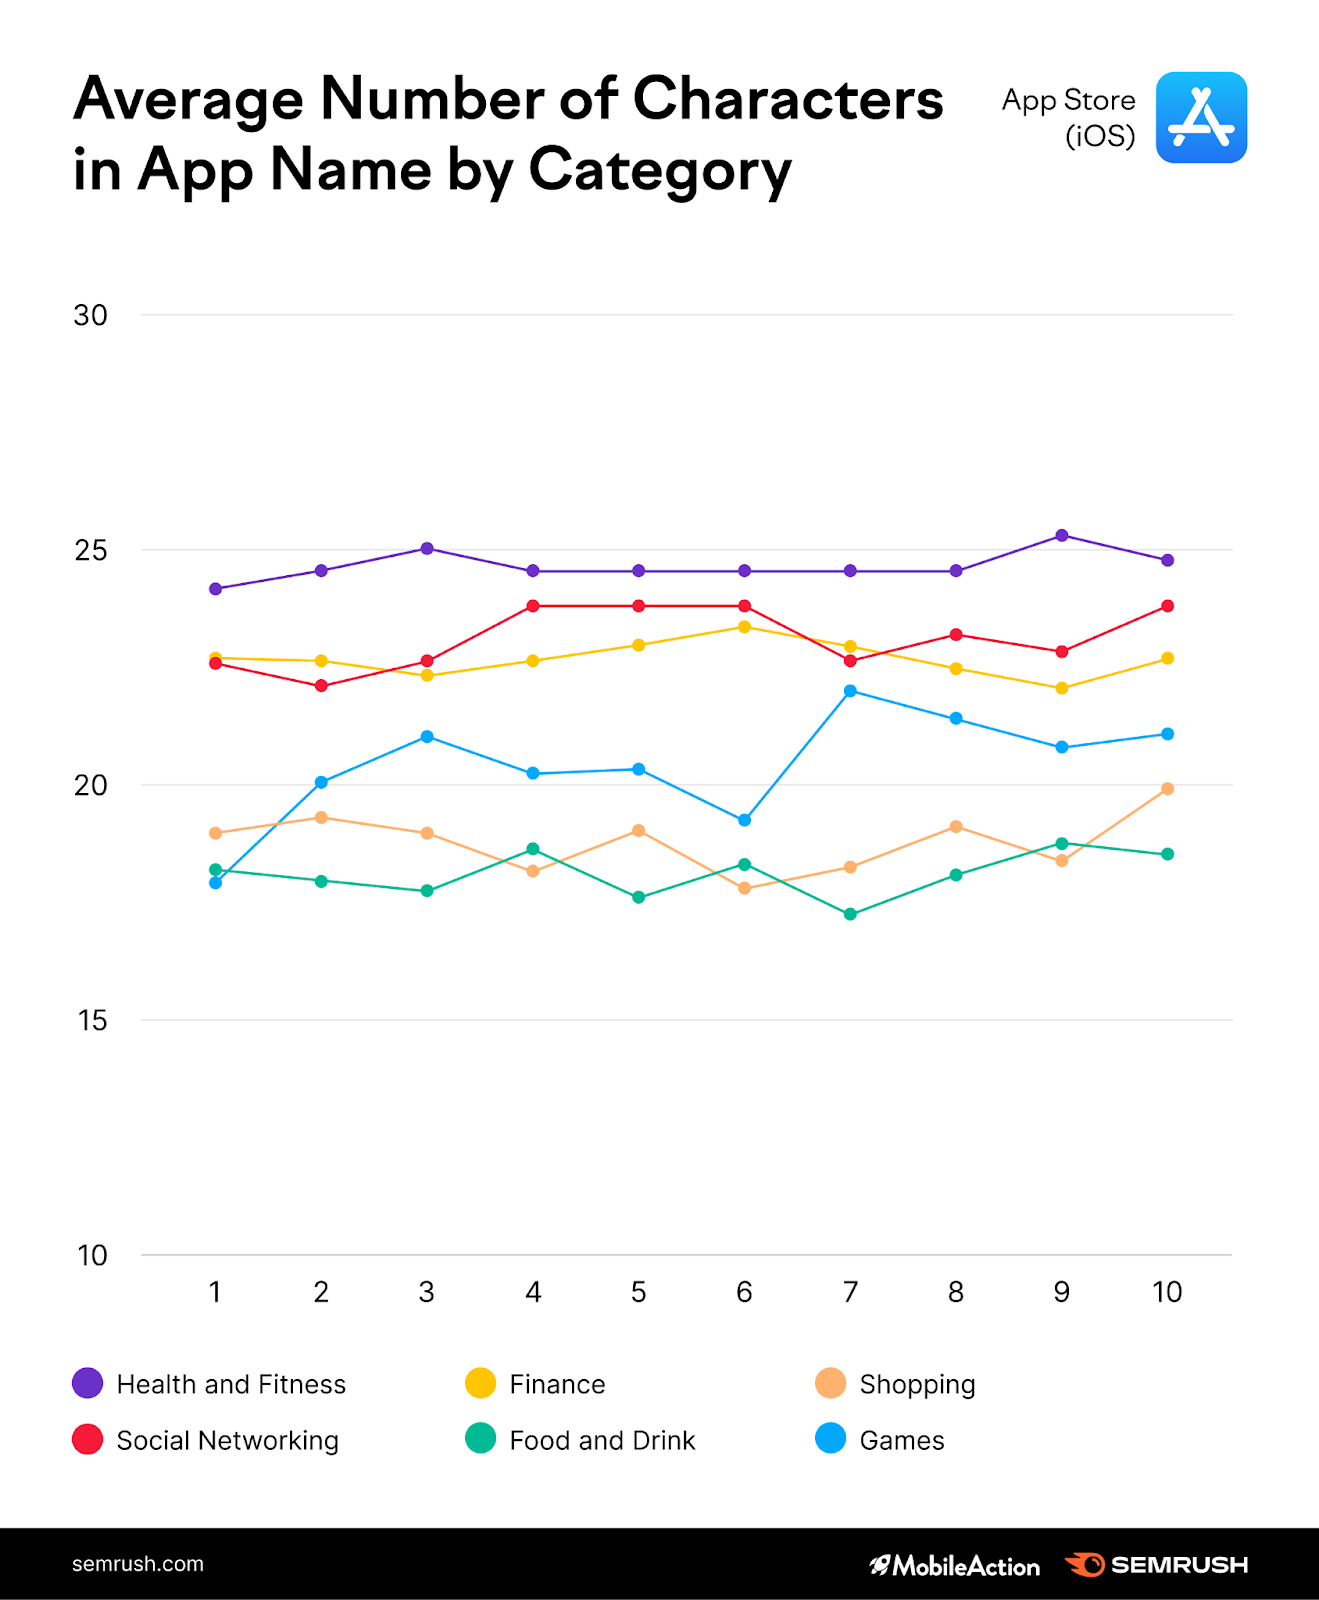
On average, app names on the App Store have around 21 characters, and are about 4 words long.
The wordiest categories are Health and Fitness and Finance (27 characters), while the Food and Drink apps prefer to keep things more concise (18 characters).
When it comes to impact assessment, we spotted no correlation between name length and position. As you can see from the graph below, character counts tend to stay almost the same regardless of position changes.
Now, does anything change when we look at the presence of keywords within the app title?
For instance, if the target keyword is dating, do the apps that include dating in their name rank higher than those that don’t?
To assess this, we’ve designed a metric that evaluates the level of similarity between a keyword and the title. We have a complete match when the metric hits 1, and no match when the value gets down to 0. Note that for this part only, we excluded branded keywords to avoid a situation where, for instance, a search for “Instagram” brings Instagram in the first position.
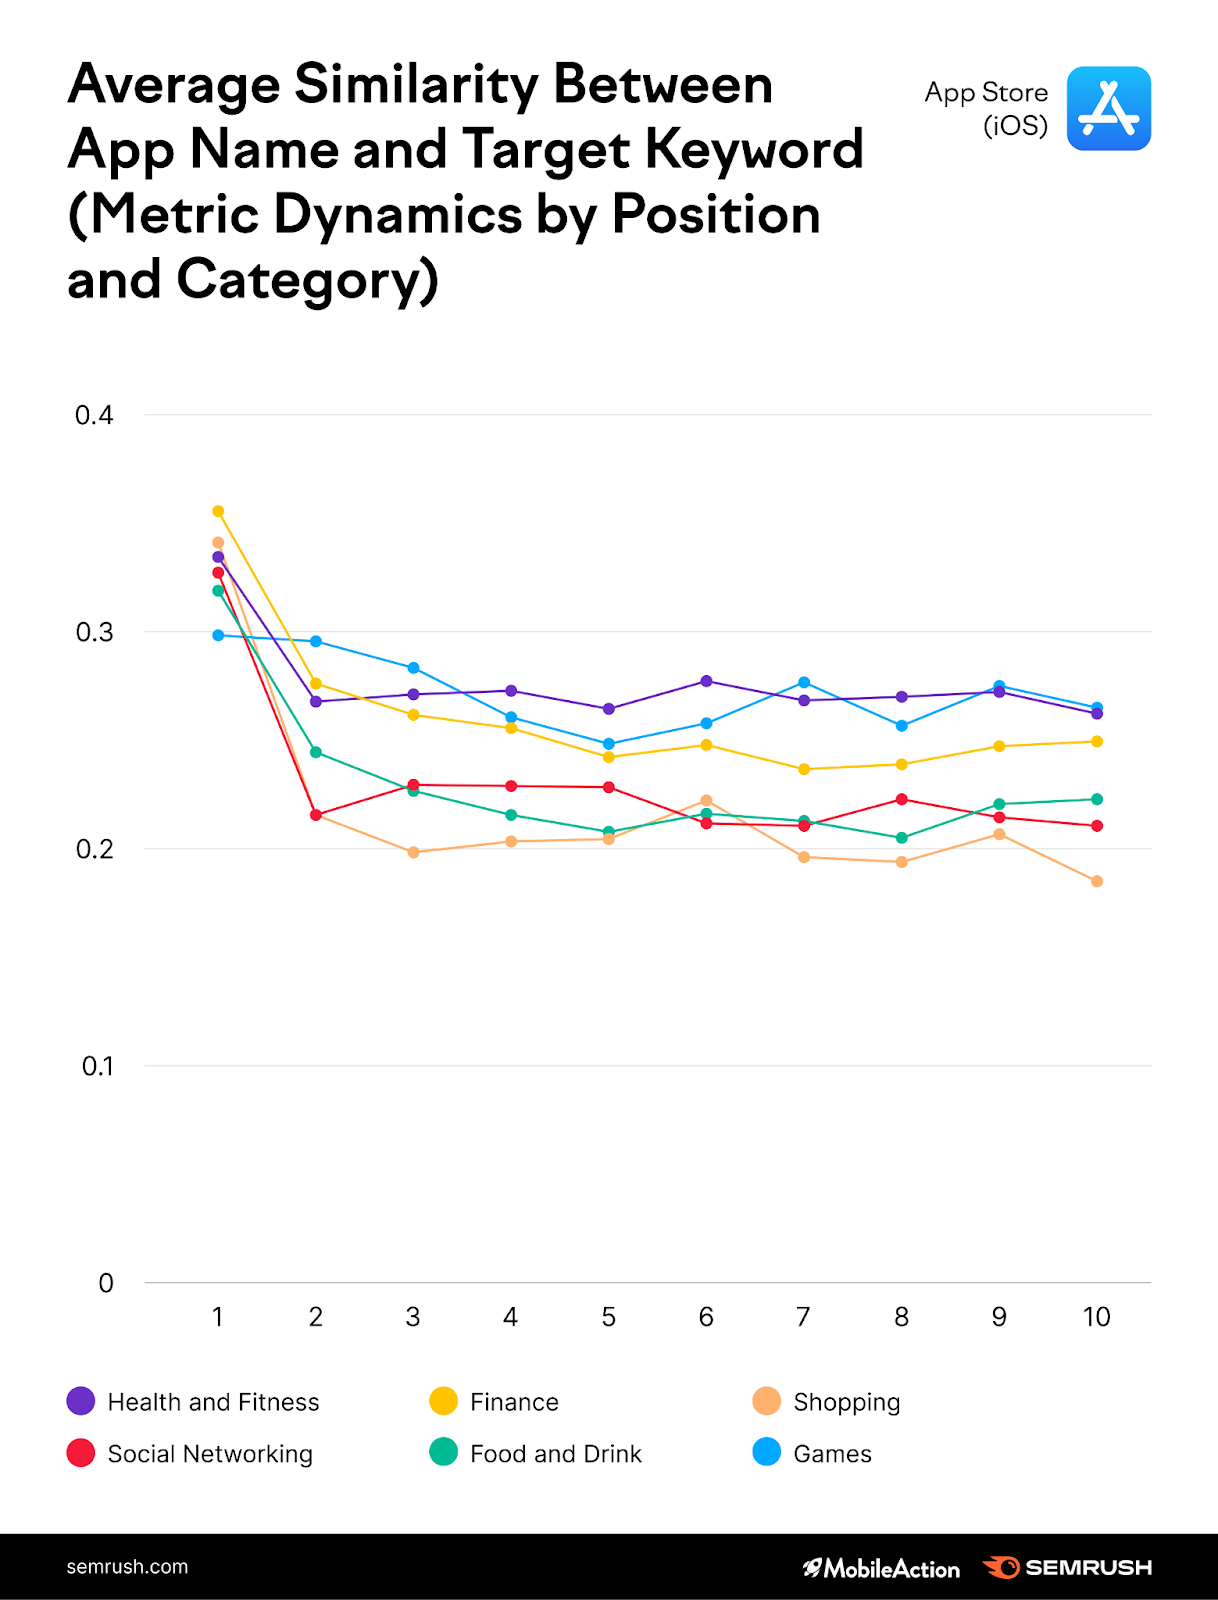
We can notice that apps taking over the top position typically have a close match to the target keyword. This means that you’d better include a keyword within your app name if you want to win the #1 position.
One another observation we made is that many apps include special characters (e.g., “Drop The Number: Merge Puzzle”, “Color Merge Blast - 2048 balls”). So we collected the top symbols appearing in app titles.
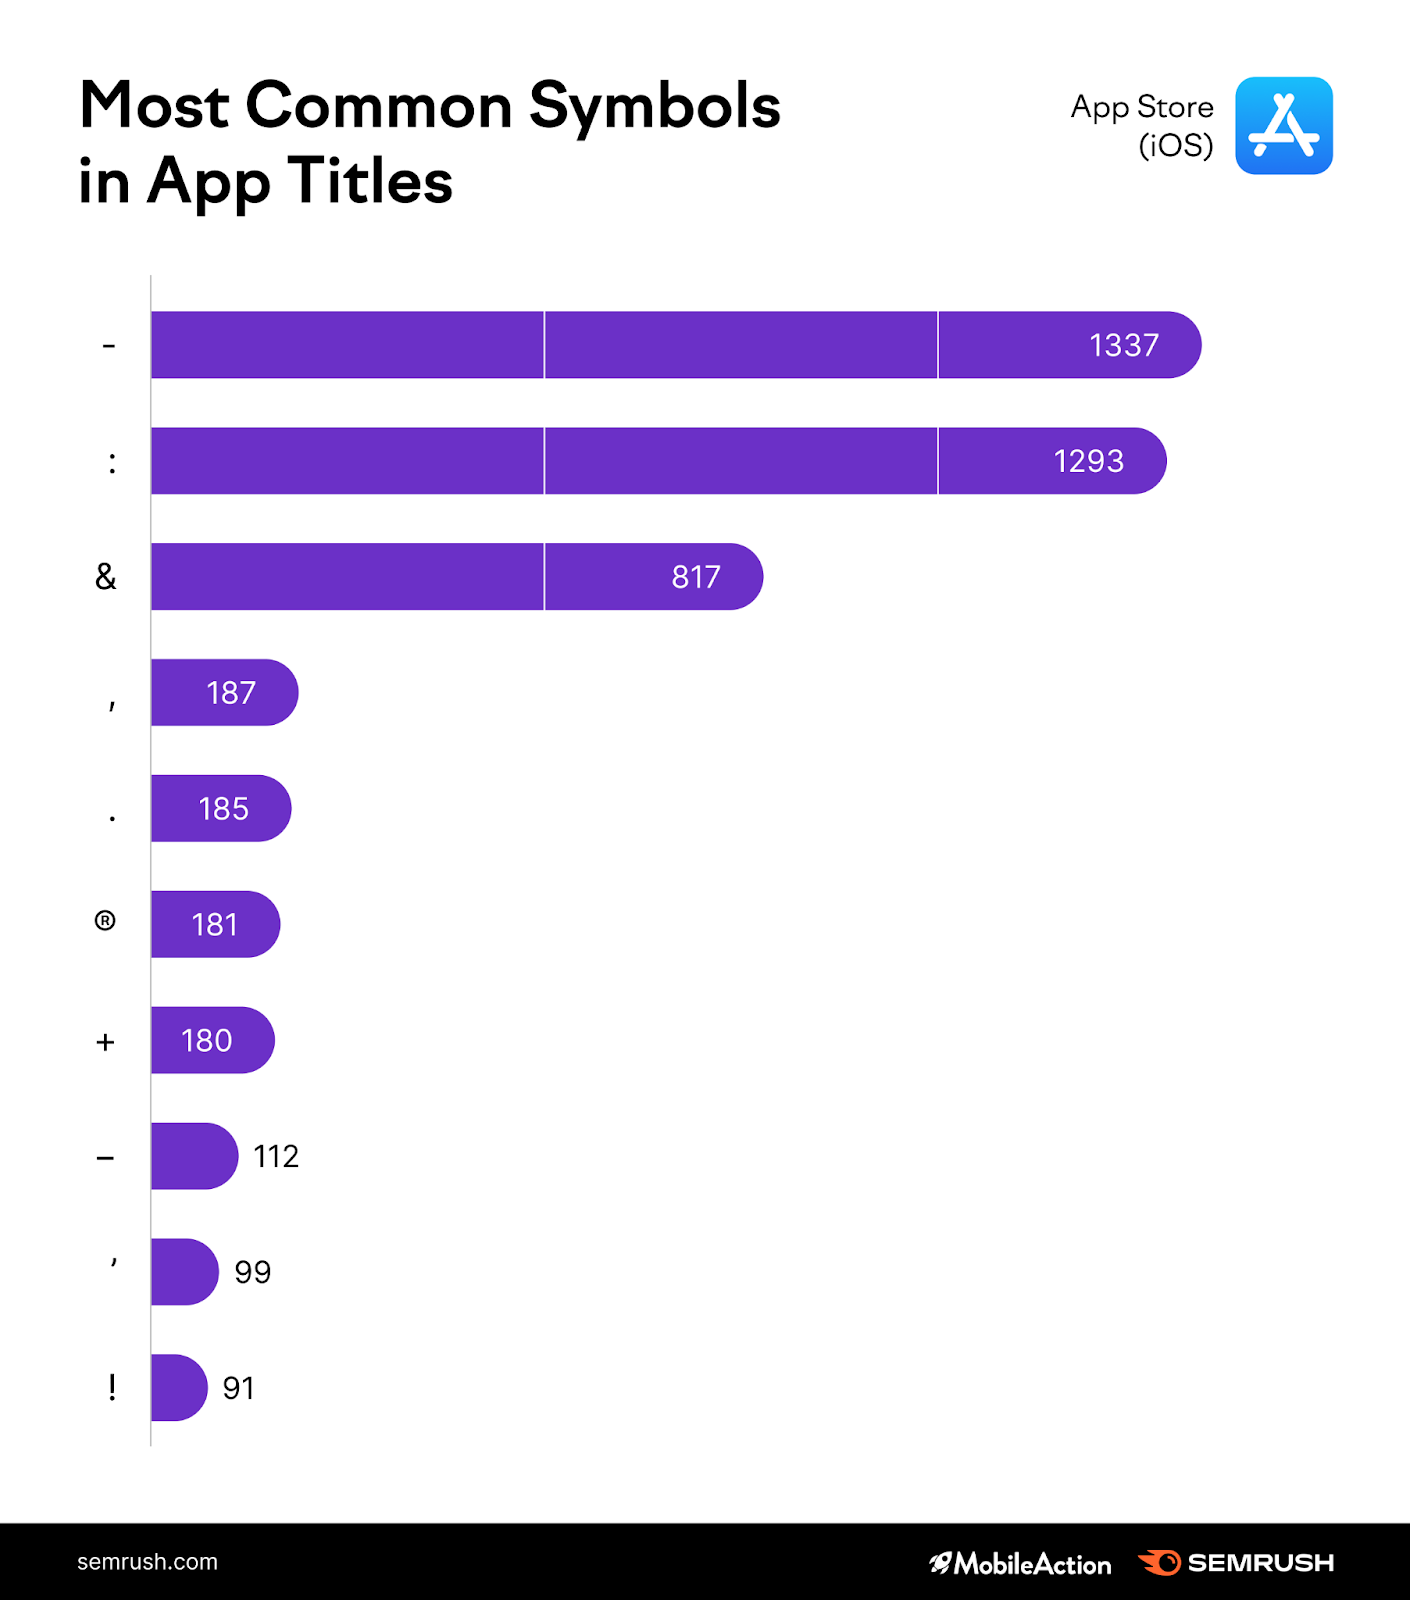
Top apps typically include “-”, “:” and “&” in their app name. Social Networking and Finance apps use special symbols more often than other categories.
App’s subtitle
Our analysis showed that about 80% of all apps within the App Store feature a special subtitle.
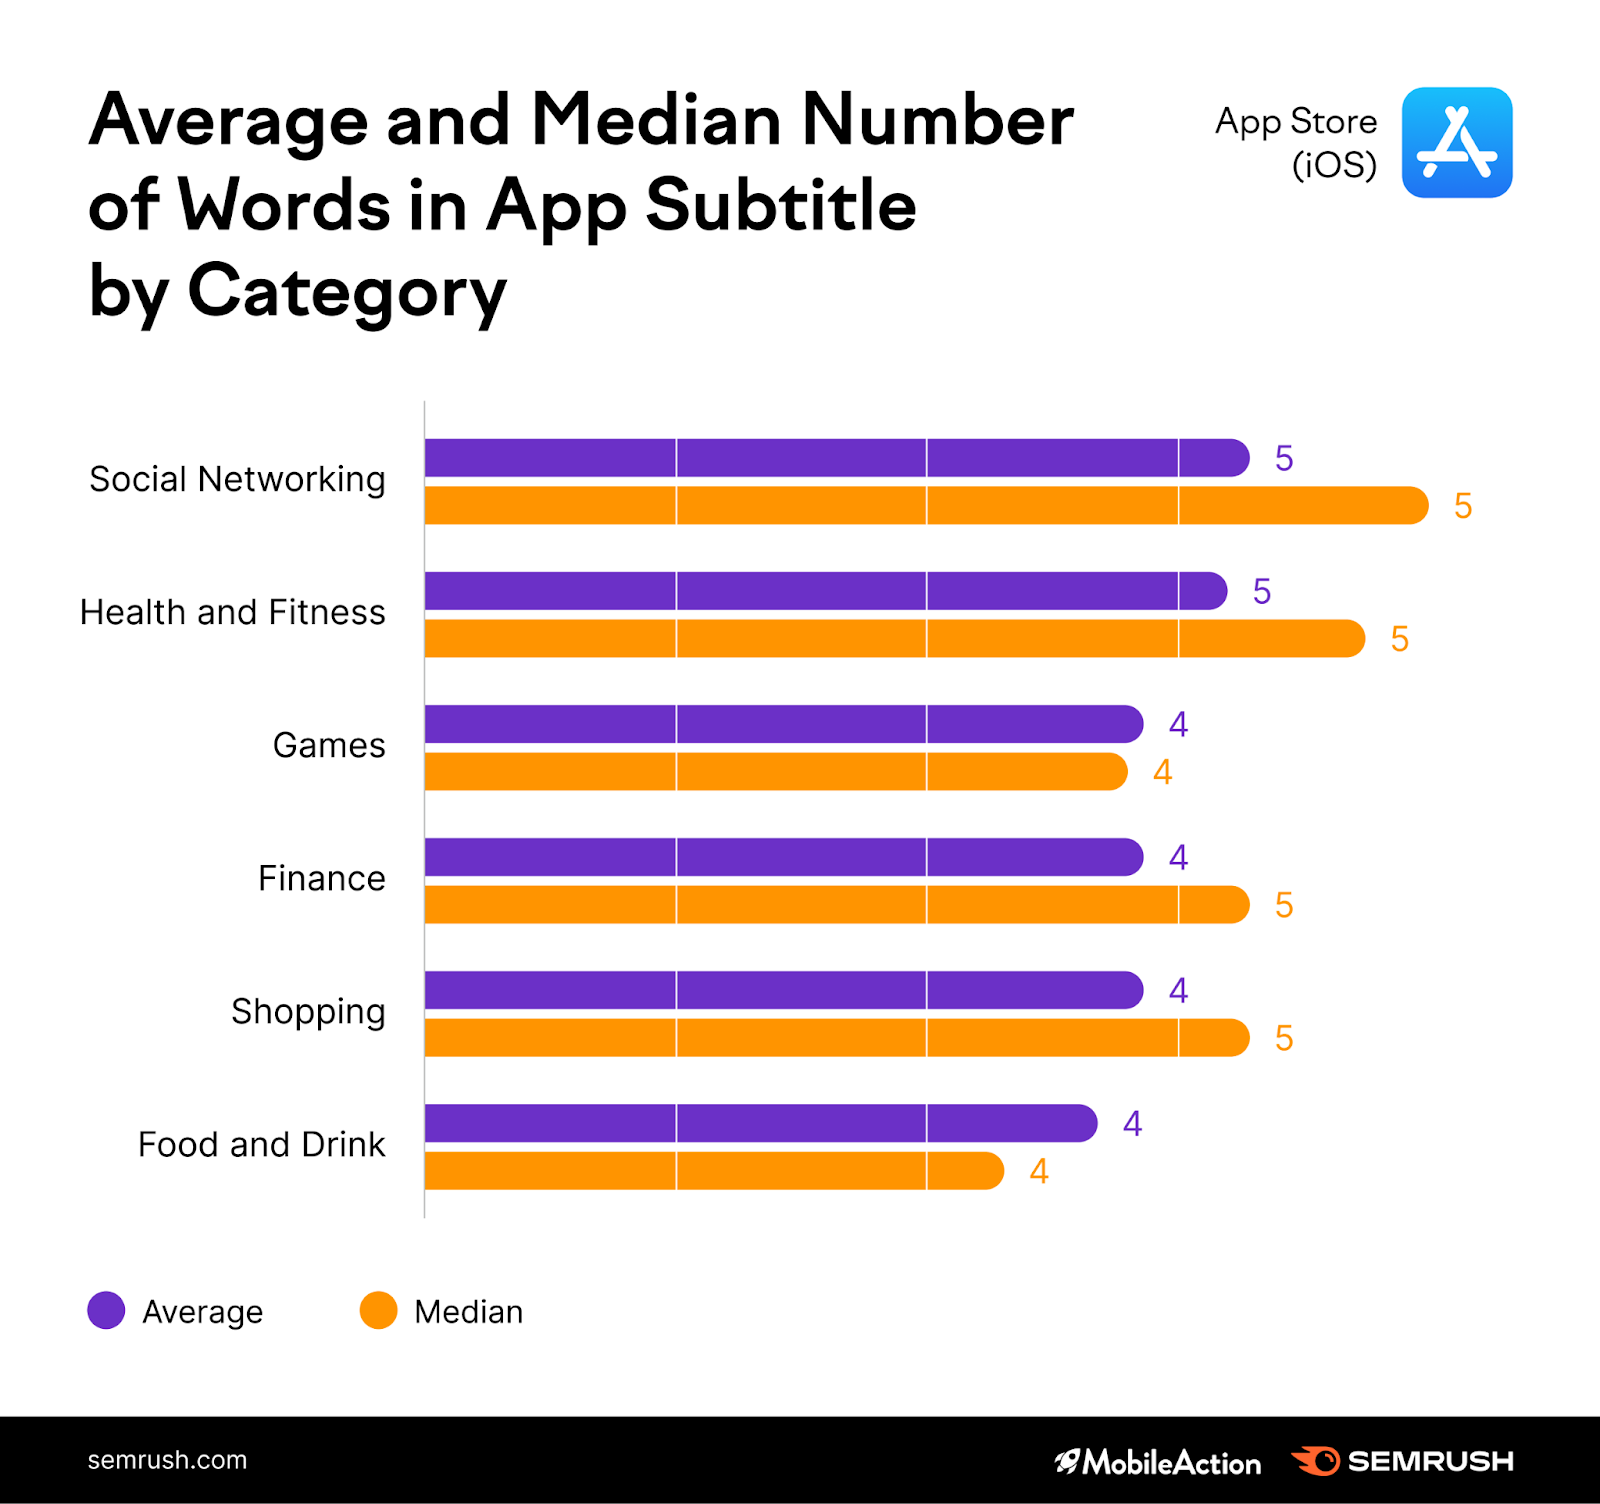
Typically, subtitles are 4 to 5 words long, and there is not much discrepancy between the categories. We also spotted no significant changes in subtitle usage from one position to another.
App’s description
While we know that the App Store doesn’t consider your description when it considers keywords, the number of words in your description appears to affect your position.
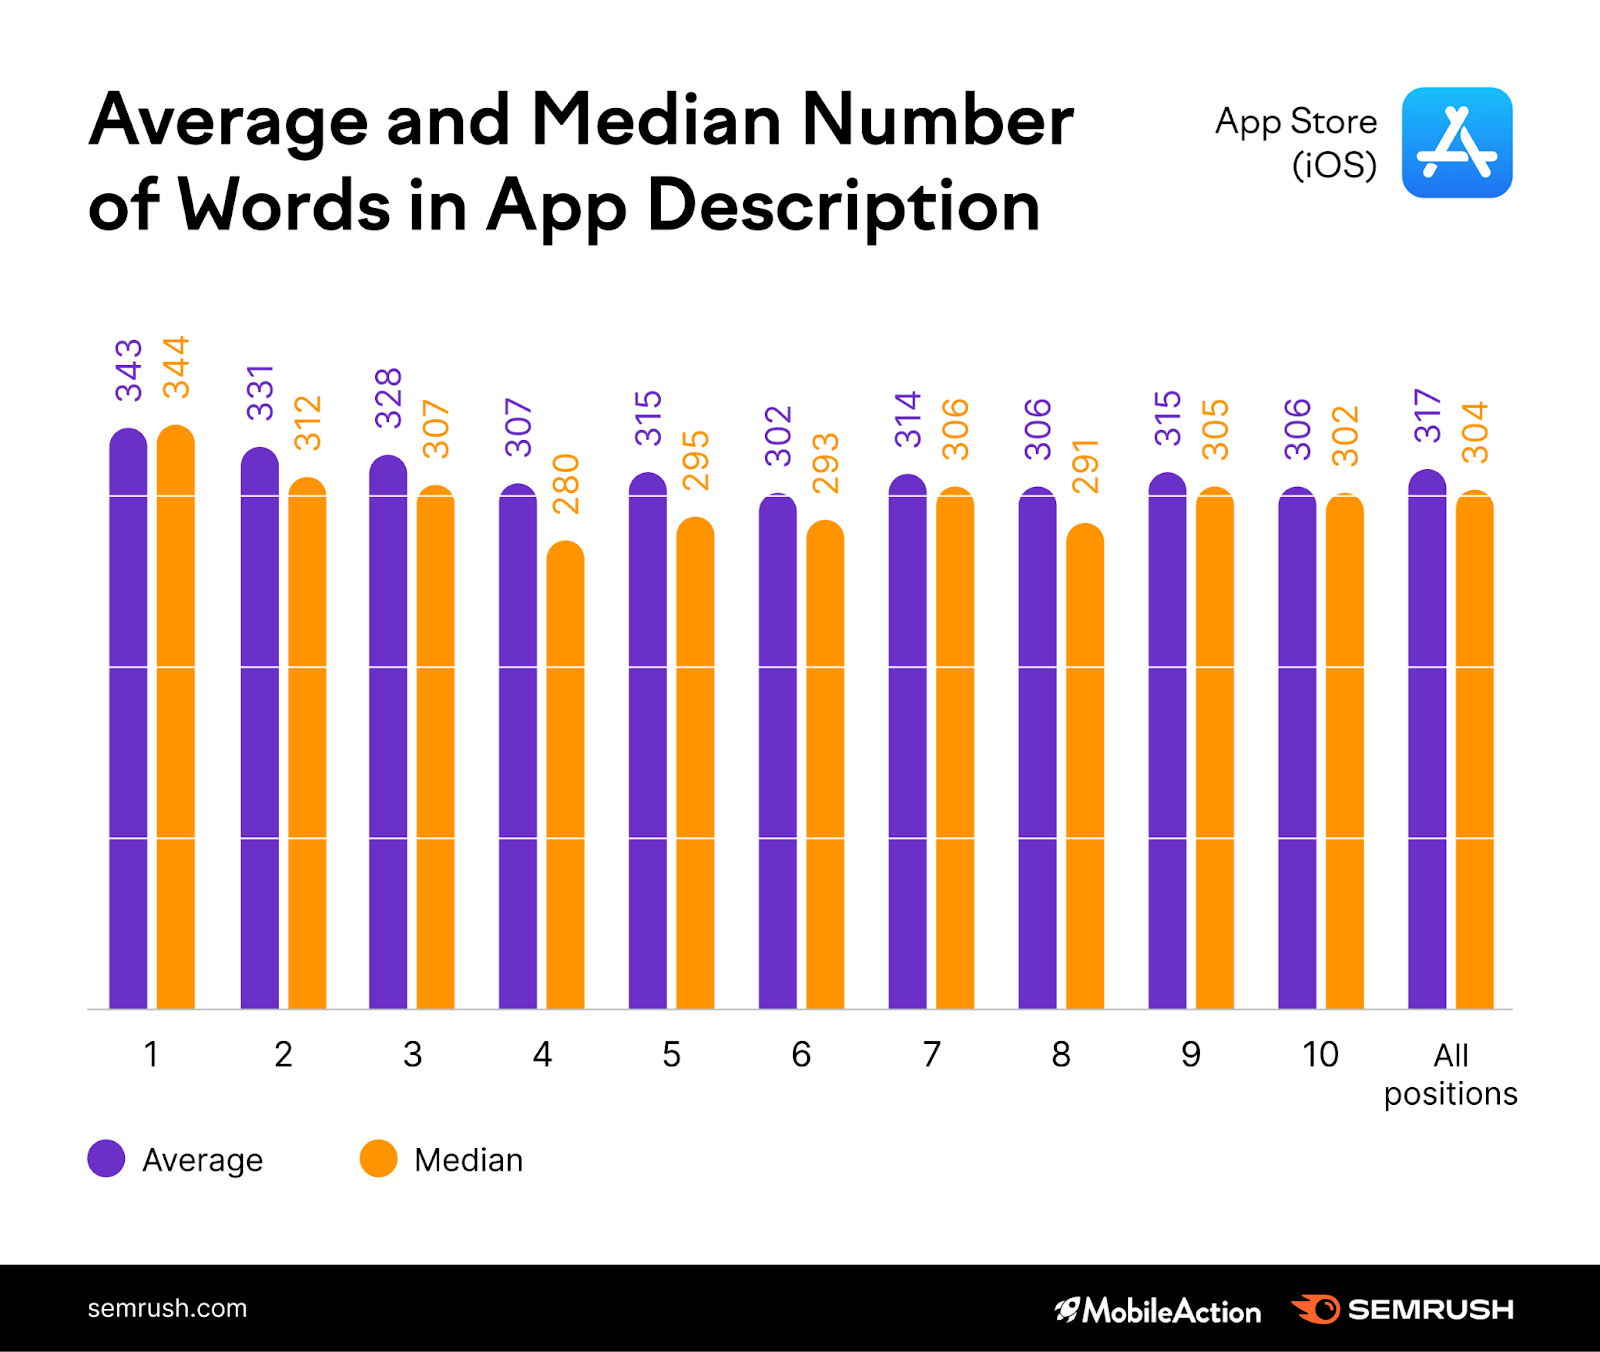
Our data showcased that the lower in rankings apps go, the fewer words they have in their description.
On average, the top-ranking apps across all categories feature about 300 words in the description.
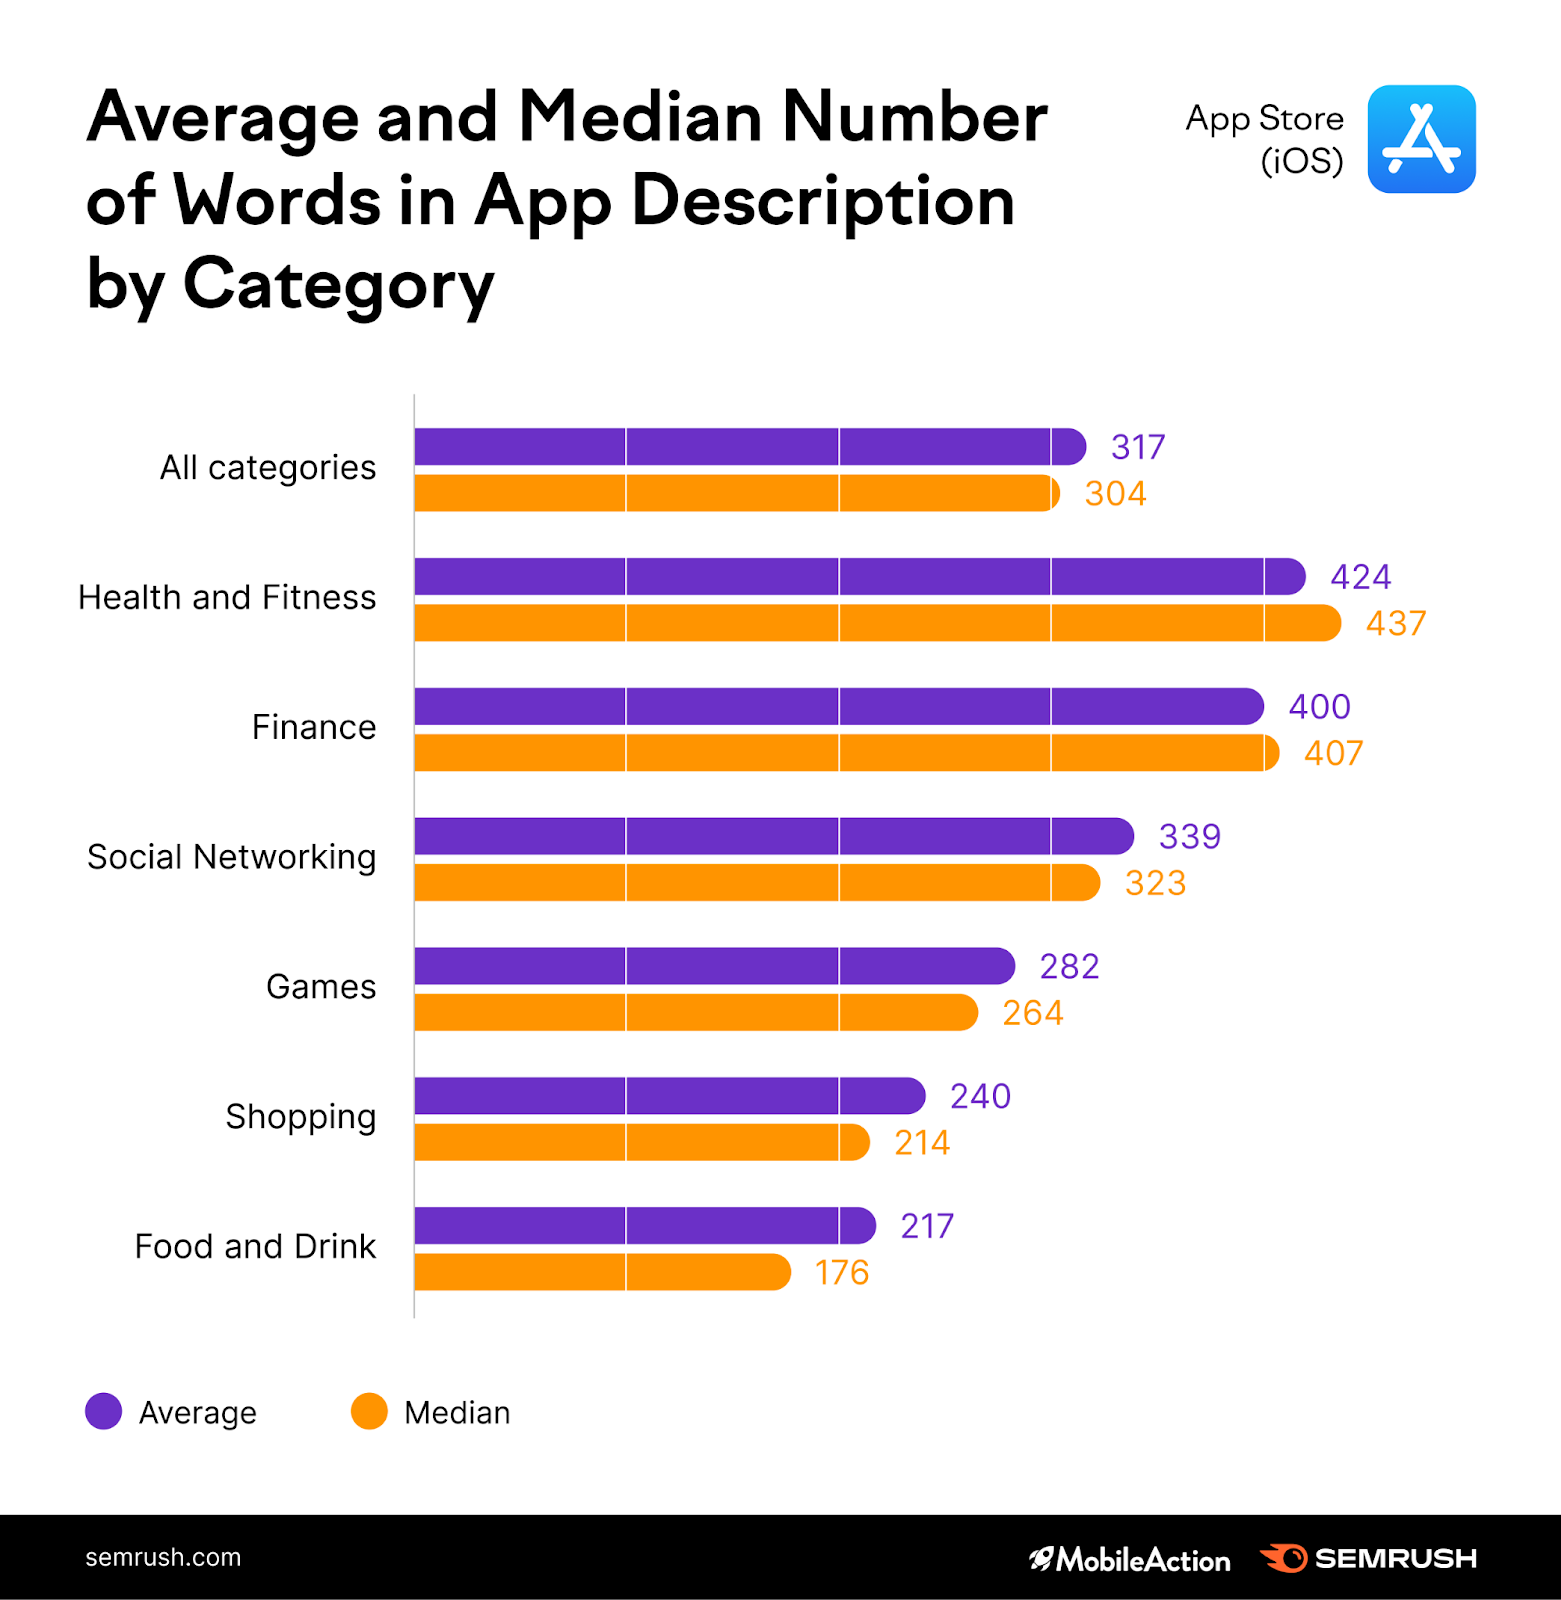
Health and Fitness apps tend to have the longest descriptions (420+ words).
Also, we noticed that apps use descriptions as a place for different calls-to-action (CTA) — all to entice users to install the app.
The table below sums up the most frequent CTAs used in descriptions of different app categories:
Health and Fitness
Social Networking
Finance
PhraseCountPhraseCountPhraseCounthelp you
281
chat with
144
secure
151
heart rate
196
the best
100
send money
110
weight loss
162
new friends
93
manage your
98
the best
127
share your
92
help you
95
easy to use
107
you want
83
you need
89
you need
99
meet new
65
the best
65
your fitness
96
your favorite
61
easy to
53
your sleep
94
easy to use
51
allows you
49
your favorite
80
new people
51
money transfer
47
improve your
72
help you
46
access your
40
keep track
54
allows you
32
track your
40
share your
54
is free
32
sign up
28
thousands of
45
free to download
23
friends and family
27
Food and Drink
Shopping
Games
Phrase
Count
PhraseCountPhraseCountyour favorite
171
the latest
135
the best
309
your order
103
your favorite
129
with your friends
208
the best
95
the best
117
your own
177
food delivery
62
download the app
62
your favorite
100
save your
46
you love
34
become the biggest
99
find your
41
black friday
33
challenge your friends
78
track your
39
the perfect
29
real money
57
help you
35
never miss
27
follow us
52
earn points
29
gift cards
26
compete with
40
you like
29
online shopping
24
show off
39
customize your
28
best deals
24
challenge yourself
35
order food
19
rewards and coupons
23
free to play
35
download the app
18
free shipping
21
3d graphics
24
Pro tip: If your app falls into one of these categories, double-check if your description features some of these phrases. If not, try adding at least a few CTAs from this table, and see if you notice any positive shifts.
App’s icon
Each app within the App Store has an icon.
They can be very minimalistic, but sometimes developers use complex visuals with a lot of colors.
Is there much difference, though? We’ve analyzed this.
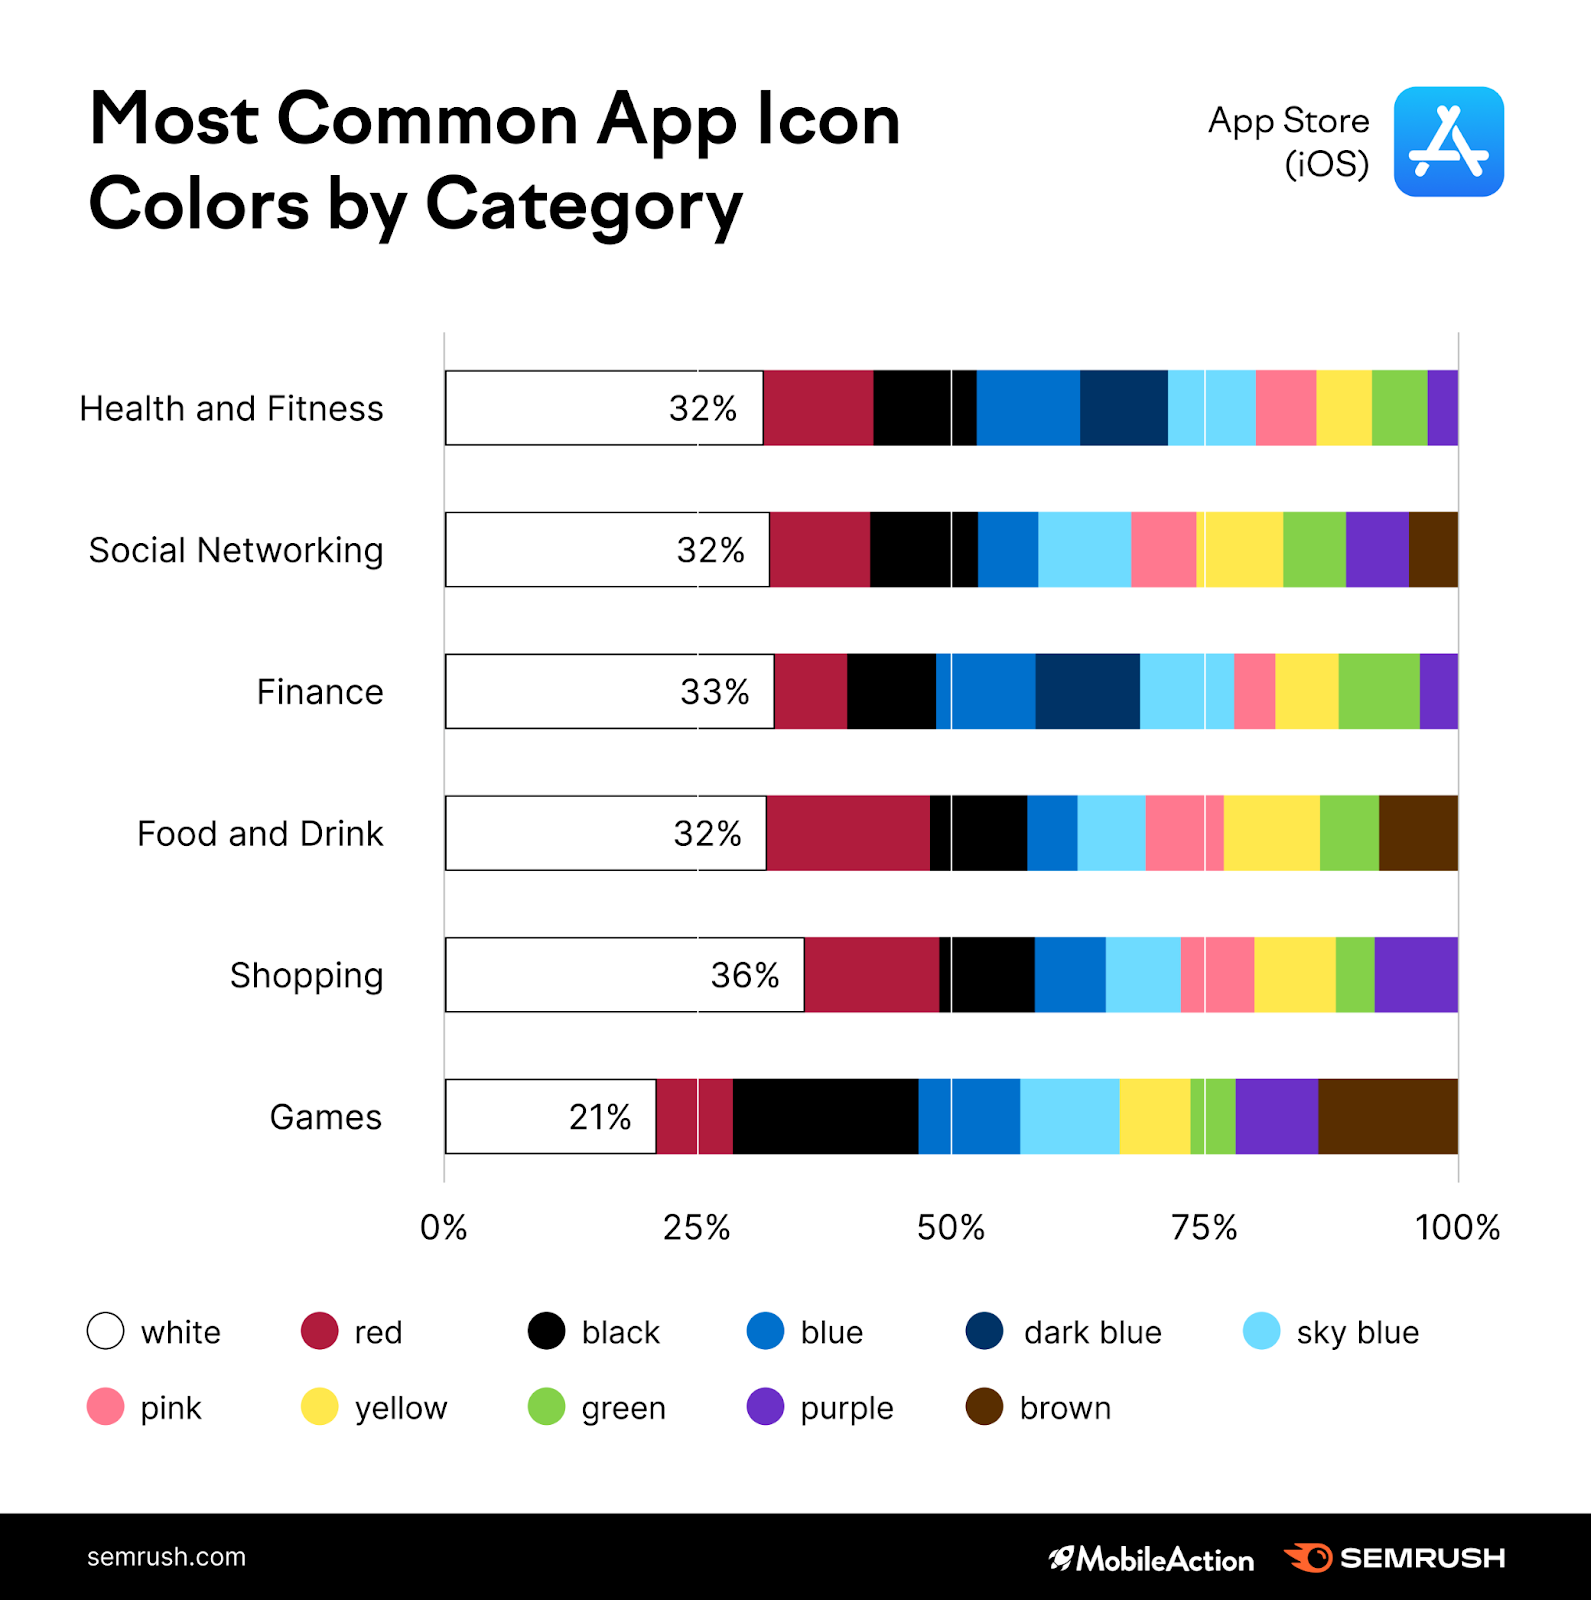
Across the board, apps’ icons typically feature around four colors, with white being the most popular color across all the categories (20%+ of apps use white as the core color); the rest of the palette varies from one niche to another.
For instance, Games apps’ second most popular color is brown. Finance apps prefer blue-ish shades. Food and Drink apps have a taste for red, using crimson colors more than any other category we analyzed.
(How) Do Technical Features Influence Apps’ Performance?
App size
We’ve looked at apps’ sizes in MB to evaluate the correlation between app size and rankings, and the findings were counterintuitive.
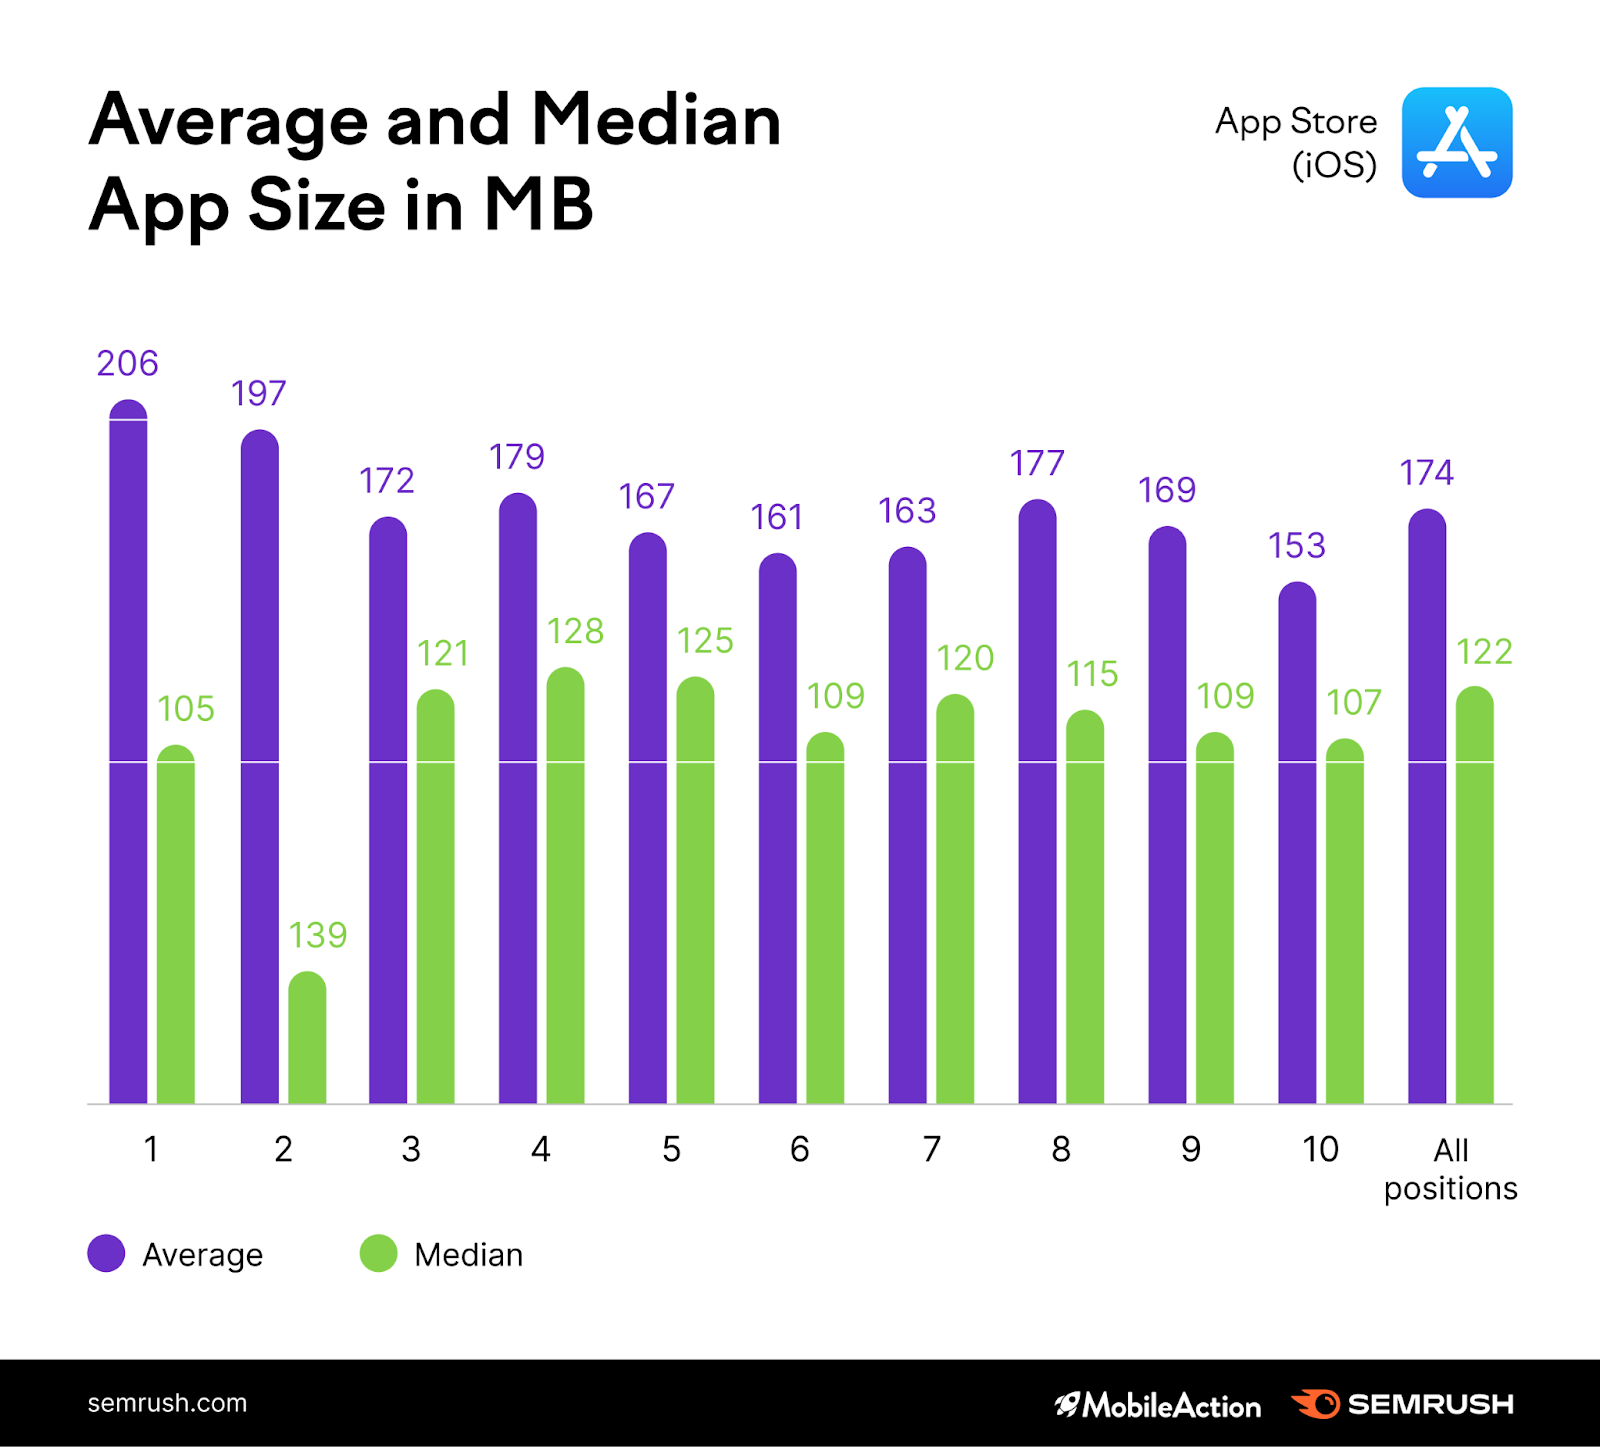
We noticed a slight decrease in the average app size with the position. It’s probably some improved functionality that gets “higher-weighing” apps higher positions in the App Store, but we can’t say for sure if it’s the graphics, more features, or something else that contributes to the increased size.
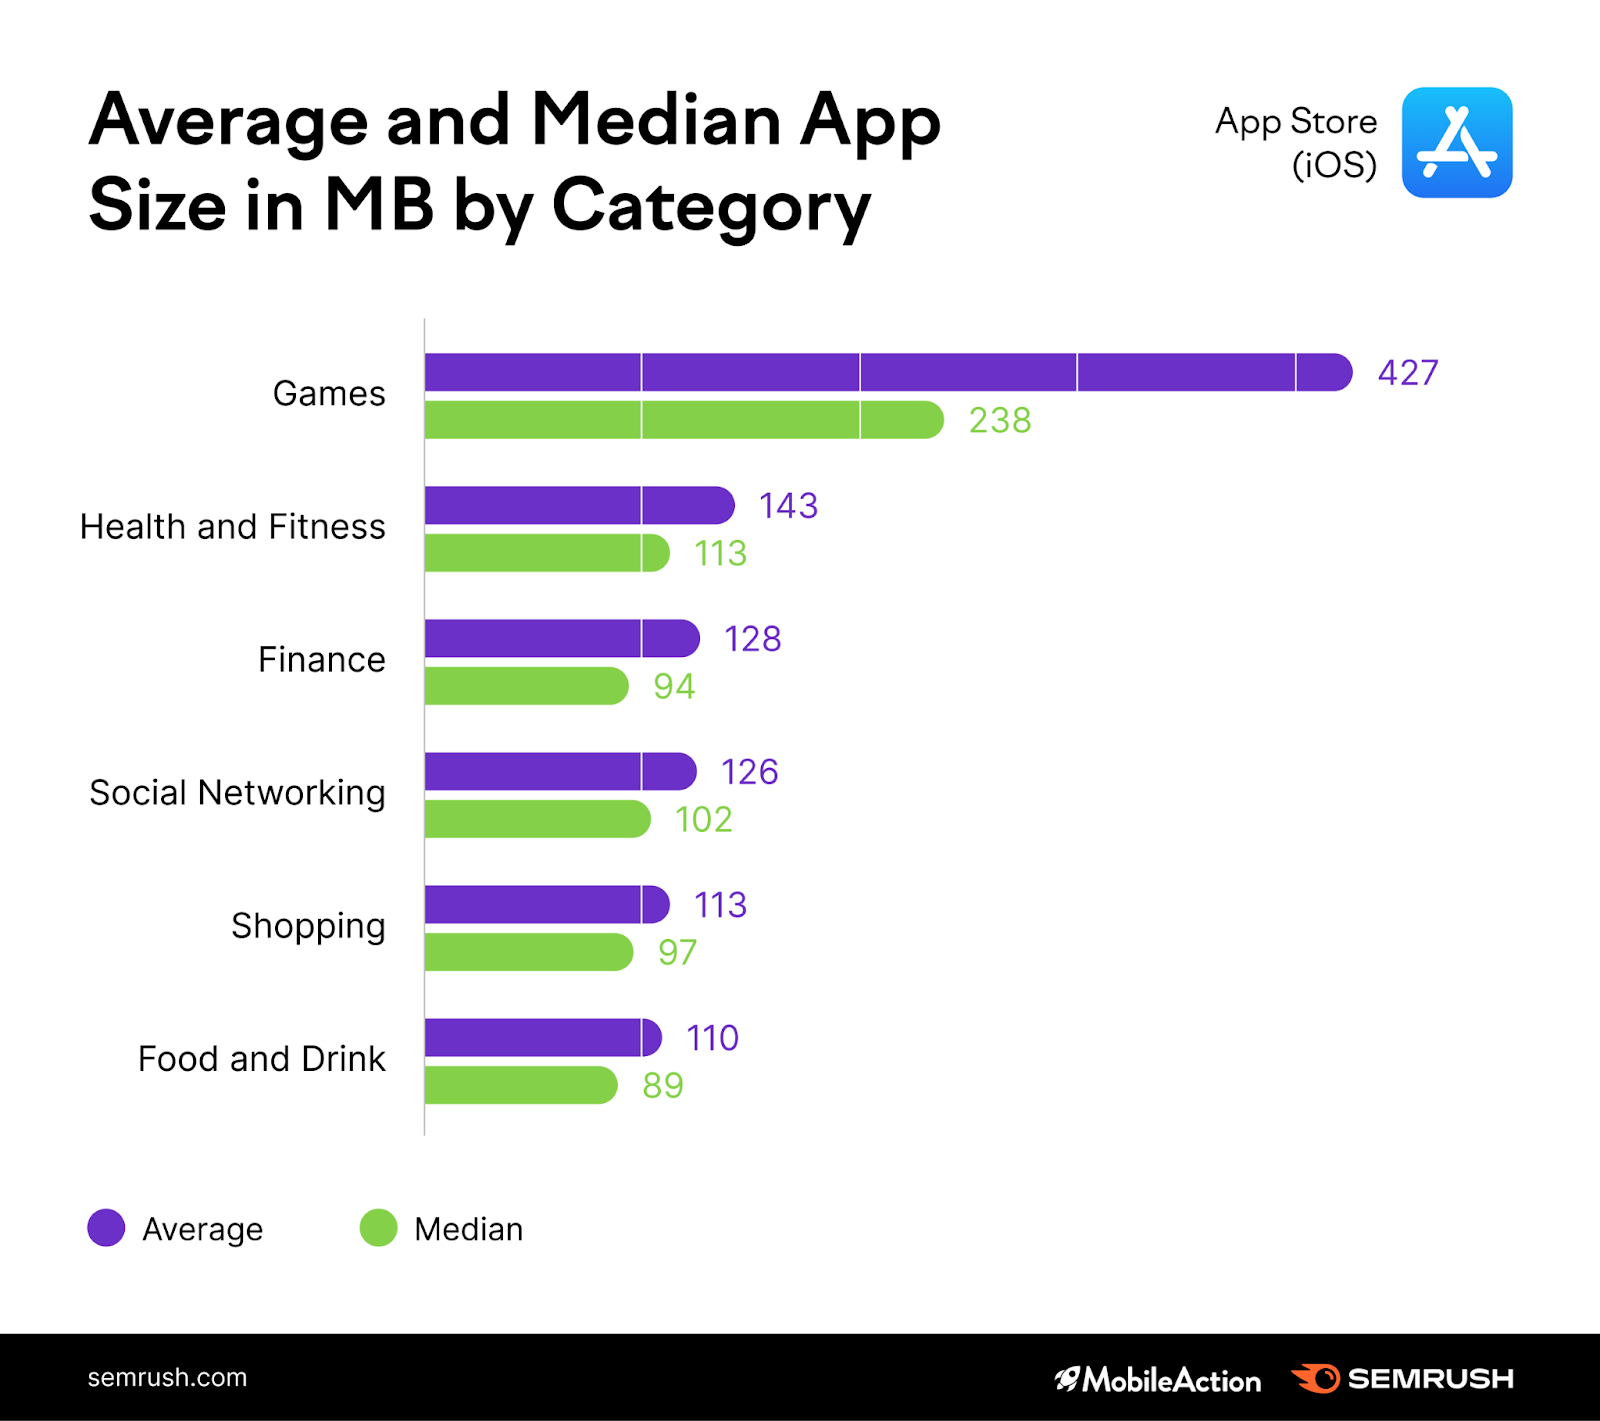
The average app in the App Store has a size of 174MB. Apps within the Games category, however, are much “heavier” than others (427MB). That's not surprising as a lot of modern games usually have more complex graphics than shops or messengers.
App updates
You’d think that being current is something the App Store takes into account when ranking apps. Our data shows that it’s true for the first two to three positions.
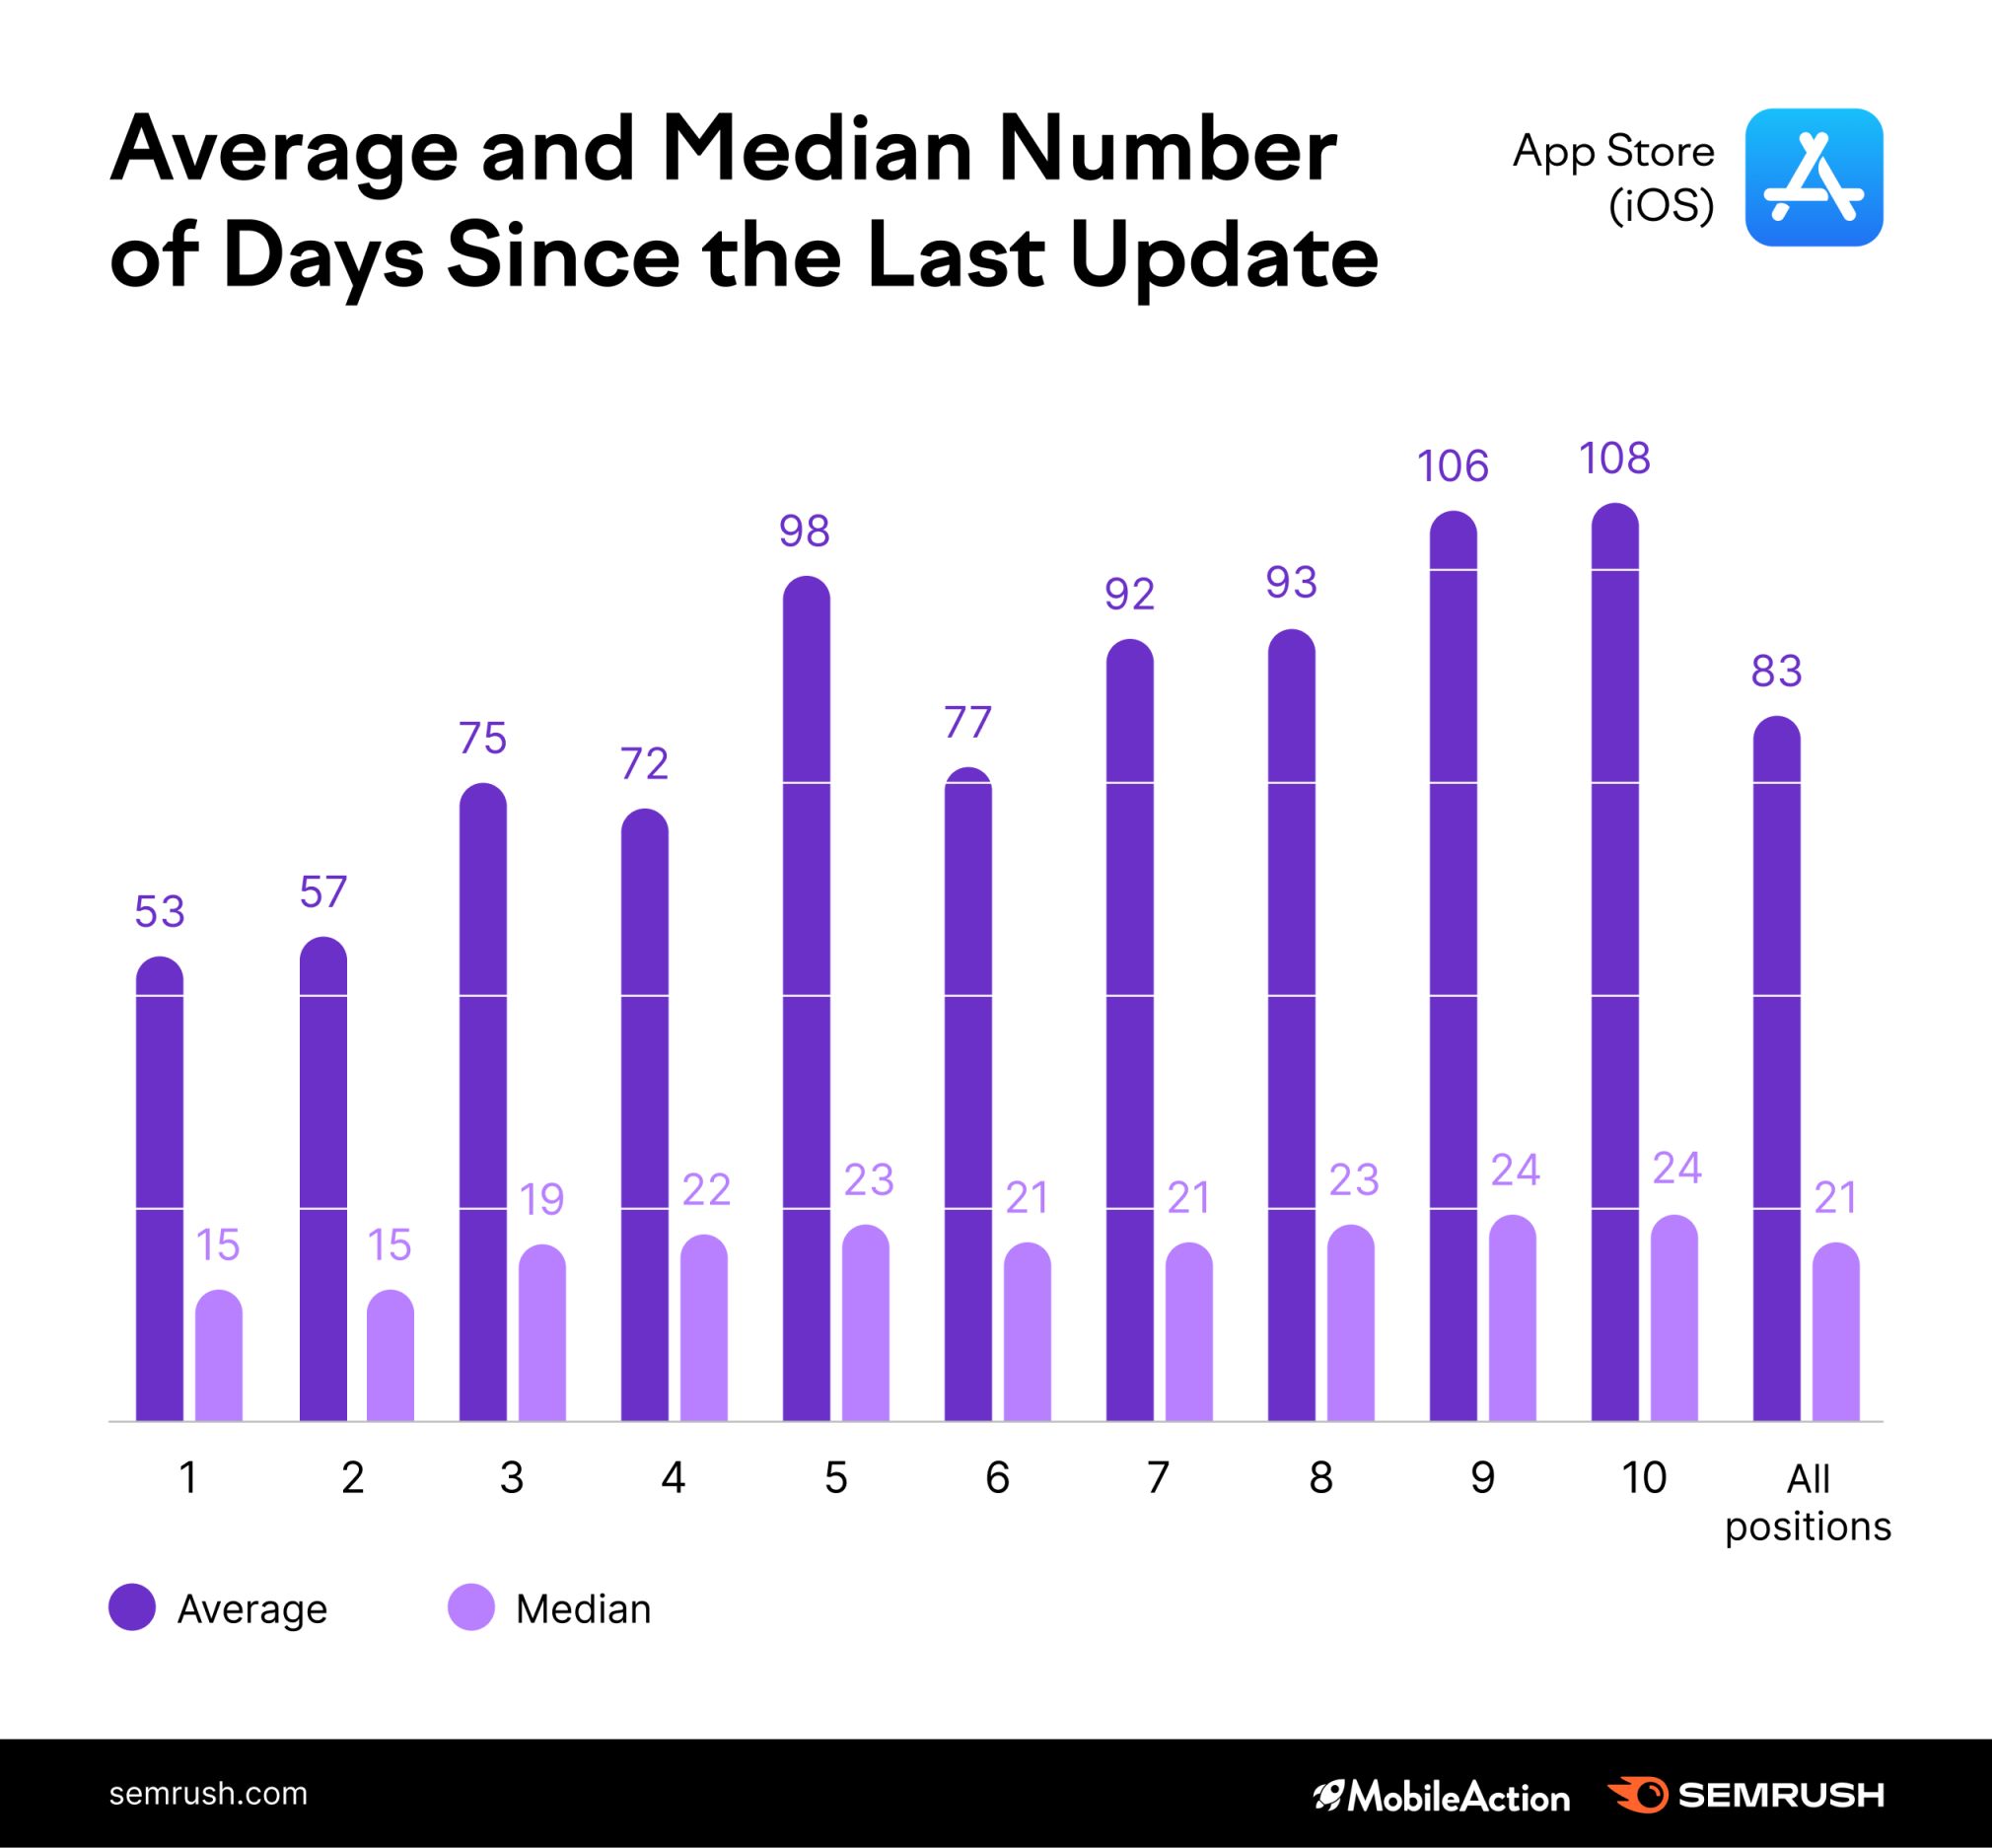
When analyzing the full scope of the apps, though, we noticed that some apps were last updated back in 2017. This implies that the app update date is not so important, as even older apps can make it into the top 10.
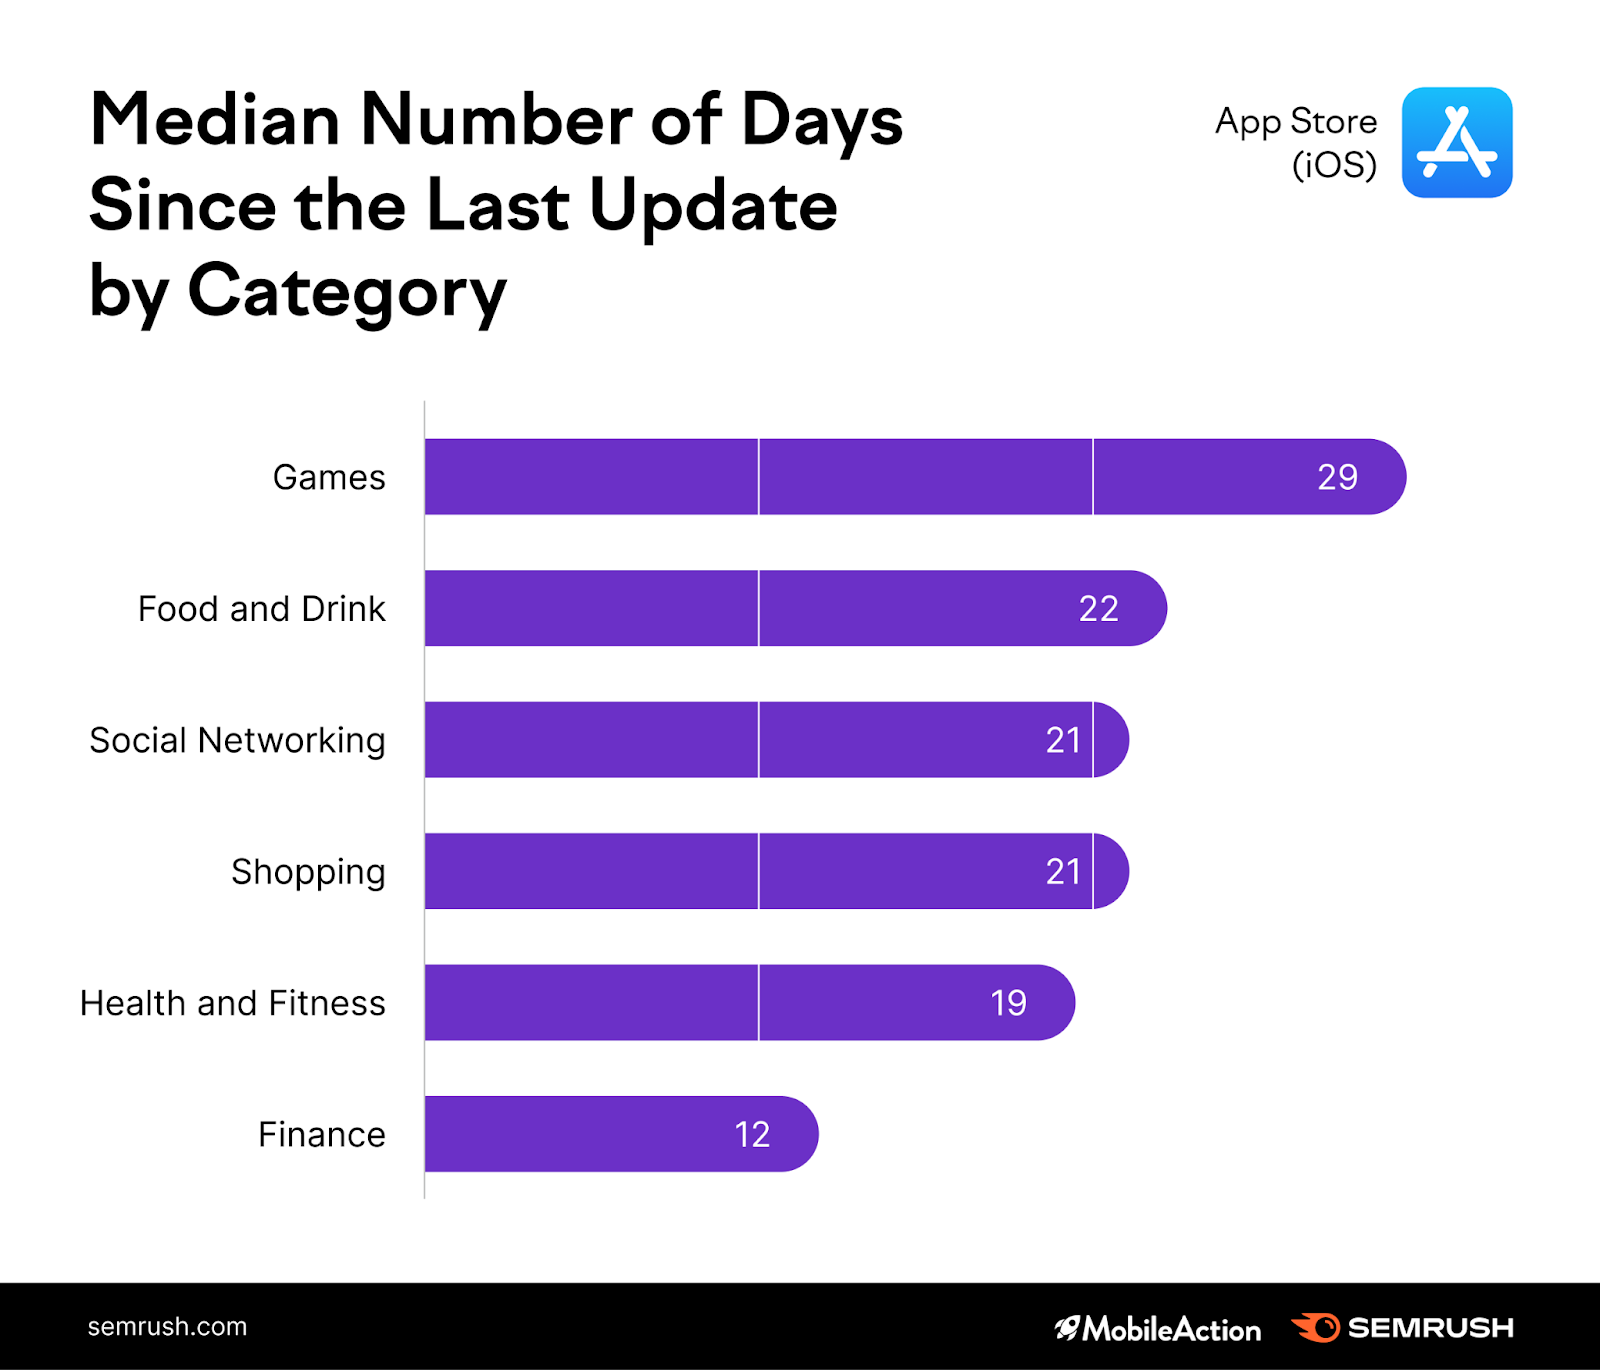
As averages might return an inaccurate view (after all, some apps haven’t seen updates in years), we looked at median values to calculate how many days had passed since the last update. It typically takes 21 days to release improvements for all the top-ranking apps across the board, with Finance apps featuring more frequent updates.
App monetization
An app can be free to download or have a price tag on it. Even if it is free to download, it can contain in-app purchases like a pro account or a paid plan that you can buy inside the app (it has a tag “in-app purchases”).
100% free apps usually don’t earn money from the apps themselves. These are the apps of e-shops or food deliveries, payment systems, or online banks — the services through which you buy some other product. These can also include apps that earn money from ads inserted into the app interface.
The chart below shows the distribution of pricing types by category.
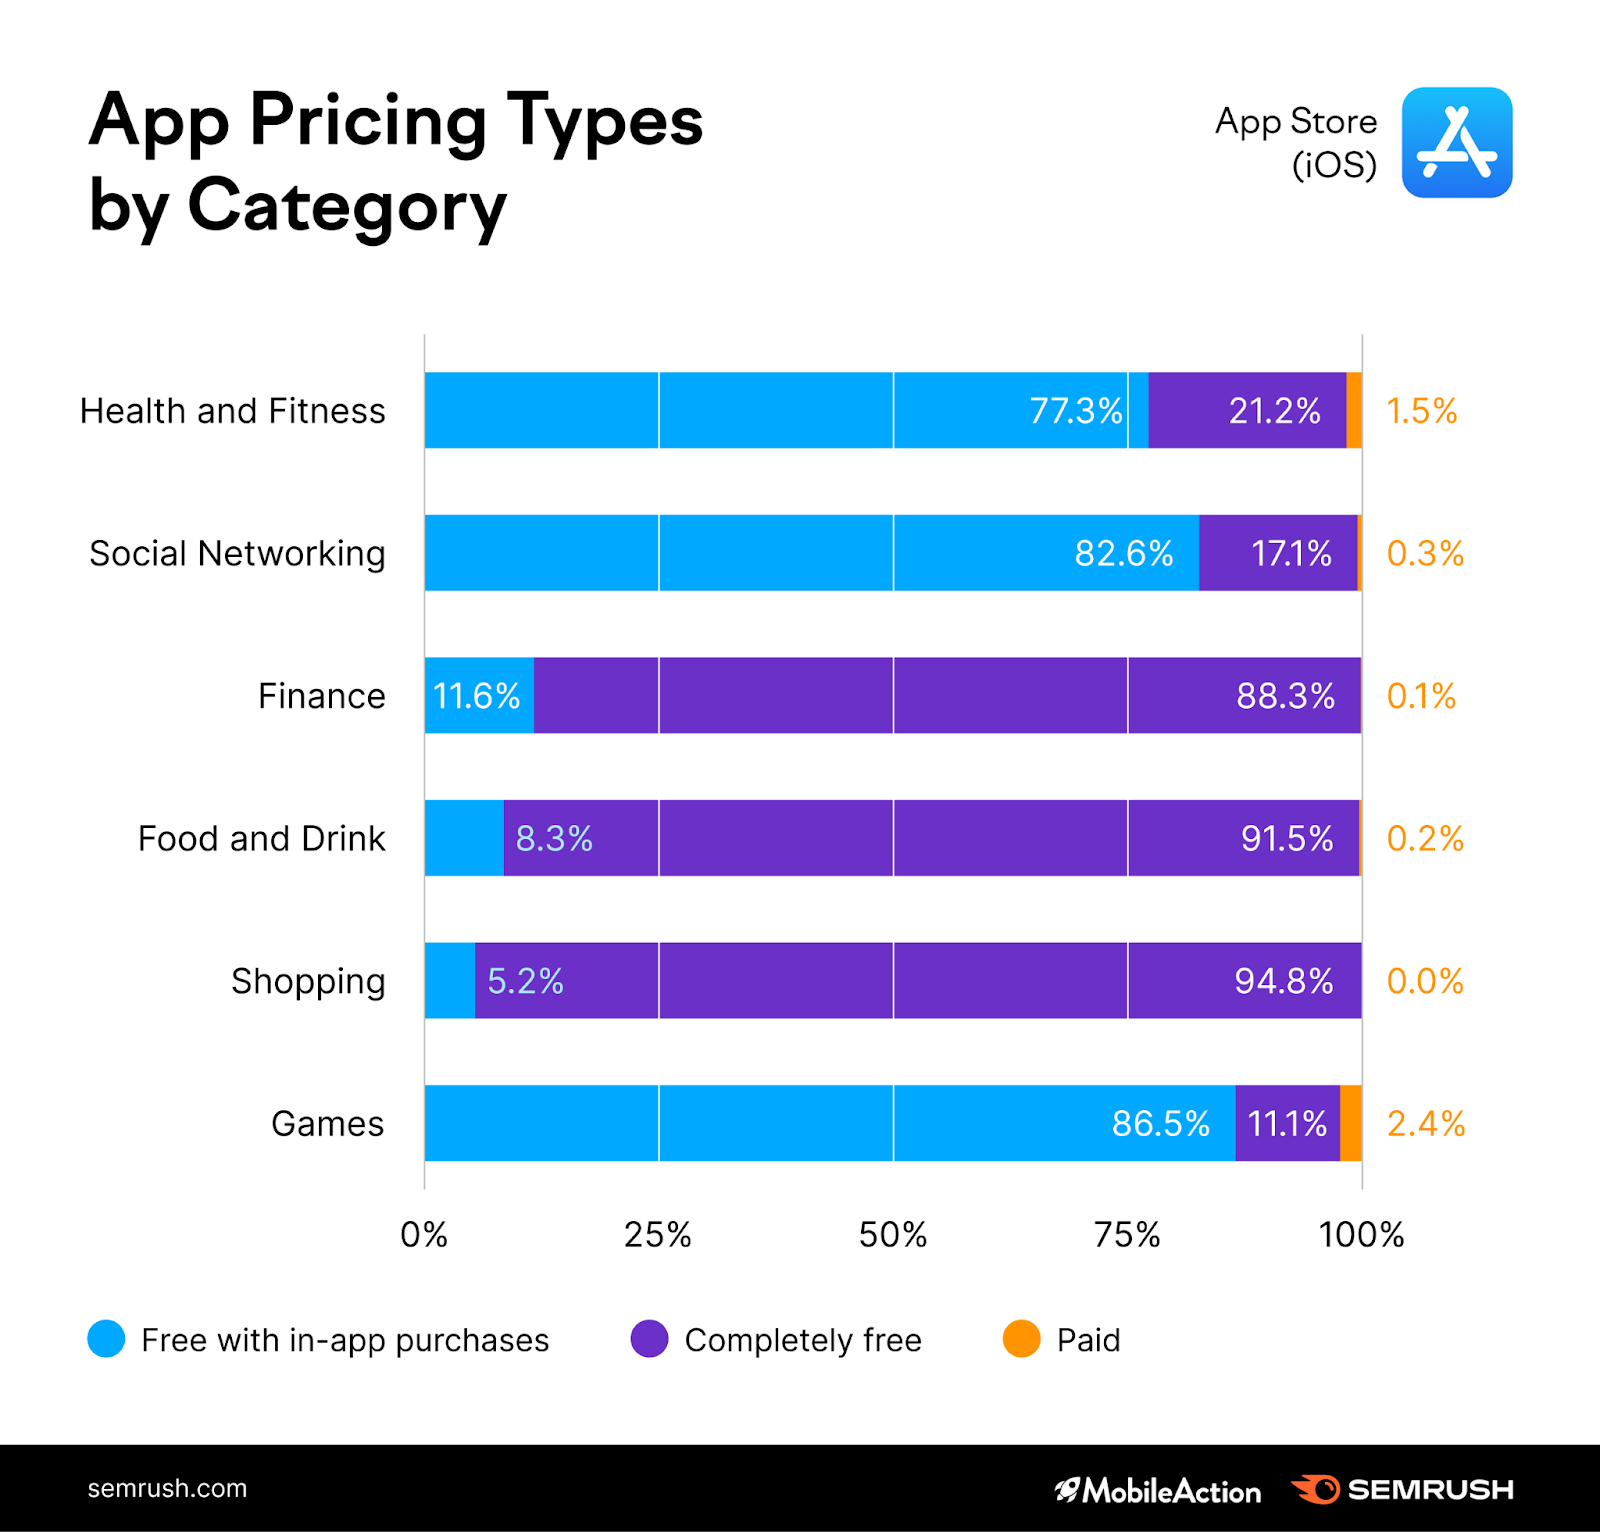
The majority of apps within the Health and Fitness, Social Networking, and Games categories are free to download but have internal purchases. Apps from the Finance, Food and Drink, and Shopping categories tend to be fully free to use. Games is the category with the highest number of apps that require any in-app payment or a paid download.
As for any influence on rankings, our data showed no correlation between app position and the pricing model.
How Diverse Is the App Developer Landscape Within the App Store?
Diversity of developers and apps
To assess how many developers are ‘responsible’ for the apps we see for each category, we looked at the search results and the number of developers presented.
Health and Fitness
Social Networking
Finance
Developer
Count
Developer
Count
Developer
Count
abishkking.com
55
pinger.com
22
coinbase.com
27
workoutinc.net
34
getwinkapp.com
14
binance.com
22
myfitnesspal.com
18
yubo.live
13
robinhood.com
18
loseit.com
13
hoop.photo
13
floatme.com
17
strongherapp.com
12
whatsapp.com
13
pro.coinbase.com
16
calm.com
12
instagram.com
13
hellobrigit.com
15
headspace.com
10
go-text.me
12
fidelity.com
14
myfitnesssync.com
10
textnow.com
12
coinmarketcap.com
14
ipnos.com
9
textPlus.com
12
trustwallet.com
13
fitness22.com
9
gotinder.com
12
crypto.com
13
Food and Drink
Shopping
Games
Developer
count
Developer
count
Developer
count
chick-fil-a.com
50
hm.com
40
ea.comiphone
13
wendys.com
43
forever21.com
28
gameloft.com
11
tacobell.com
36
nike.com
23
voodoo.io
11
order.subway.com
31
zara.com
22
sybogames.com
10
pandaexpress.com
28
shein.com
20
voodoo.io
10
popeyes.com
25
urbanoutfitters.com
20
zynga.com
10
mcdonalds.com
25
fashionnova.com
19
activision.com
9
arbys.com
19
nike.com
19
imangistudios.com
9
panerabread.com
19
mobile.tjmaxx.tjx.com
18
rovio.com
9
sonicdrivein.com
16
oldnavy.com
16
azurgames.com
7
Our findings show that the Games, Finance, and Food and Drink categories tend to have more competitors racing for the top spots. The Health and Fitness and Shopping landscape appears to have more dominant leaders, with ABISHKKING owning over 30% of all the apps in the former category and H&M owning more than 18% of the apps in the latter.
Search trends
We looked at the top 10 keywords for each category, and saw that the most popular keywords are those that have to do with brands.
Health and Fitness
Social Networking
Finance
Keyword
Rank
Keyword
Rank
Keyword
Rank
planet fitness
1
1
coinbase
1
my fitness pal
2
grindr
2
cash app
2
fitness
3
yubo
3
bank of america
3
sleep: sounds
4
wizz
4
robinhood
4
period tracker
5
messenger
5
credit karma
5
fitbit
6
6
venmo
6
workout
7
text now
7
crypto com
7
white noise
8
jackd
8
zelle
8
peloton
9
wink
9
payday advance
9
fasting tracker
10
yik yak
10
western union
10
Food and Drink
Shopping
Games
Keyword
Rank
Keyword
Rank
Keyword
Rank
mcdonalds app
1
shein
1
games
1
starbucks
2
target
2
pubg
2
chick fil a app
3
fashion nova
3
rocket league
3
burger king
4
ebay
4
candy crush
4
taco bell
5
bath and body works
5
candy crush
5
pizza hut
6
zara
6
car games
6
food delivery
7
shop
7
subway surfers
7
dunkin donuts app
8
offer up
8
solitaire
8
wendys app
9
best buy
9
free games
9
gopuff
10
kohls app
10
geometry dash
10
The data above implies that people search for specific app brands more often than they search for a specific feature or action. This only means that an investment in brand awareness can go a long way when promoting your app.
Dissecting ASO For the Play Store (Android)
(How) Do User-Driven Factors Affect Apps’ Rankings?
Rating
Just like the App Store, the Play Store doesn’t appear to place too much emphasis on ratings when ranking apps. But rating averages tend to be higher.
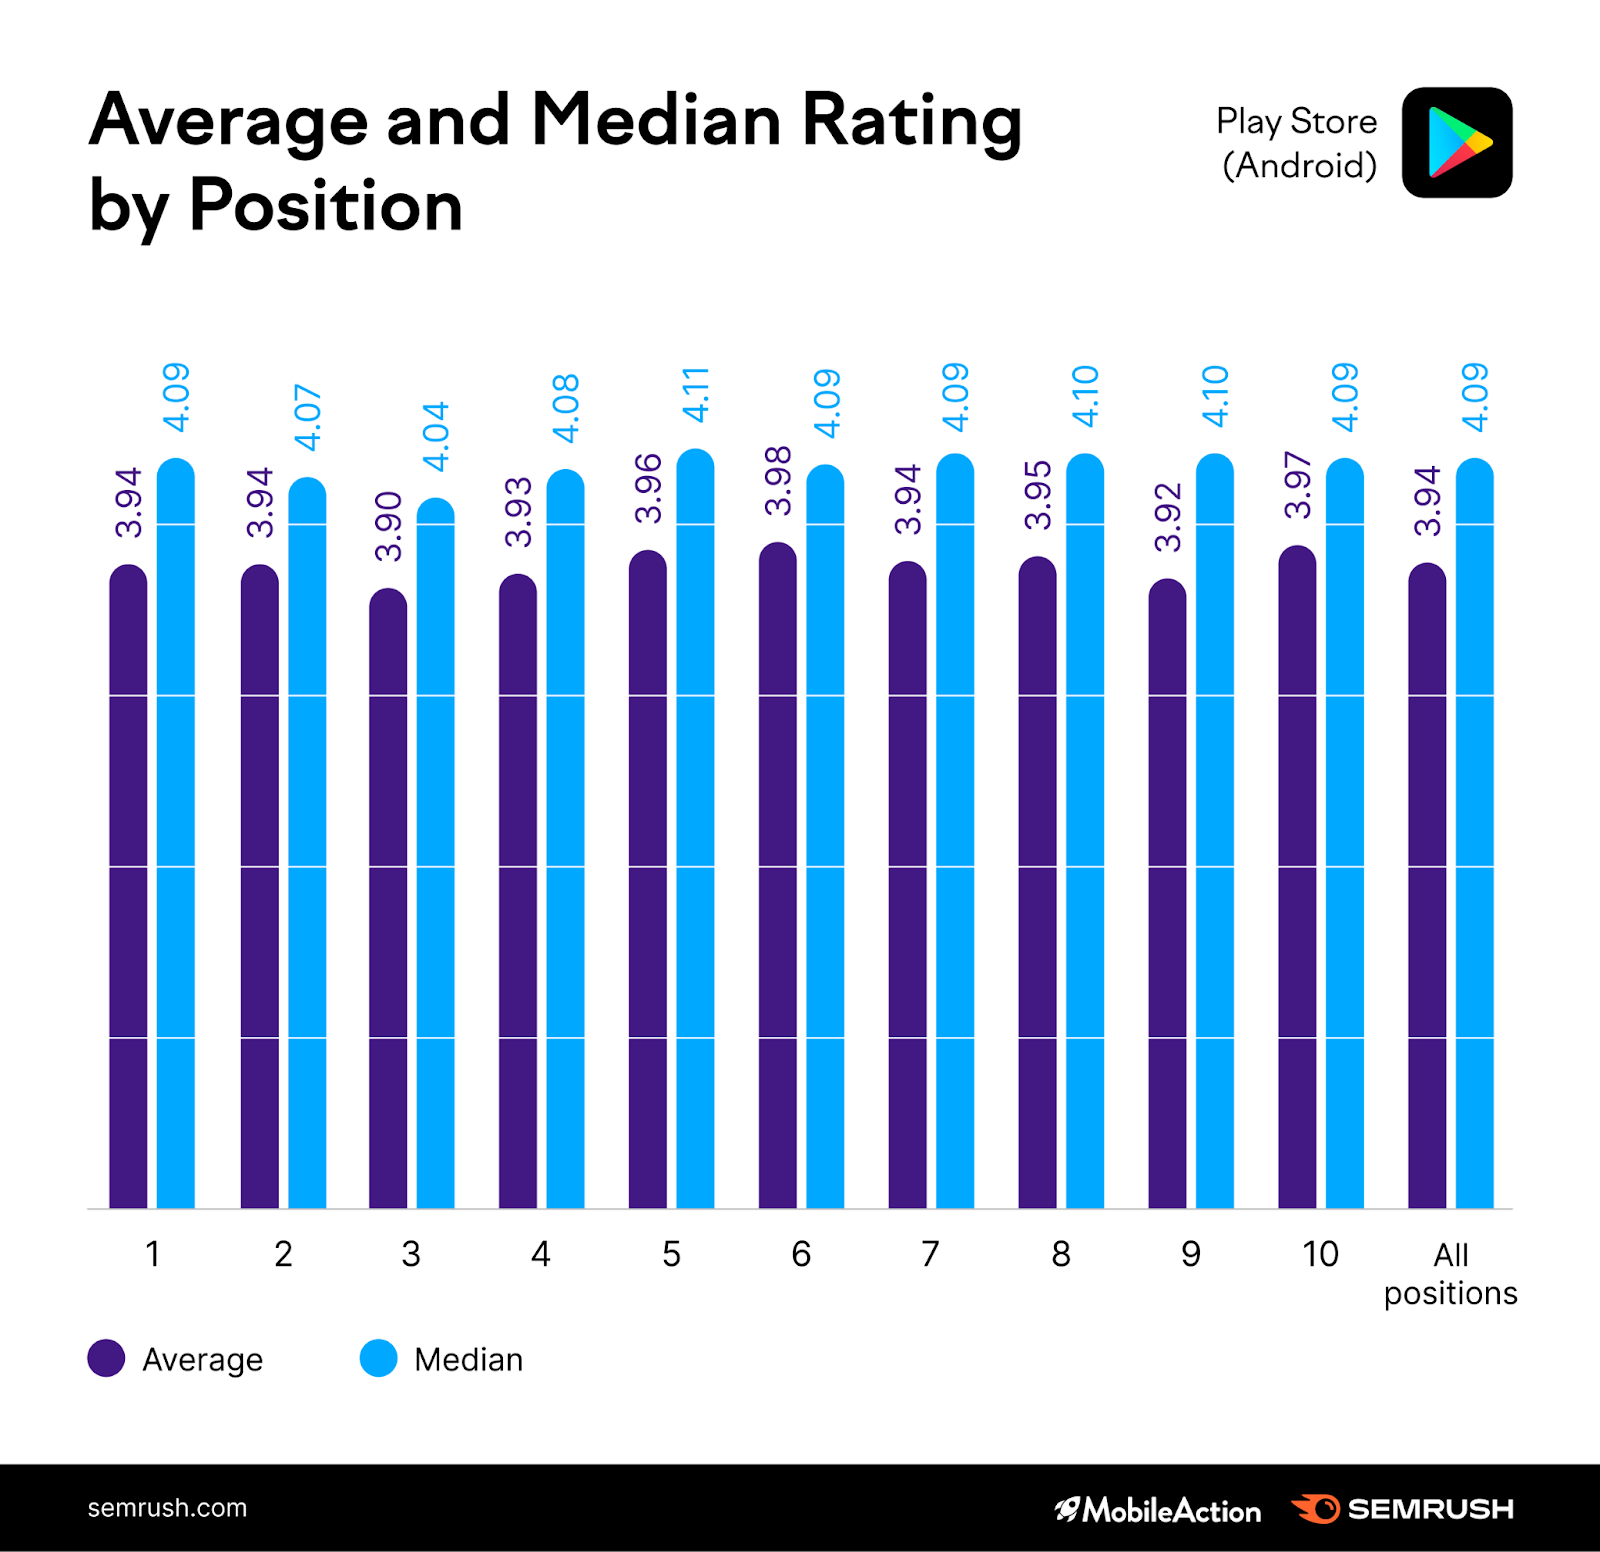
The average app in positions 1 to 5 has a 4-star rating in the Play Store (vs. the App Store’s 3.3 stars).
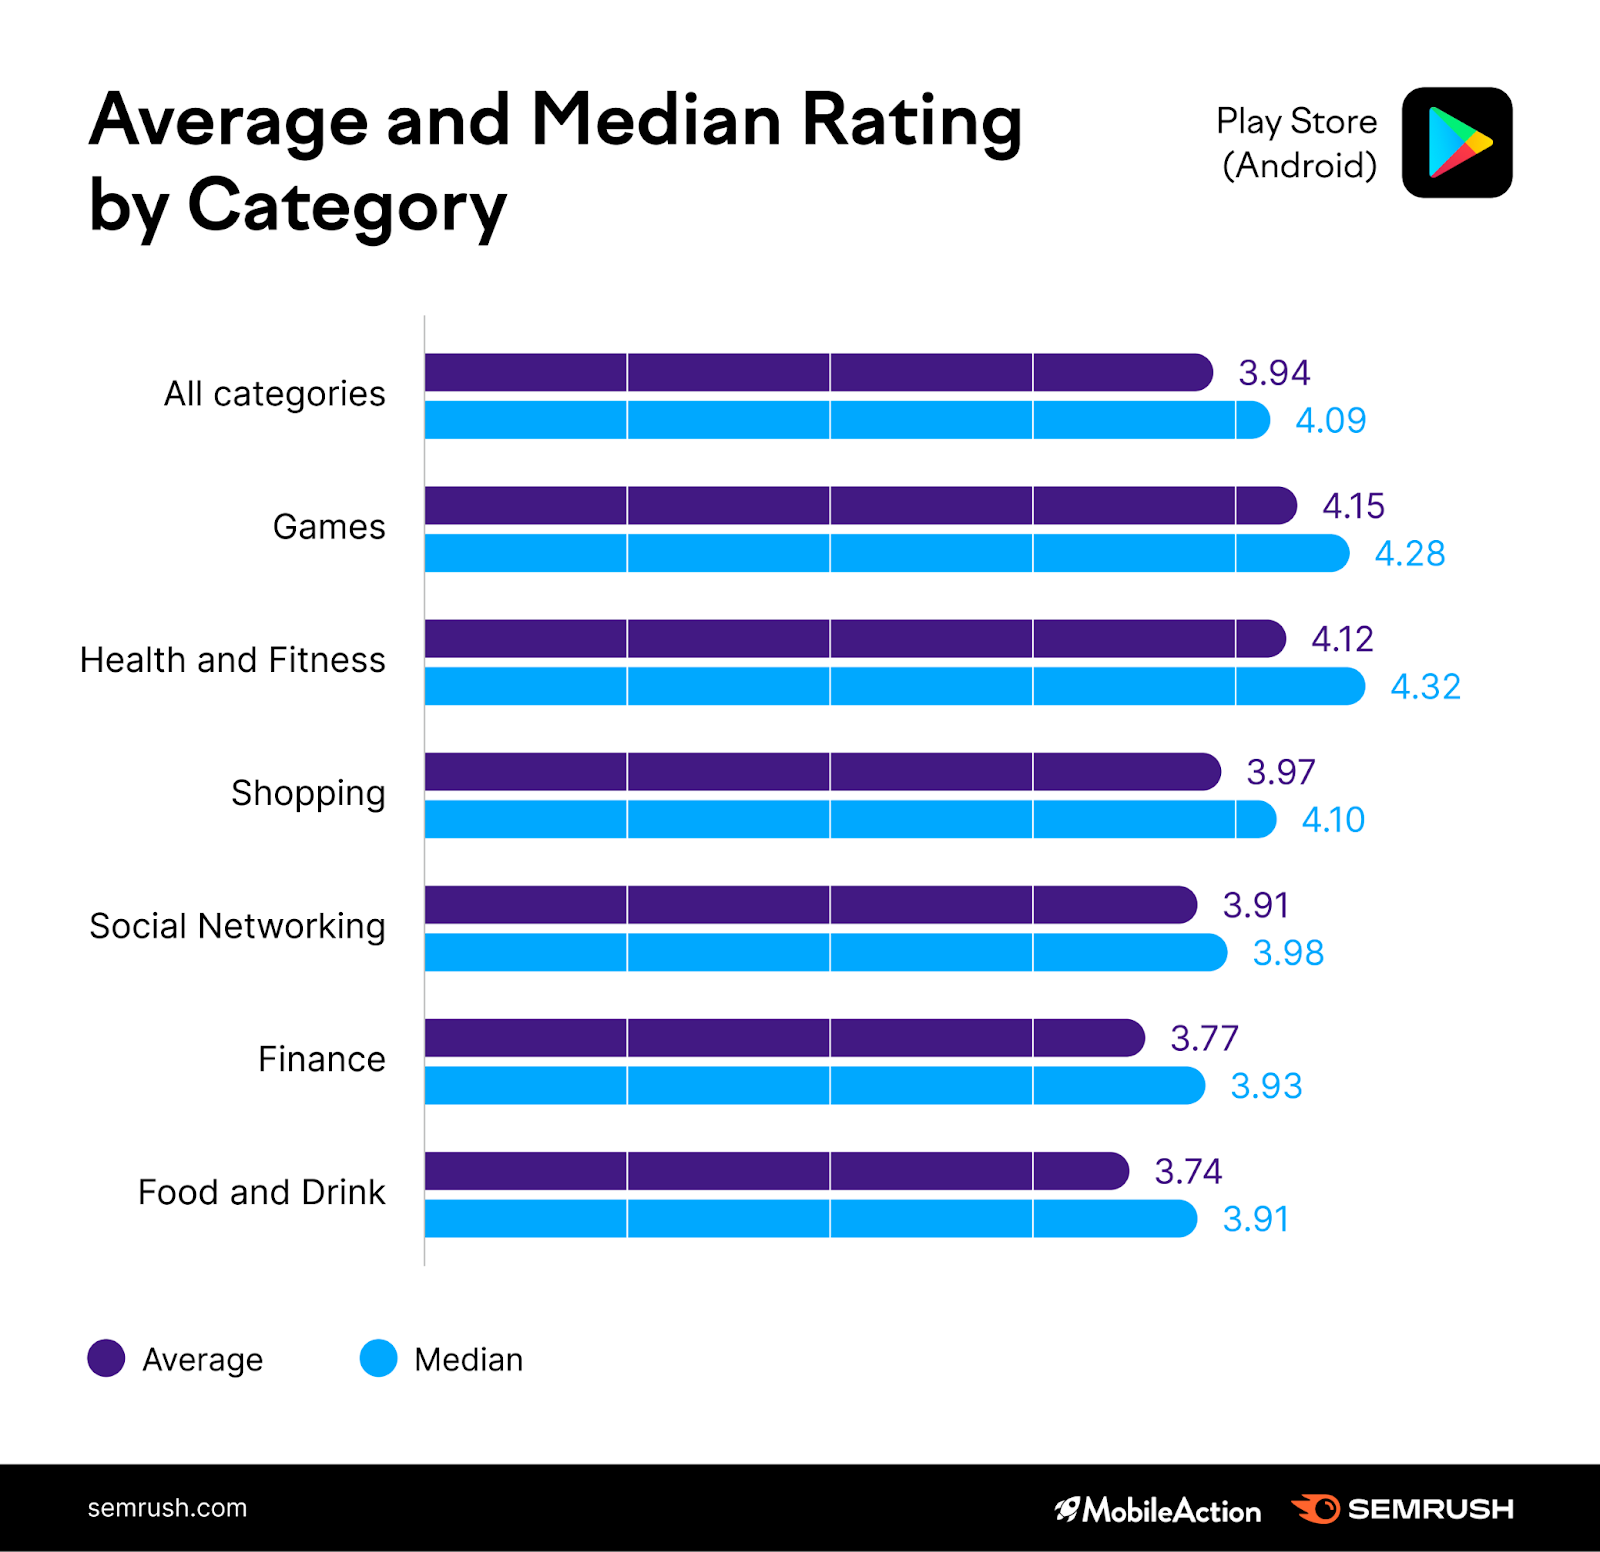
In the Play Store, the highest ratings go to gaming apps.
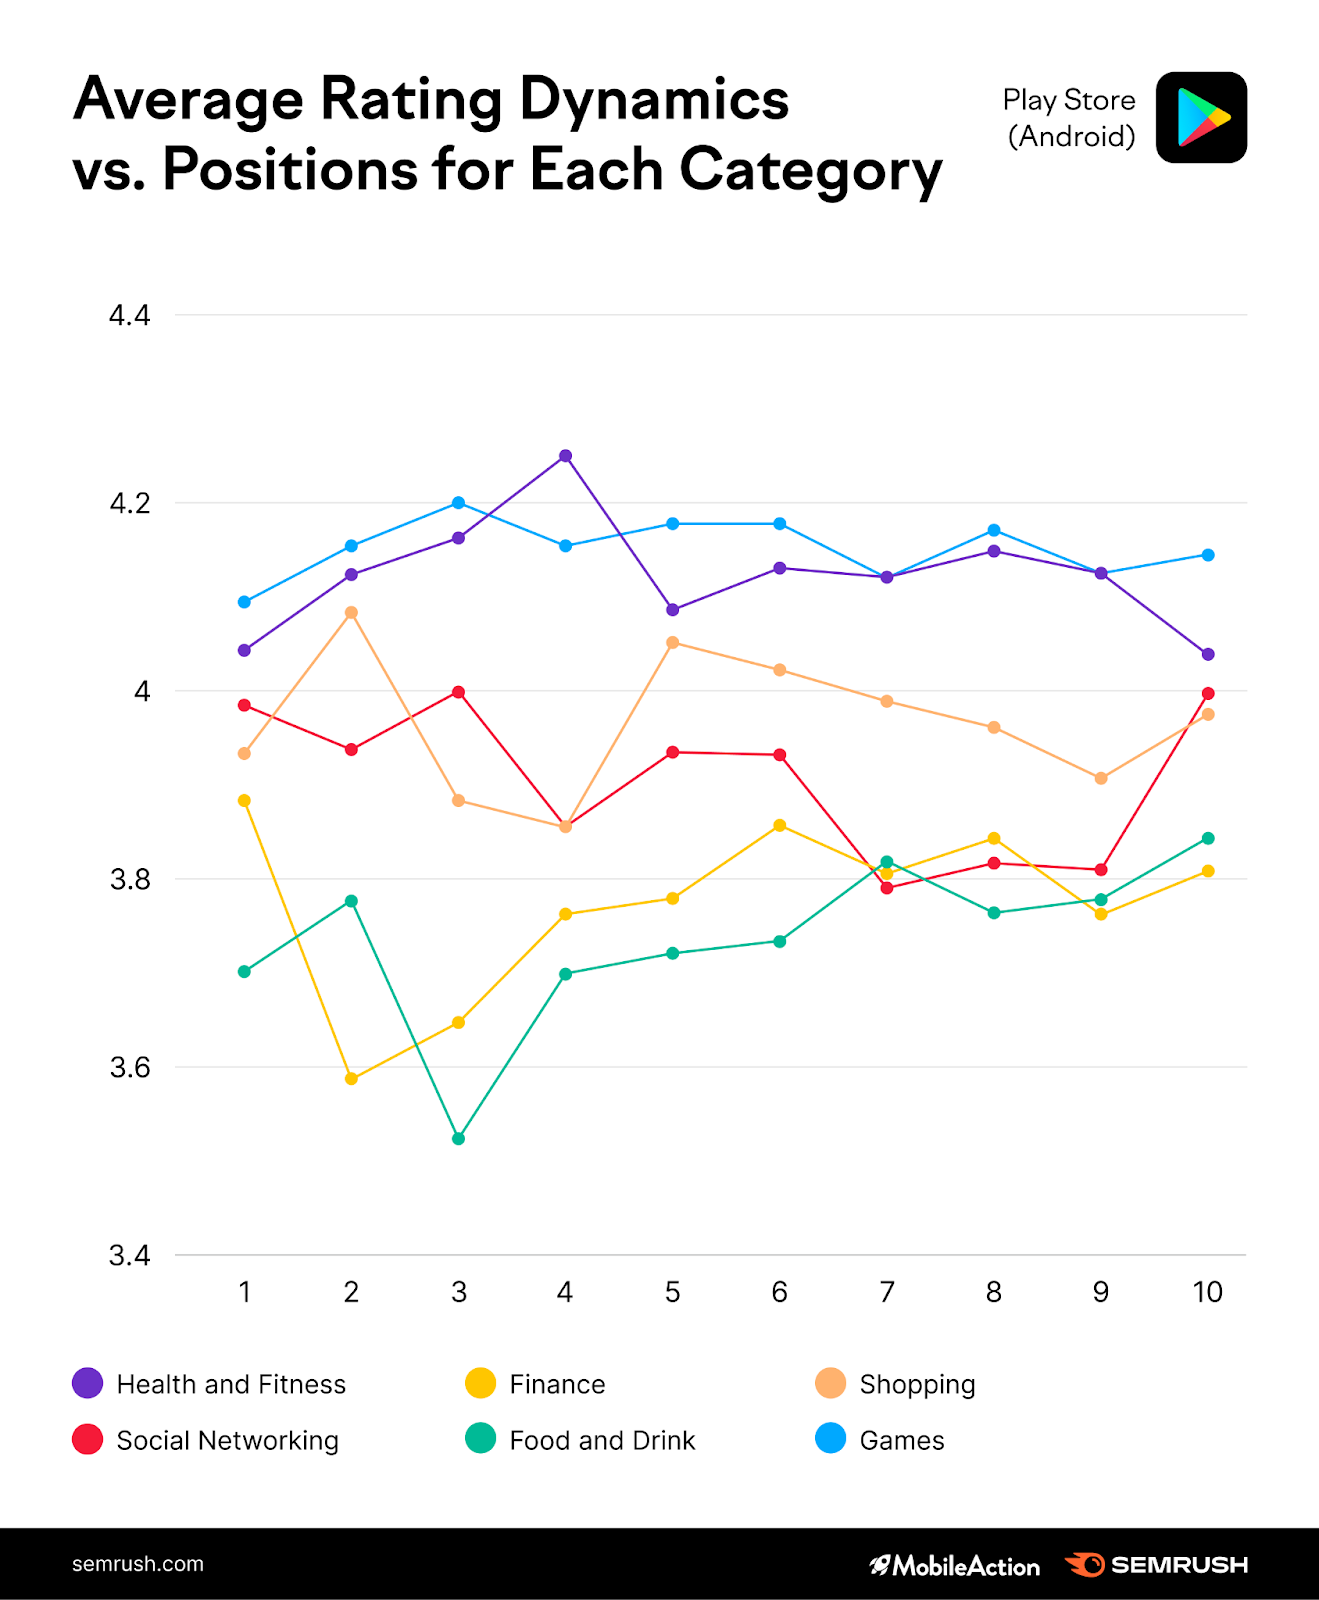
As for ratings’ influence on apps’ organic performance in the Play Store, it looks like rankings don’t go down with falling ratings.
Reviews
When it comes to reviews, the ranking patterns are once again similar to those of the App Store. Reviews do seem to affect rankings, and to a large extent when we’re looking at the top position.
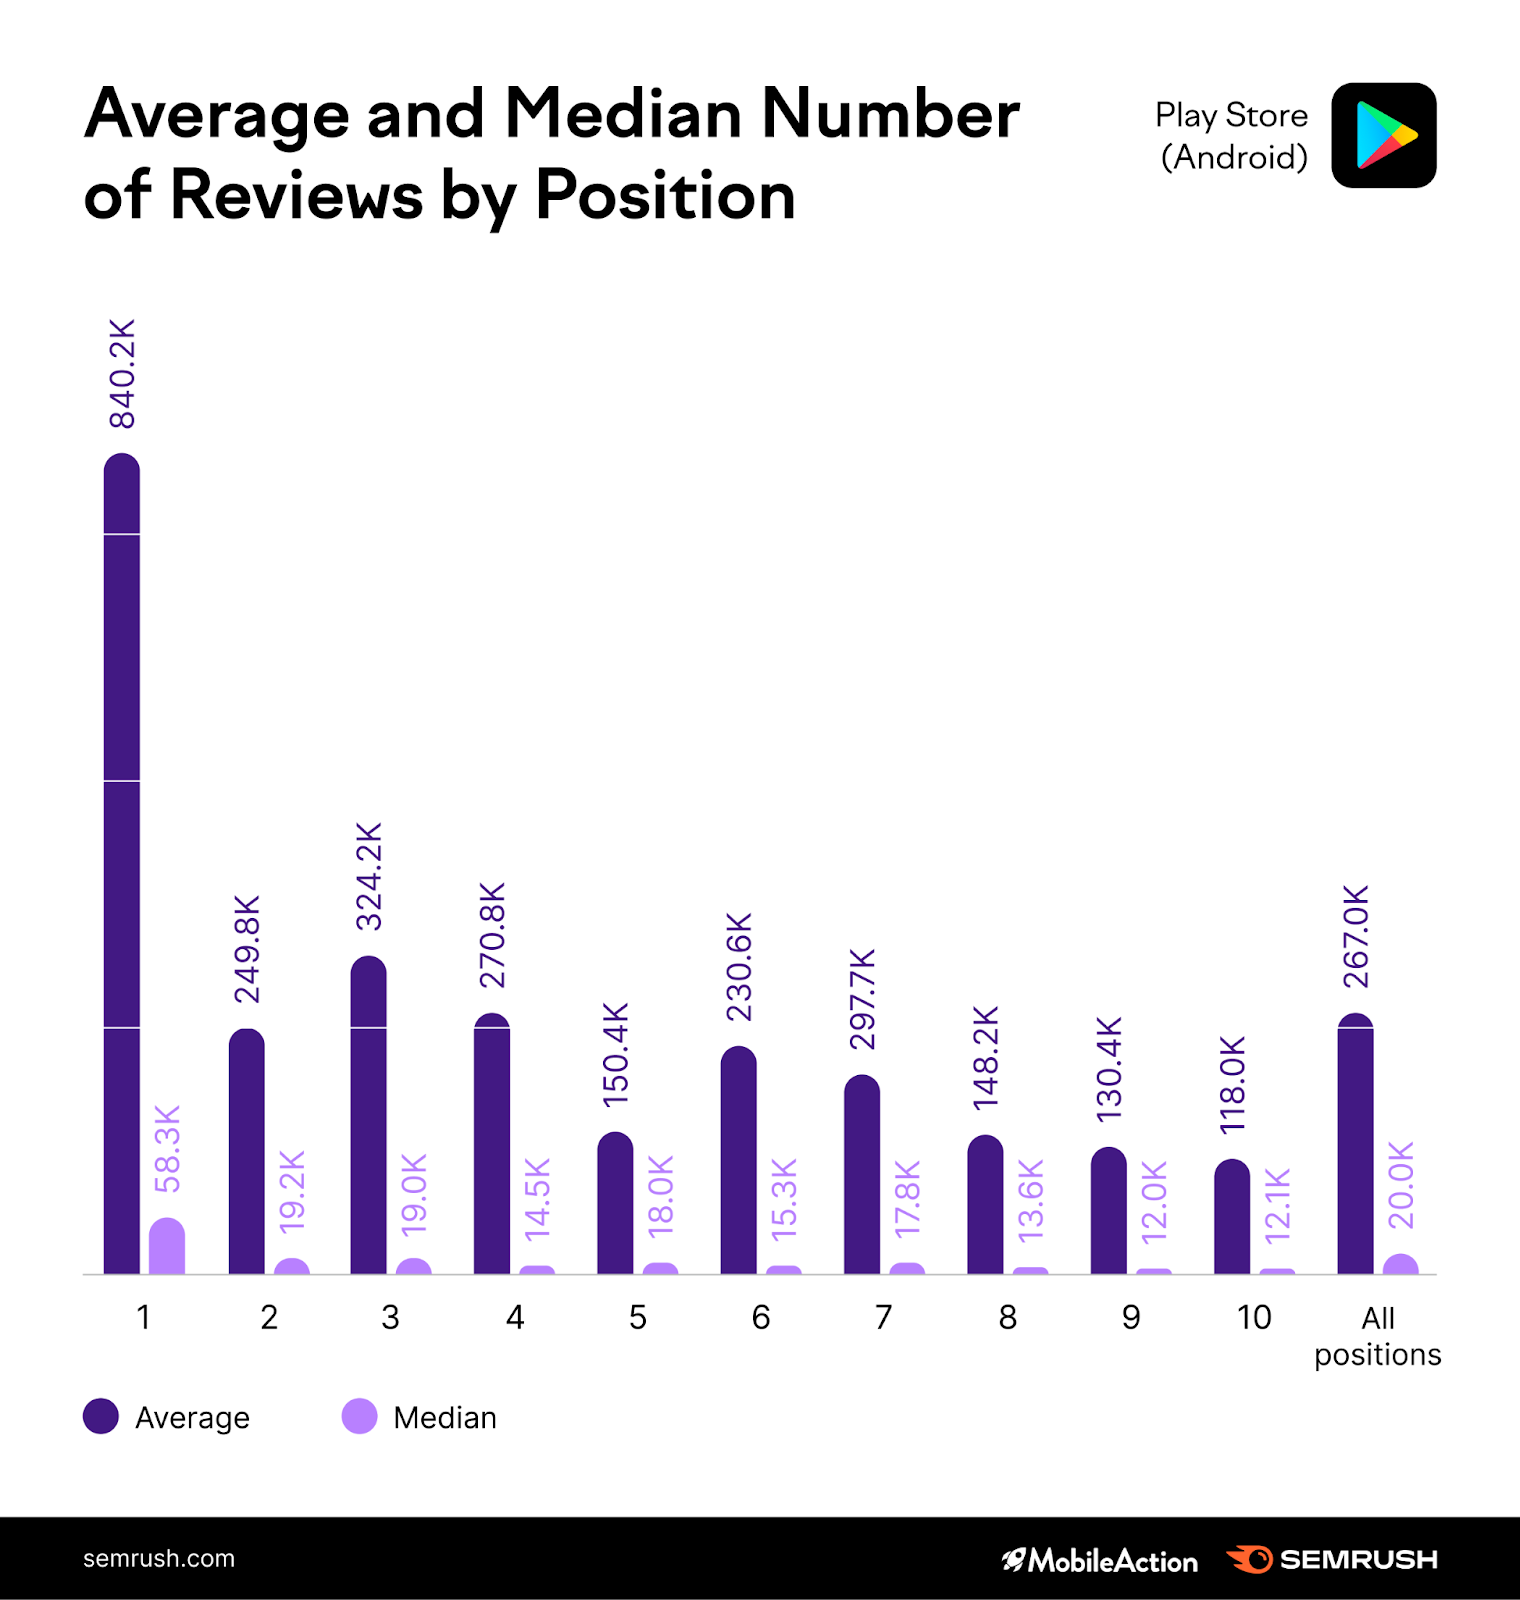
Looking at median values (as some apps have an incredibly high volume of reviews), we can see that apps making it to the first position tend to have almost triple the number of reviews compared to the next-ranking apps.
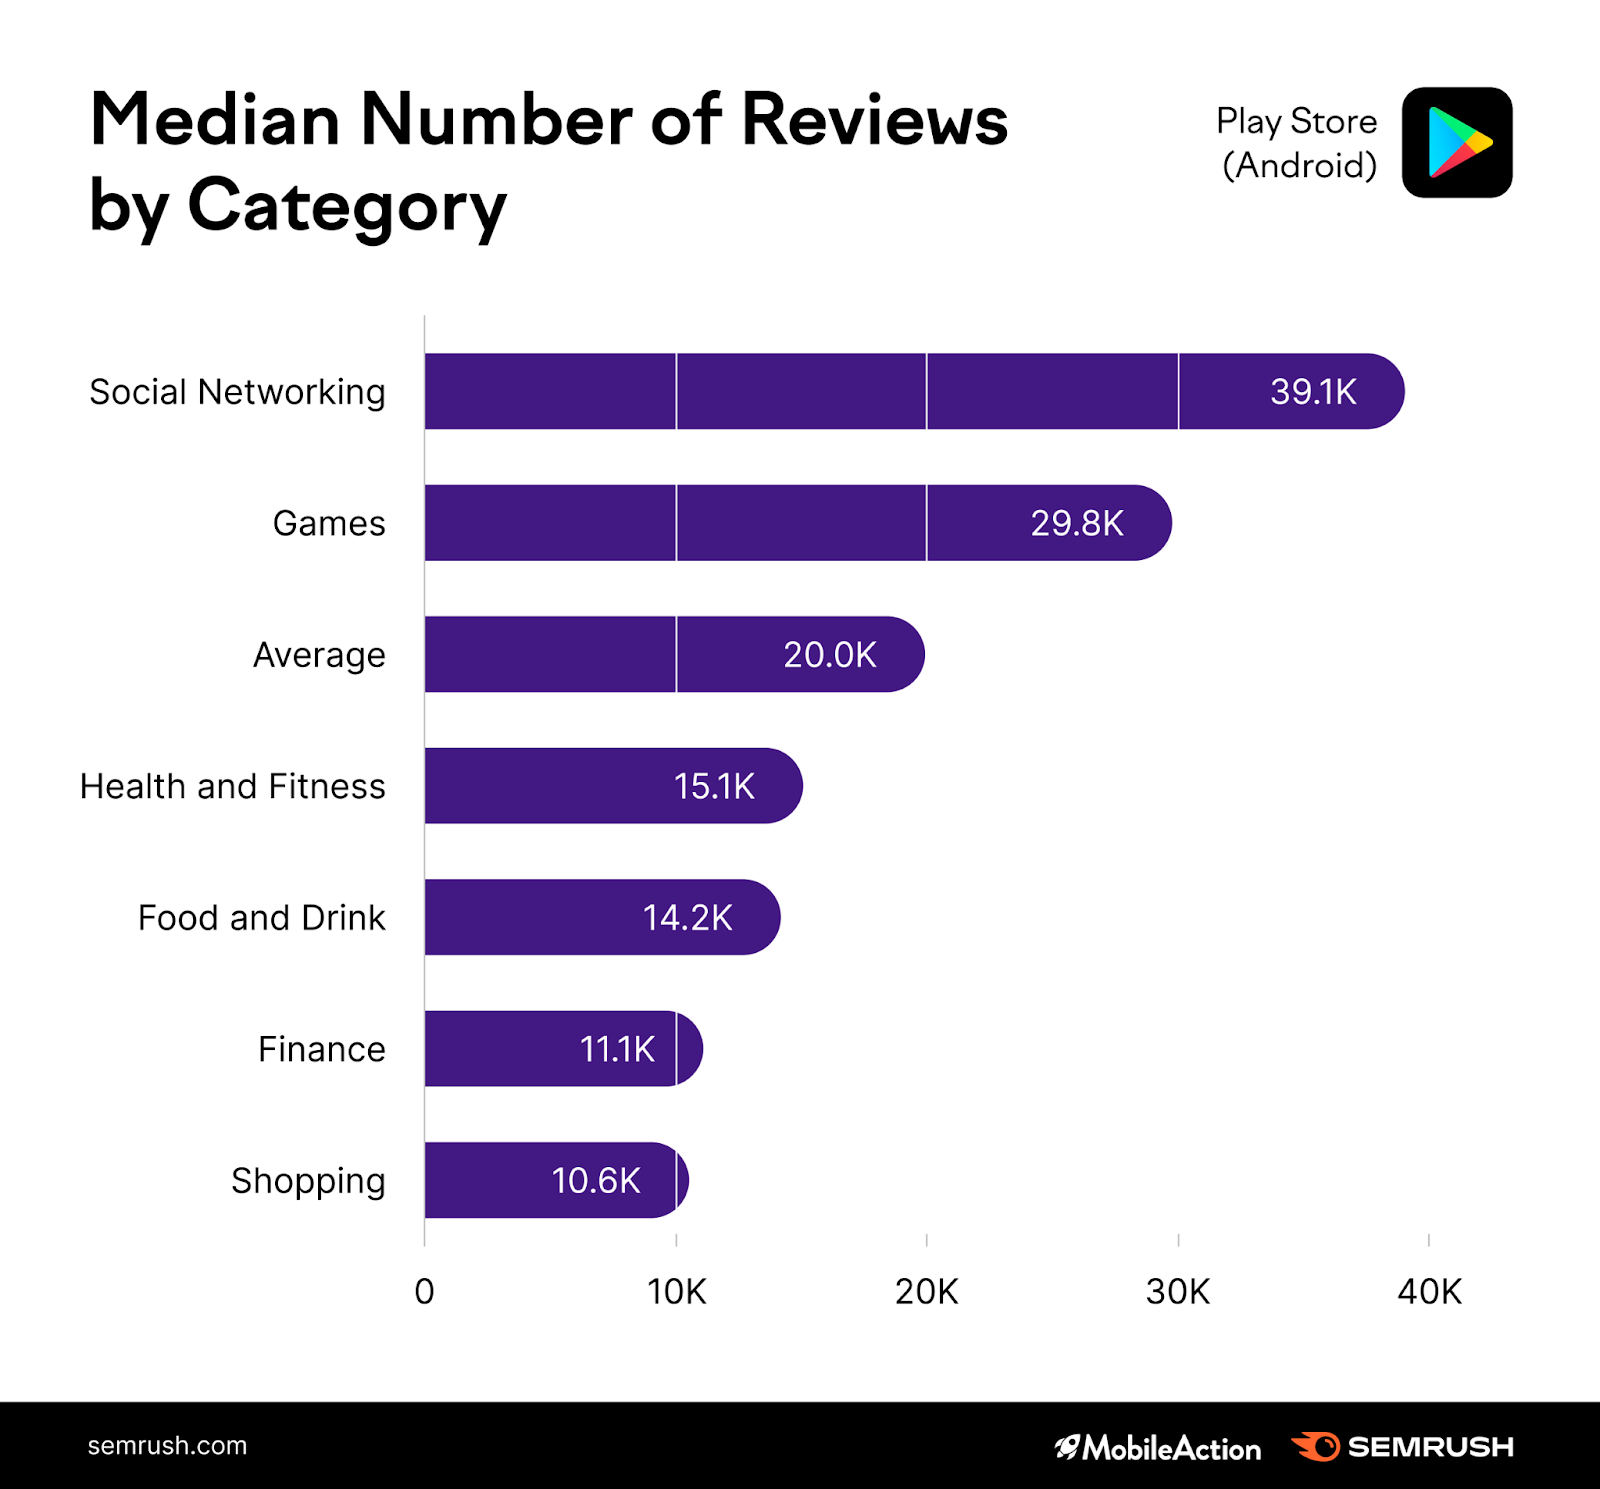
Unlike the App Store, where gaming apps attract the largest number of reviews, Play Store users mostly leave feedback for Social Networking apps. The average review count for this category is 39K.
When looking at the impact of reviews on rankings, we only see a significant decrease in position vs. reviews within the Social Networking and Games categories, especially in the top 2 positions. For other categories, the drop is less notable.
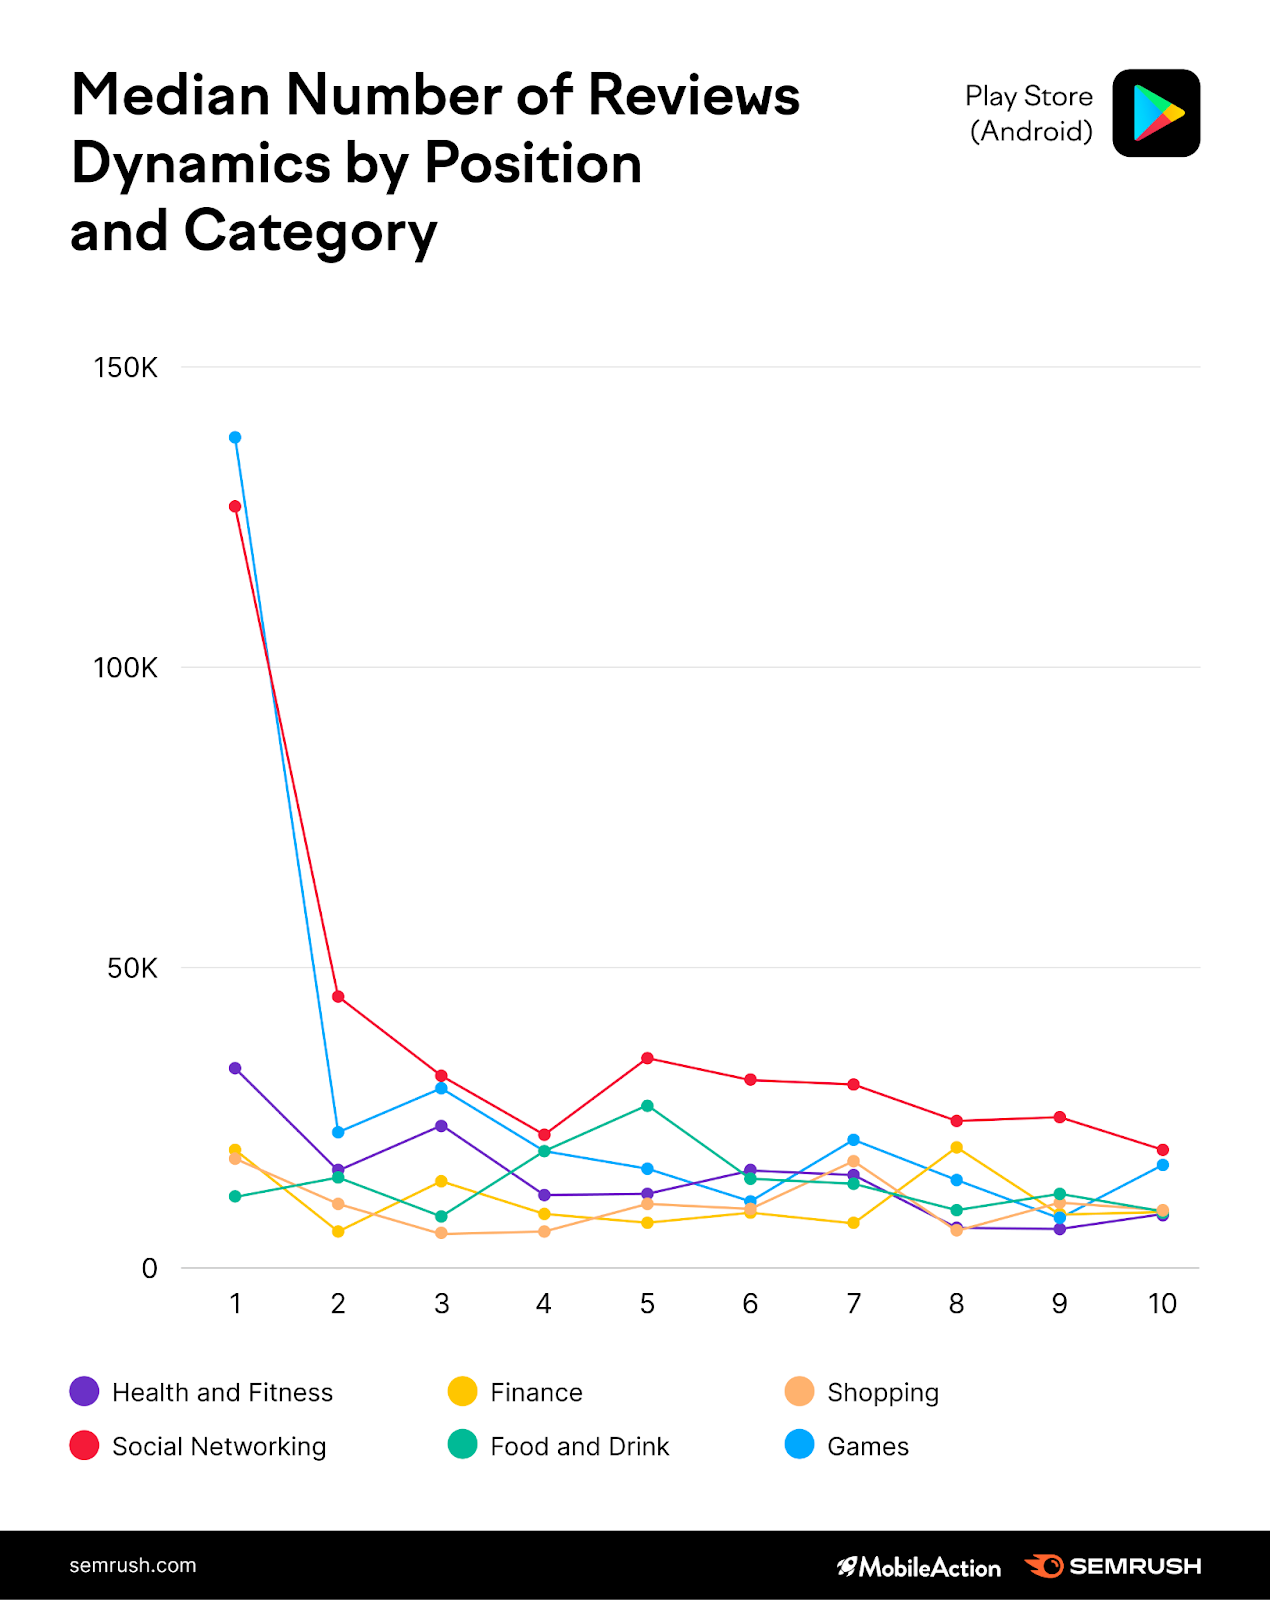
In general, Android users appear to leave more reviews across all categories compared to iOS stats. The average app in the Play Store gets about 267K reviews, while in the App Store, it’s 31.7K.
(How) Does the Way You Present Your App Impact Position?
App name
The average top-ranking app in the Play Store has around 28 characters and four words in its name.
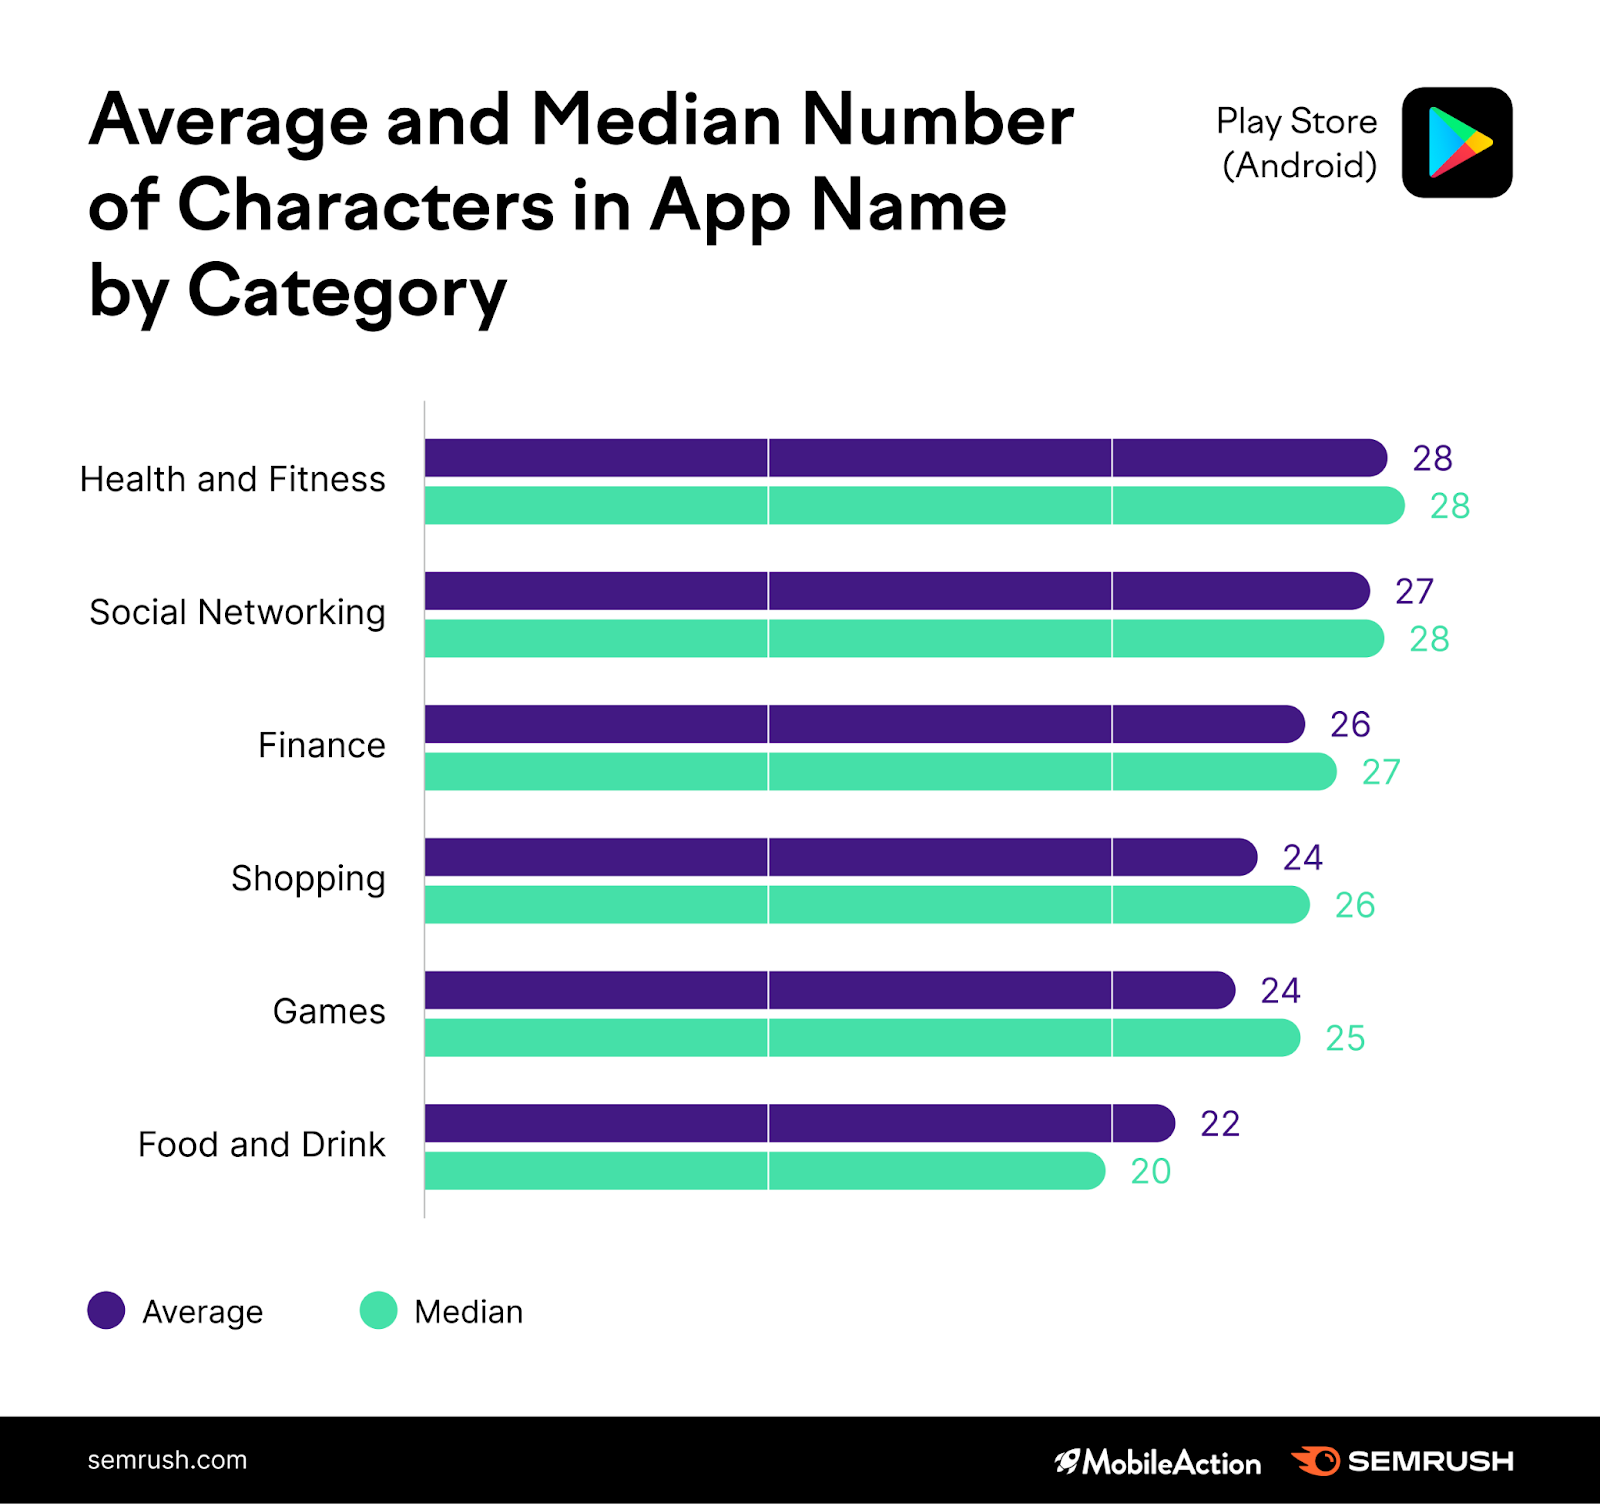
Health and Fitness apps tend to have the longest names, with an average of 28 characters, just like in the App Store.
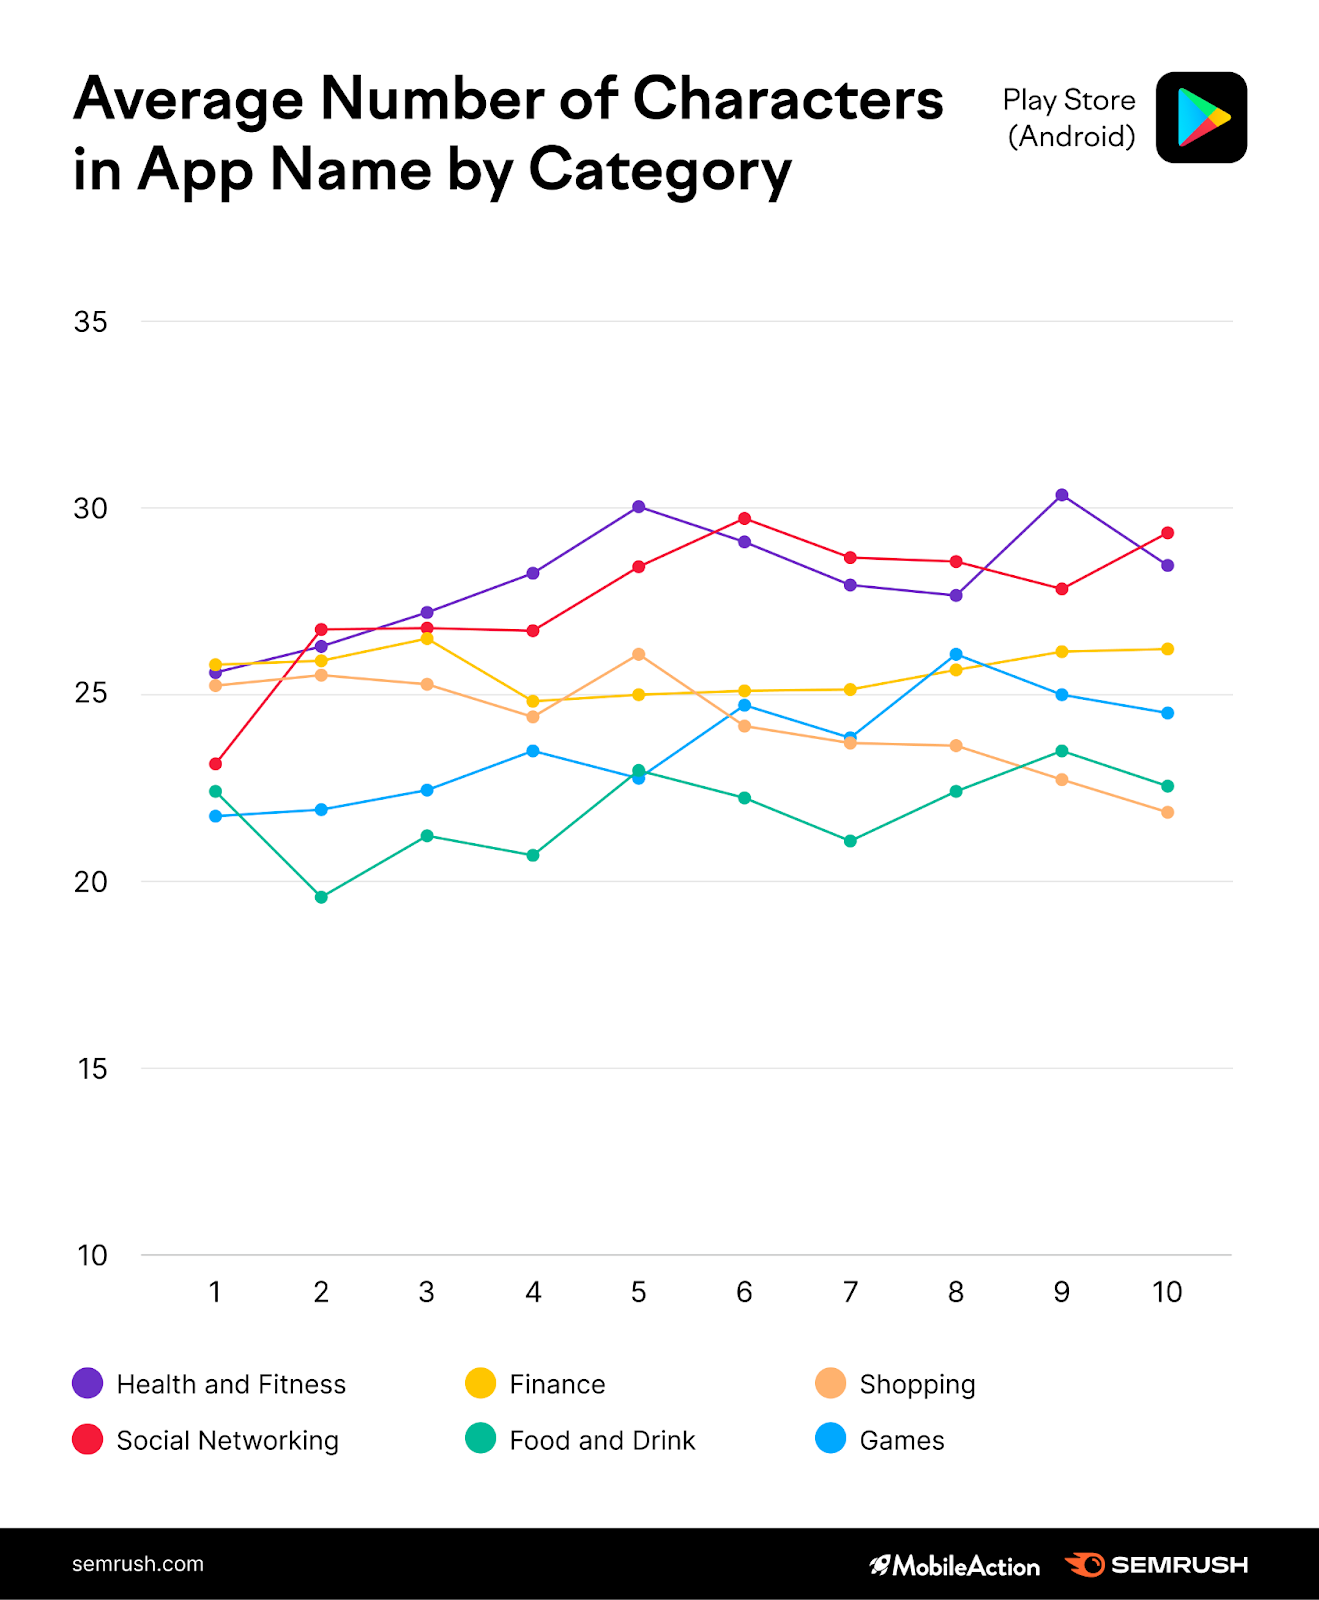
As for any influence of the title length on rankings, there is some difference between the categories. Health and Fitness, Social Networking, and Games apps do show a slight increase in positions with a lengthier app name. Finance, Shopping, and Food and Drink apps don’t appear to show any correlation between performance and title length.
As the Play Store indexes the entire content of the app for keywords, does this mean that we can spot a closer dependency between including a keyword in the title and rankings? Let’s see.
Just as in the App Store, the similarity between the app name and the keyword is stronger in the very top position. Meaning, adding a keyword to your app name is always a good idea if you want to race for the #1 spot. But the closeness of that similarity appears to be somewhat lower in the Play Store than in the App Store, which is curious given how differently the two app stores go about keyword indexing.
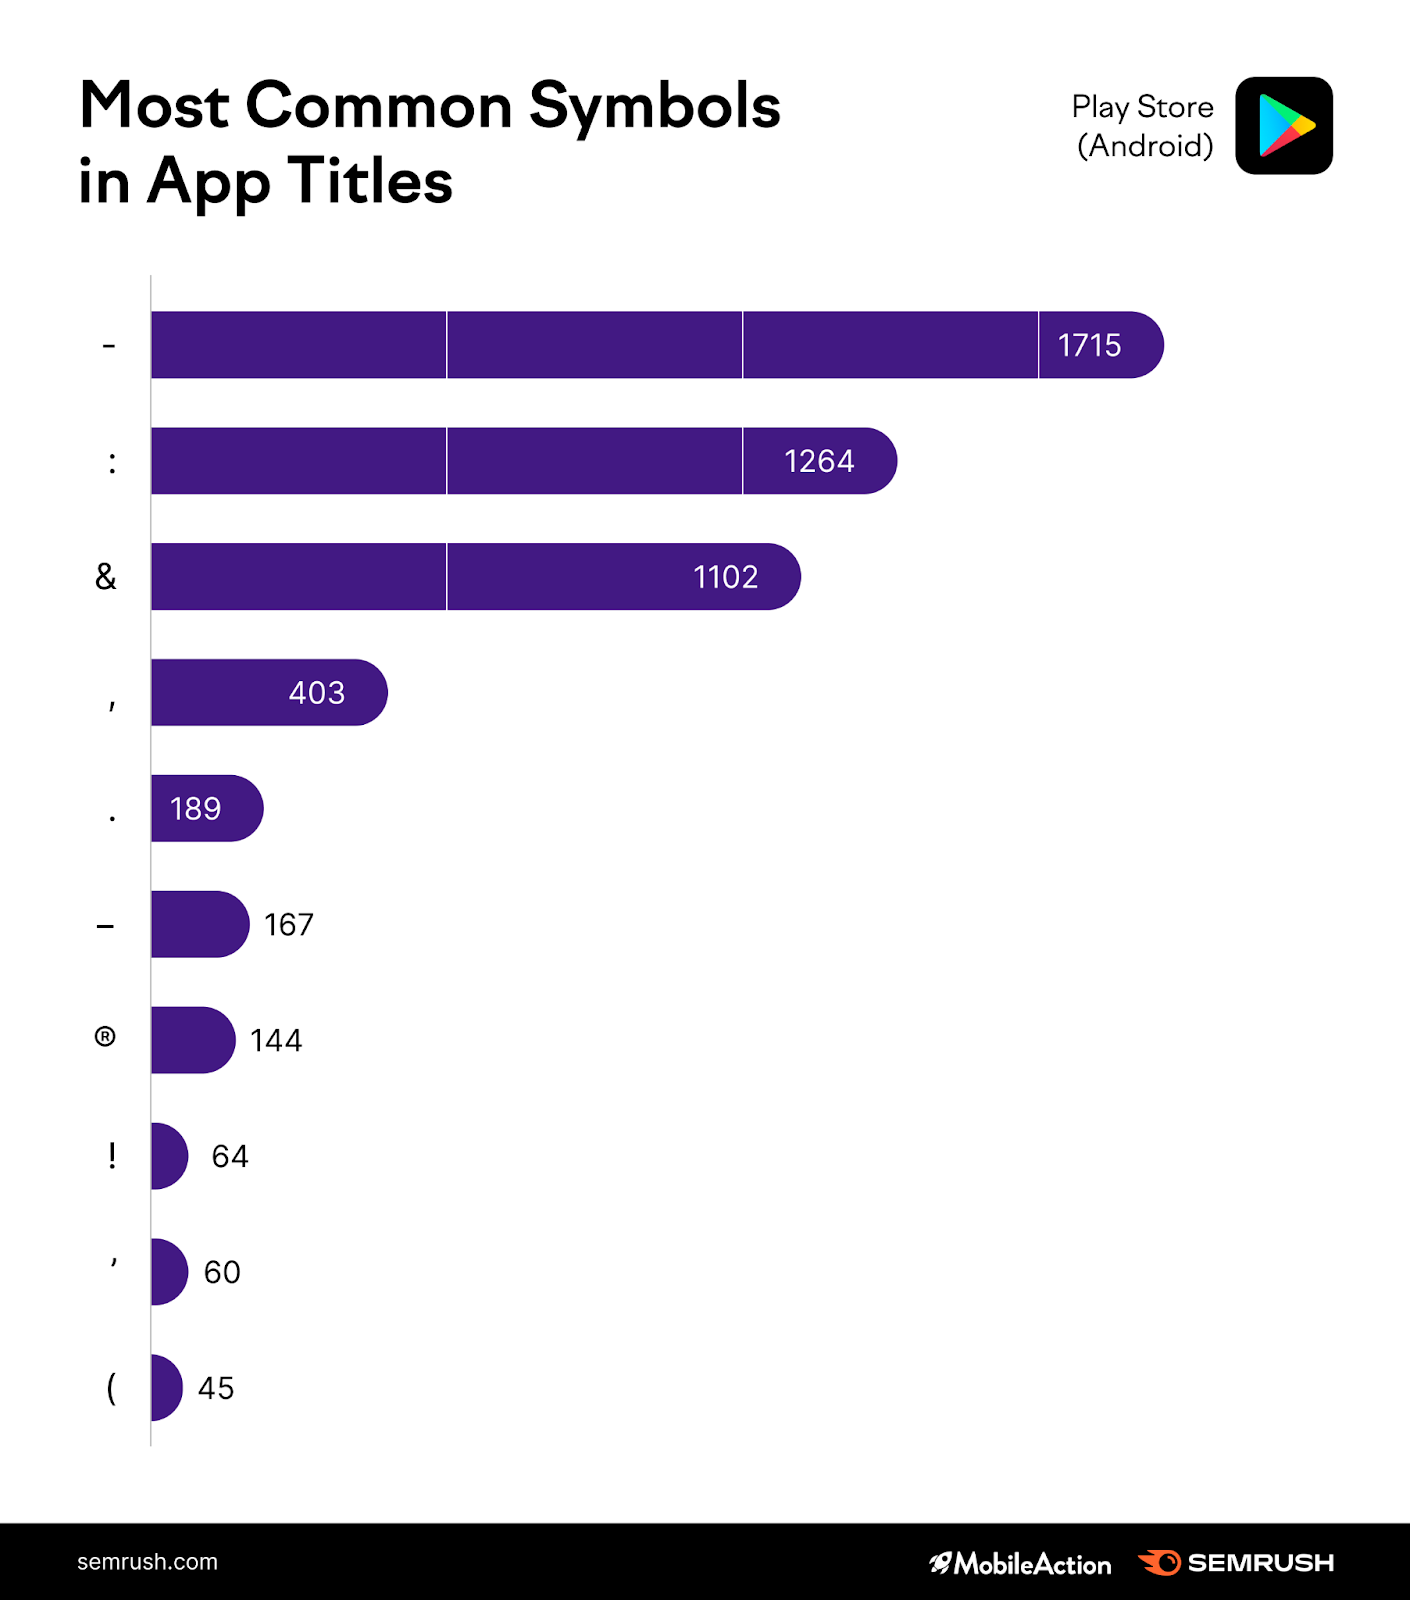
As for the most common symbols within app names, they are exactly the same as in the App Store: “-”, “:” and “&”. Social Networking and Finance apps use special characters the most. And, in general, Play Store apps use symbols within their title more than in the App Store.
App’s description
Apps ranking in the #1 position have the highest number of words within their description. From positions 2-10, we could see no decreasing trend, meaning that unless we’re talking about that top position, it really doesn’t matter how many words are included in the description.
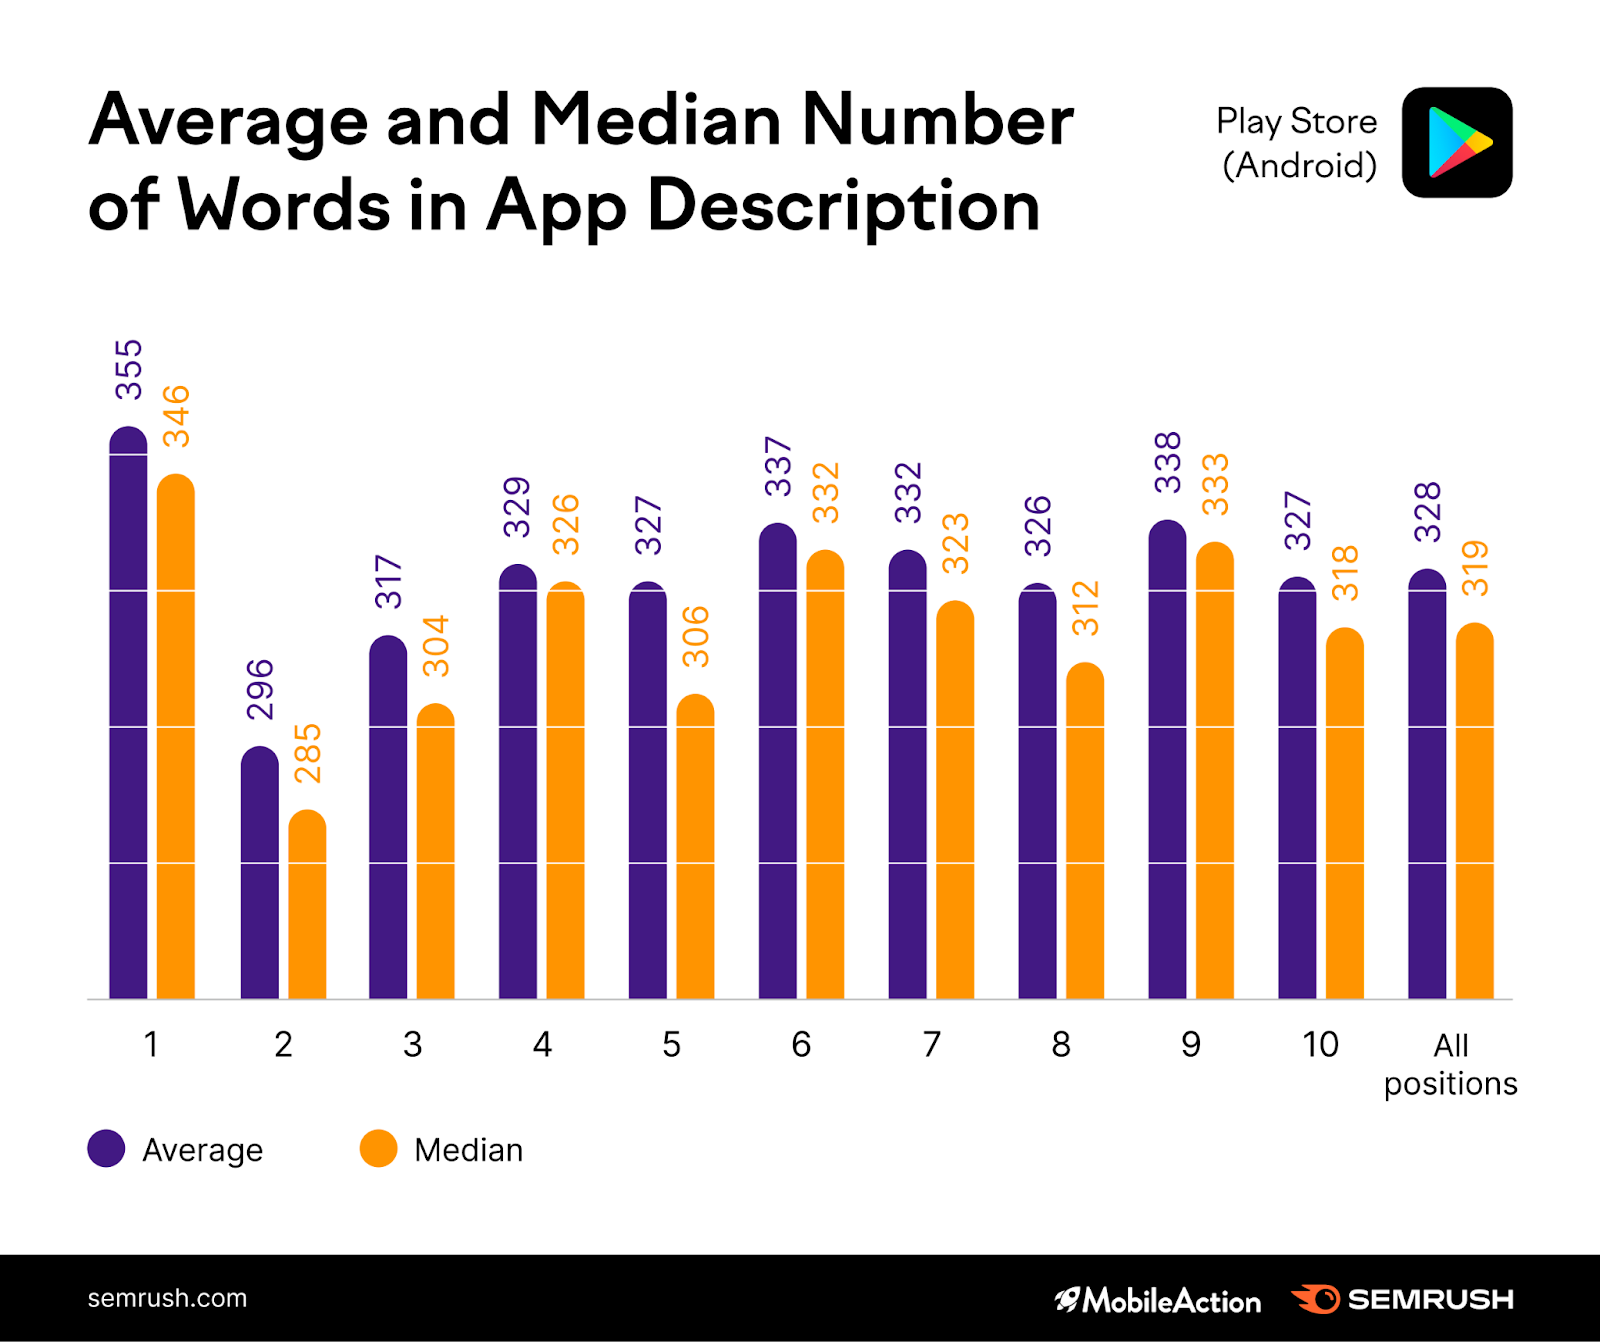
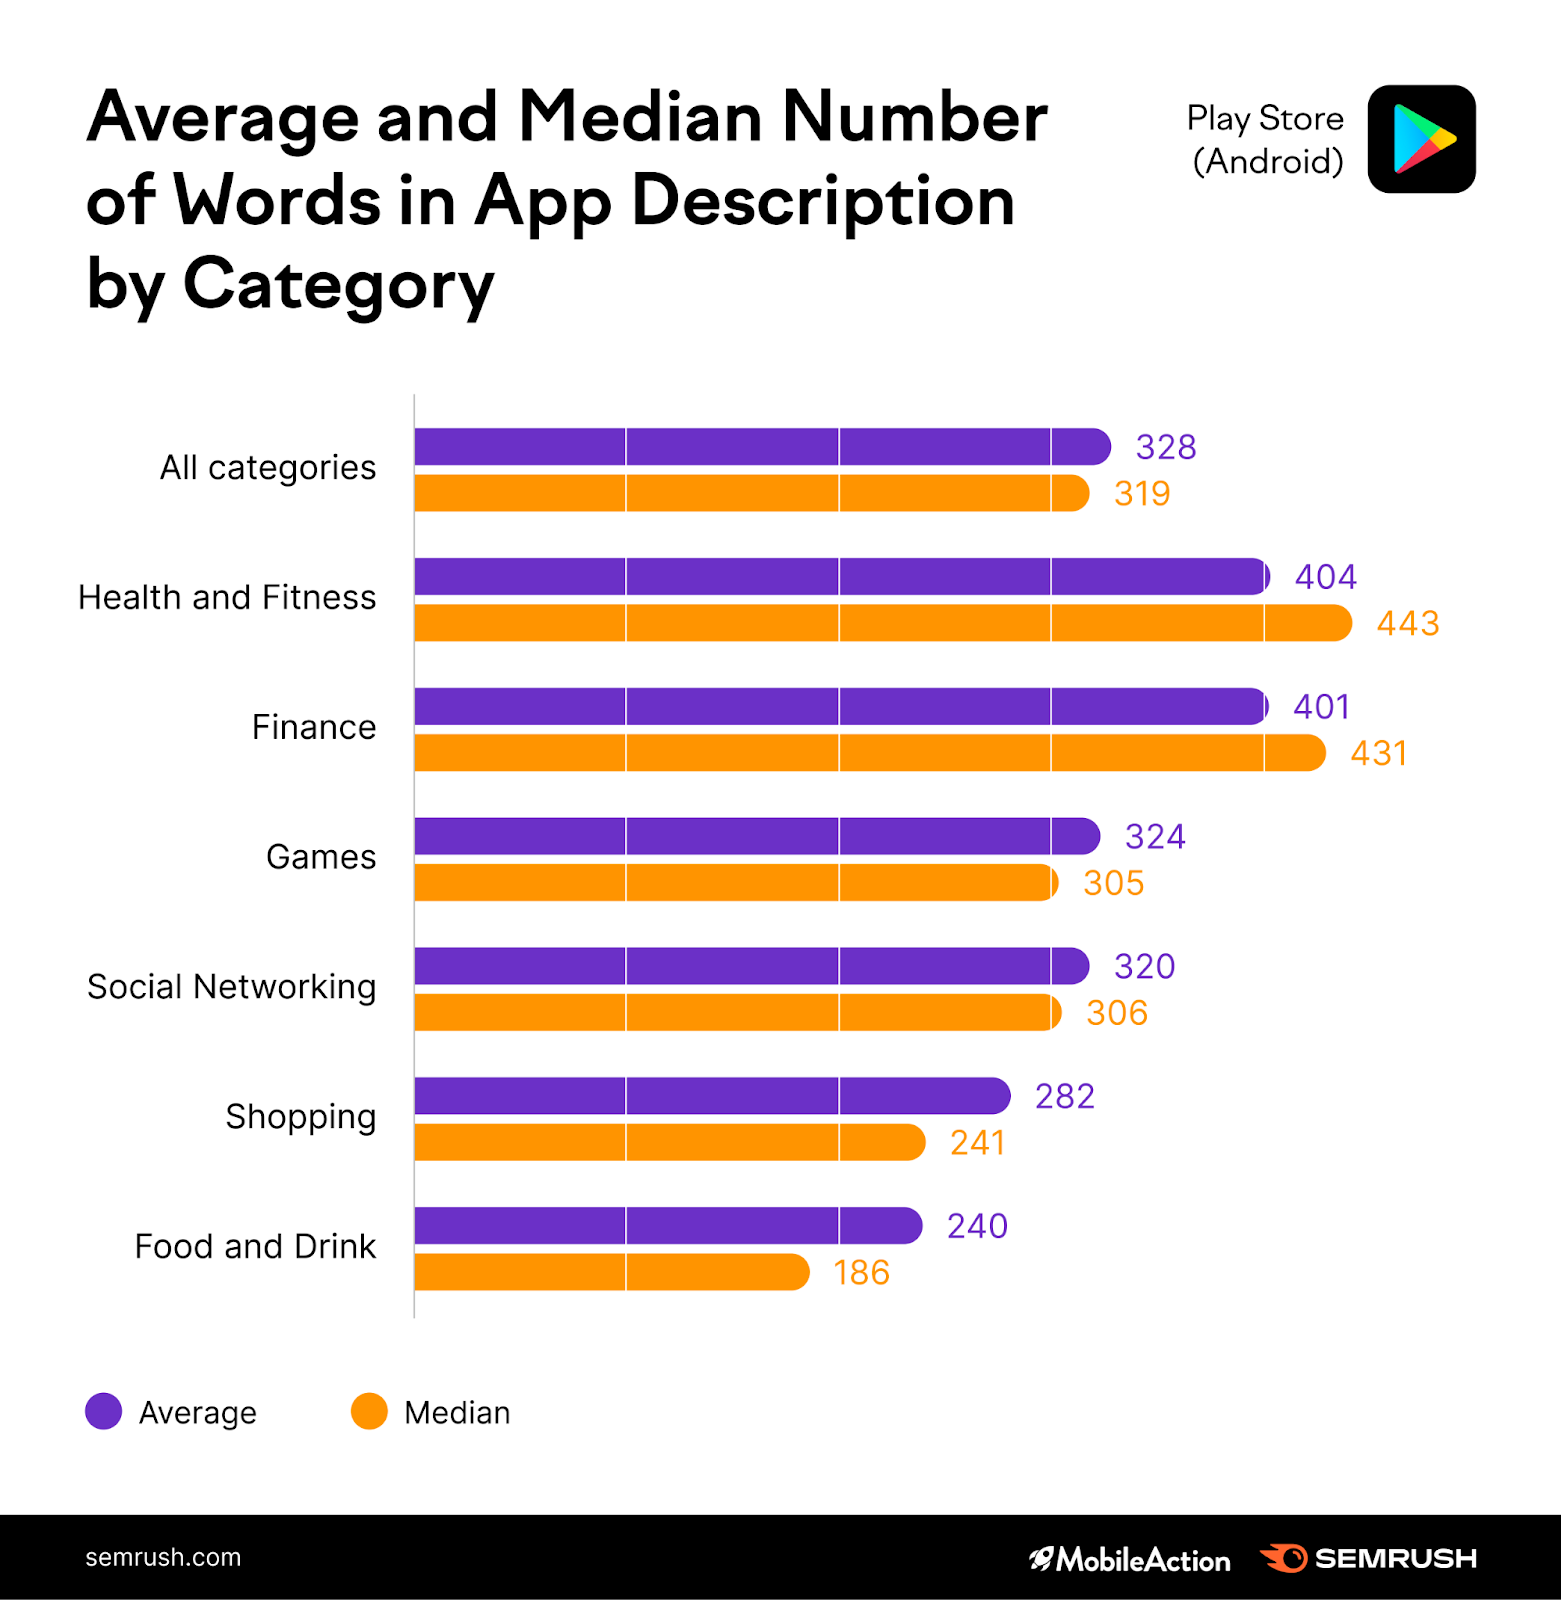
Similar to the App Store, Play Store apps’ descriptions have around 300 words, with Health and Fitness apps being more wordy (400+ words).
When it comes to various CTAs within descriptions, Play Store apps tend to use them more often than in the App Store. But as for the actual wording, it doesn’t vary much between the two platforms.
The table below features some of the most used CTAs for various app categories:
Health and Fitness
Social Networking
Finance
Phrase
Count
Phrase
Count
Phrase
Count
help you
367
chat with
241
secure
245
weight loss
310
new friends
170
manage your
193
track your
268
the best
160
access to
181
heart rate
231
meet new
146
you need
164
the best
219
your favorite
145
help you
130
you need
115
share your
130
send money
125
access to
109
free to
111
your money
117
improve your
108
connect with
97
track your
78
fat burning
94
help you
75
you want
78
your favorite
85
around the world
66
download the app
76
create your
66
free to download
65
money transfer
48
no equipment
58
allows you
64
buy and sell
47
download the app
57
you like
62
sign up
45
allows you
56
for free
59
friends and family
31
Food and Drink
Shopping
Games
Phrase
Count
Phrase
Count
Phrase
Count
your favorite
263
the best
179
the best
436
your order
154
the latest
175
play with
175
the best
113
your favorite
155
your favorite
149
you want
107
coupons and deals
112
enjoy the game
119
download the app
82
online shopping
81
become the
100
food delivery
82
help you
74
build your
90
order food
59
you need
74
train your
89
customize your
42
download the app
68
real money
84
earn points
38
cash back
68
with your friends
81
shopping list
38
promo codes
61
challenge your
72
for free
34
save money
57
compete with
67
to your door
31
track your
56
around the world
59
never been easier
20
gift cards
55
opportunity to win
31
app lets you
19
black friday
39
waiting for you
29
App’s icon
Just as in the App Store, Play Store apps’ icons typically have four colors, with white as the most popular color. But then, the picture differs a lot.
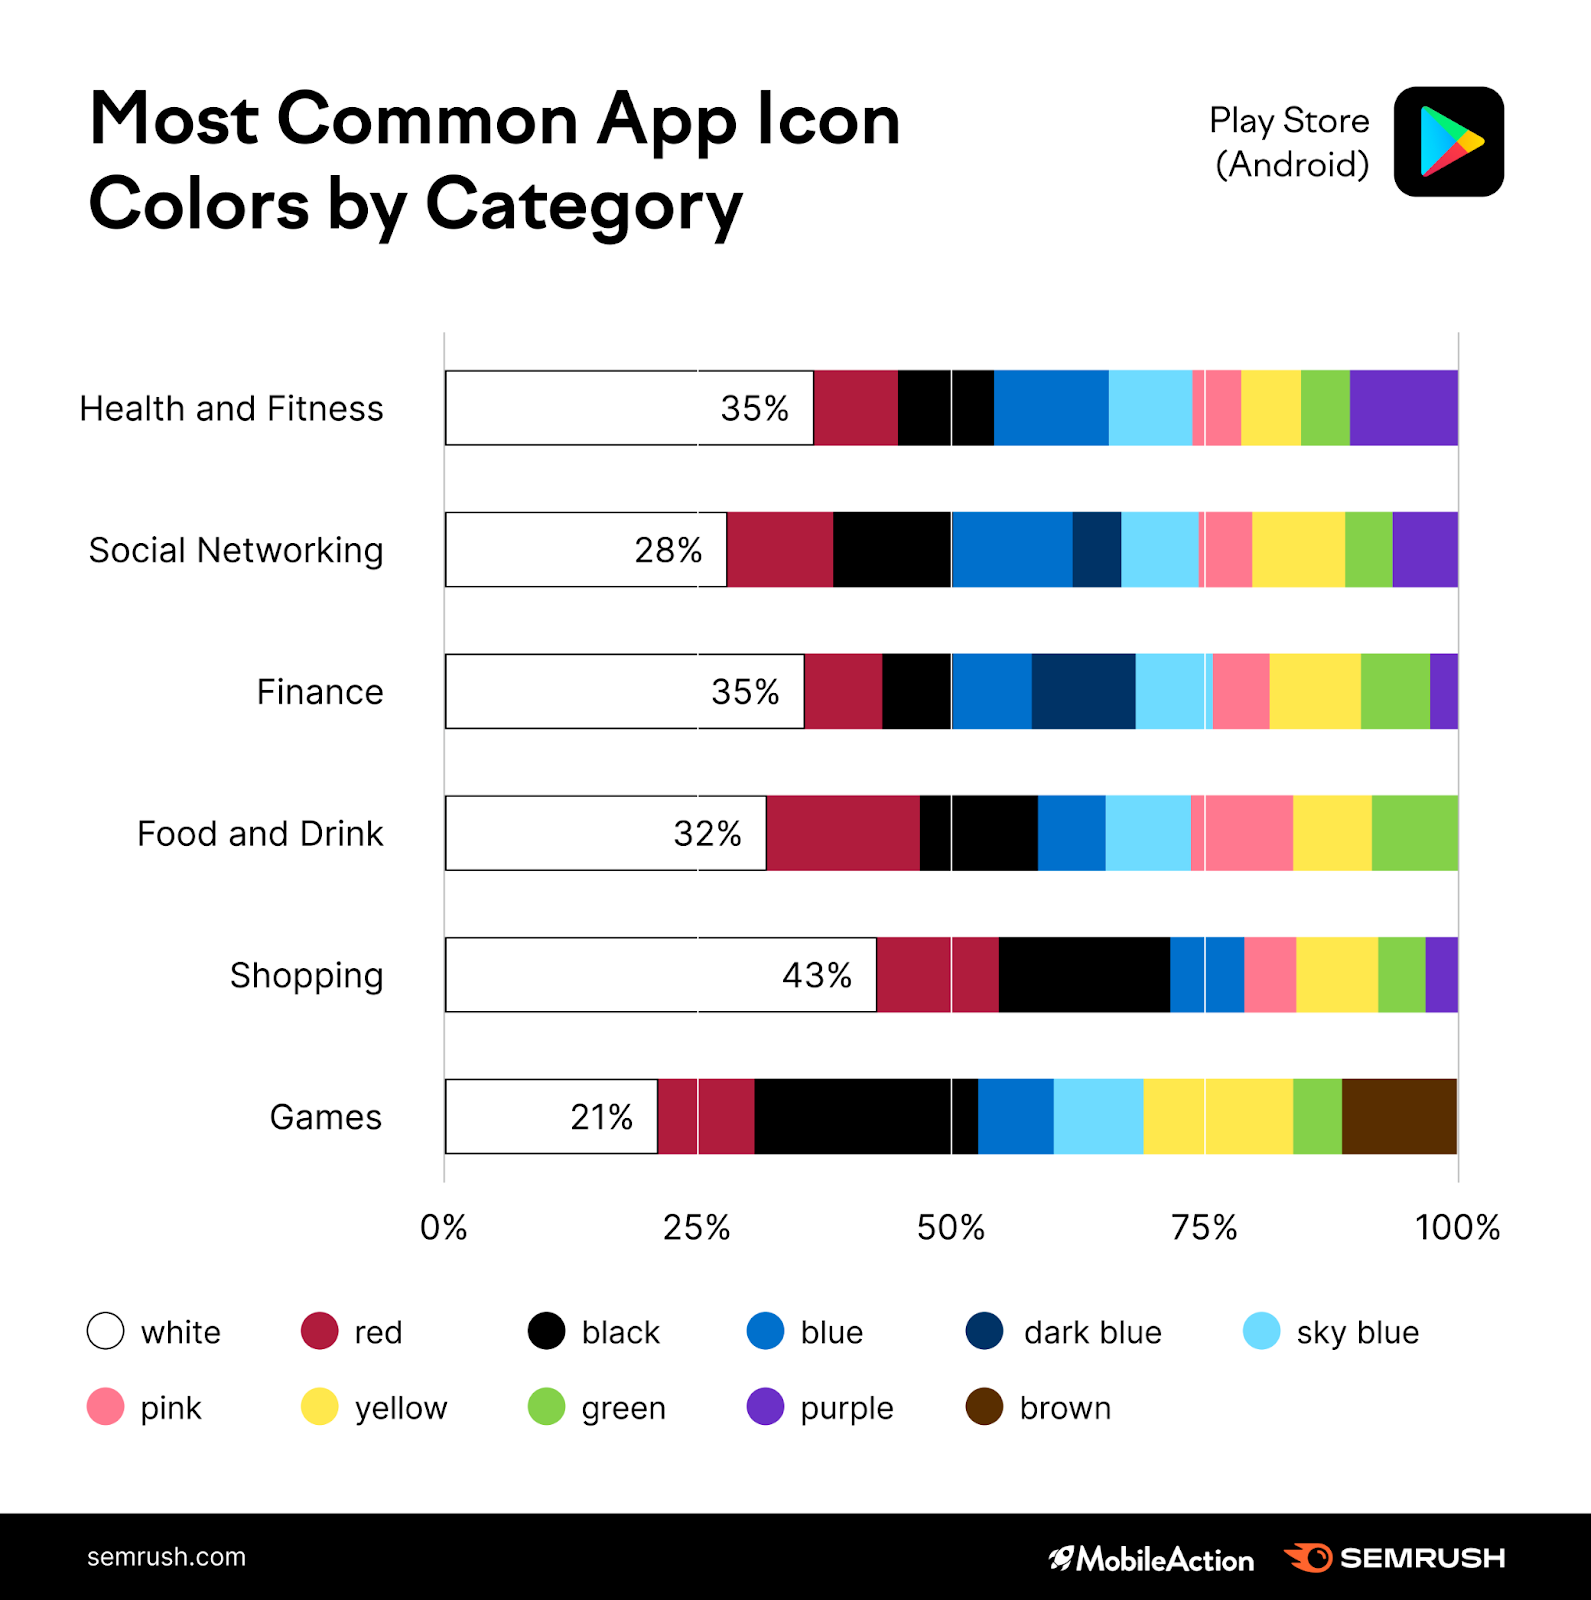
In the Play Store, Health and Fitness apps have more purple, and Food and Drink apps appear to add more green shades.
While the icon stays the same in both stores, the top 10 across the stores feature different apps, hence the discrepancy.
(How) Do Technical Features Influence Apps’ Performance?
App size
The top-performing apps in the Play Store seem to be “lighter” than they are in the App Store. If the latter’s average is at 174MB, Android apps are around 60MB in size.
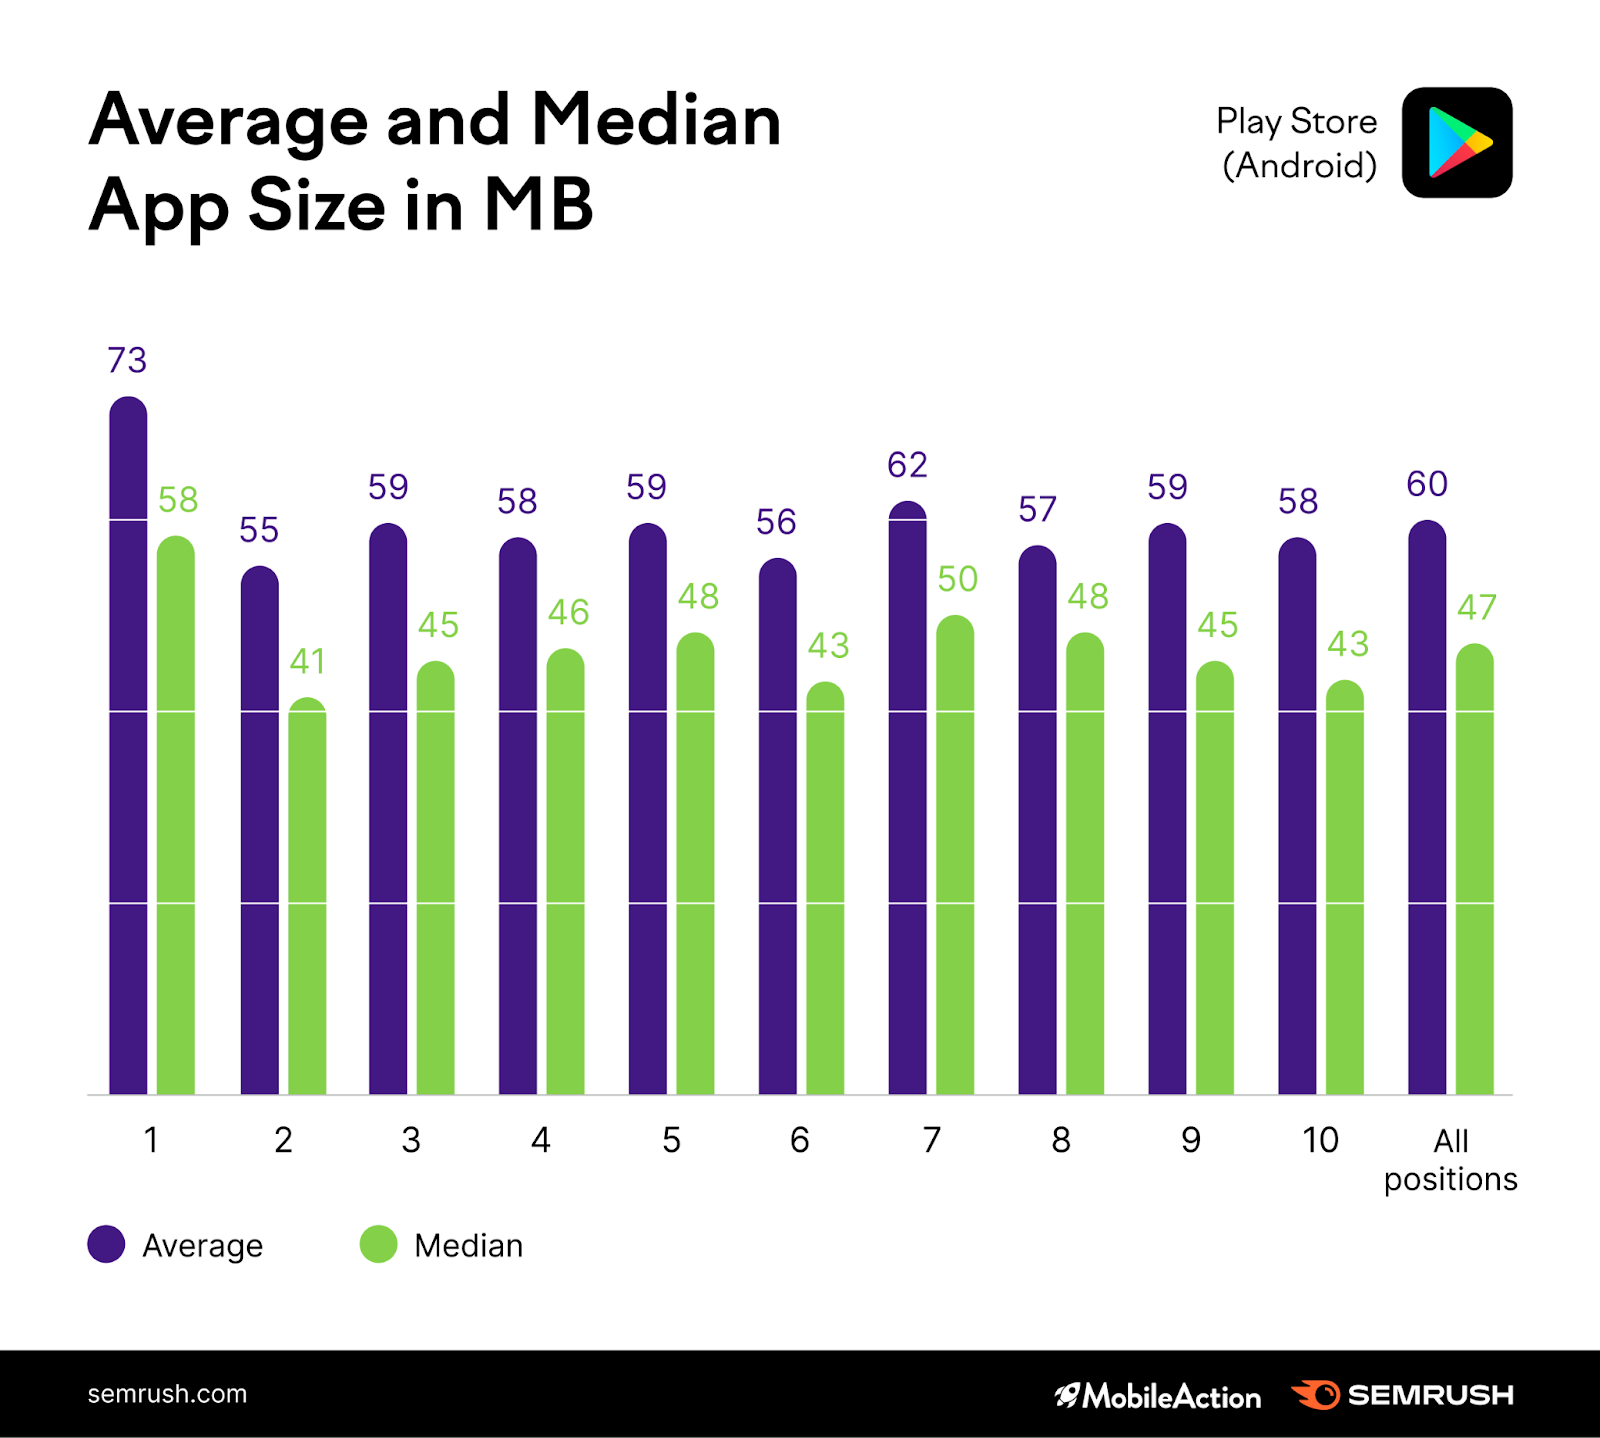
Once again, the “heaviest” apps take over the top spots across the board.
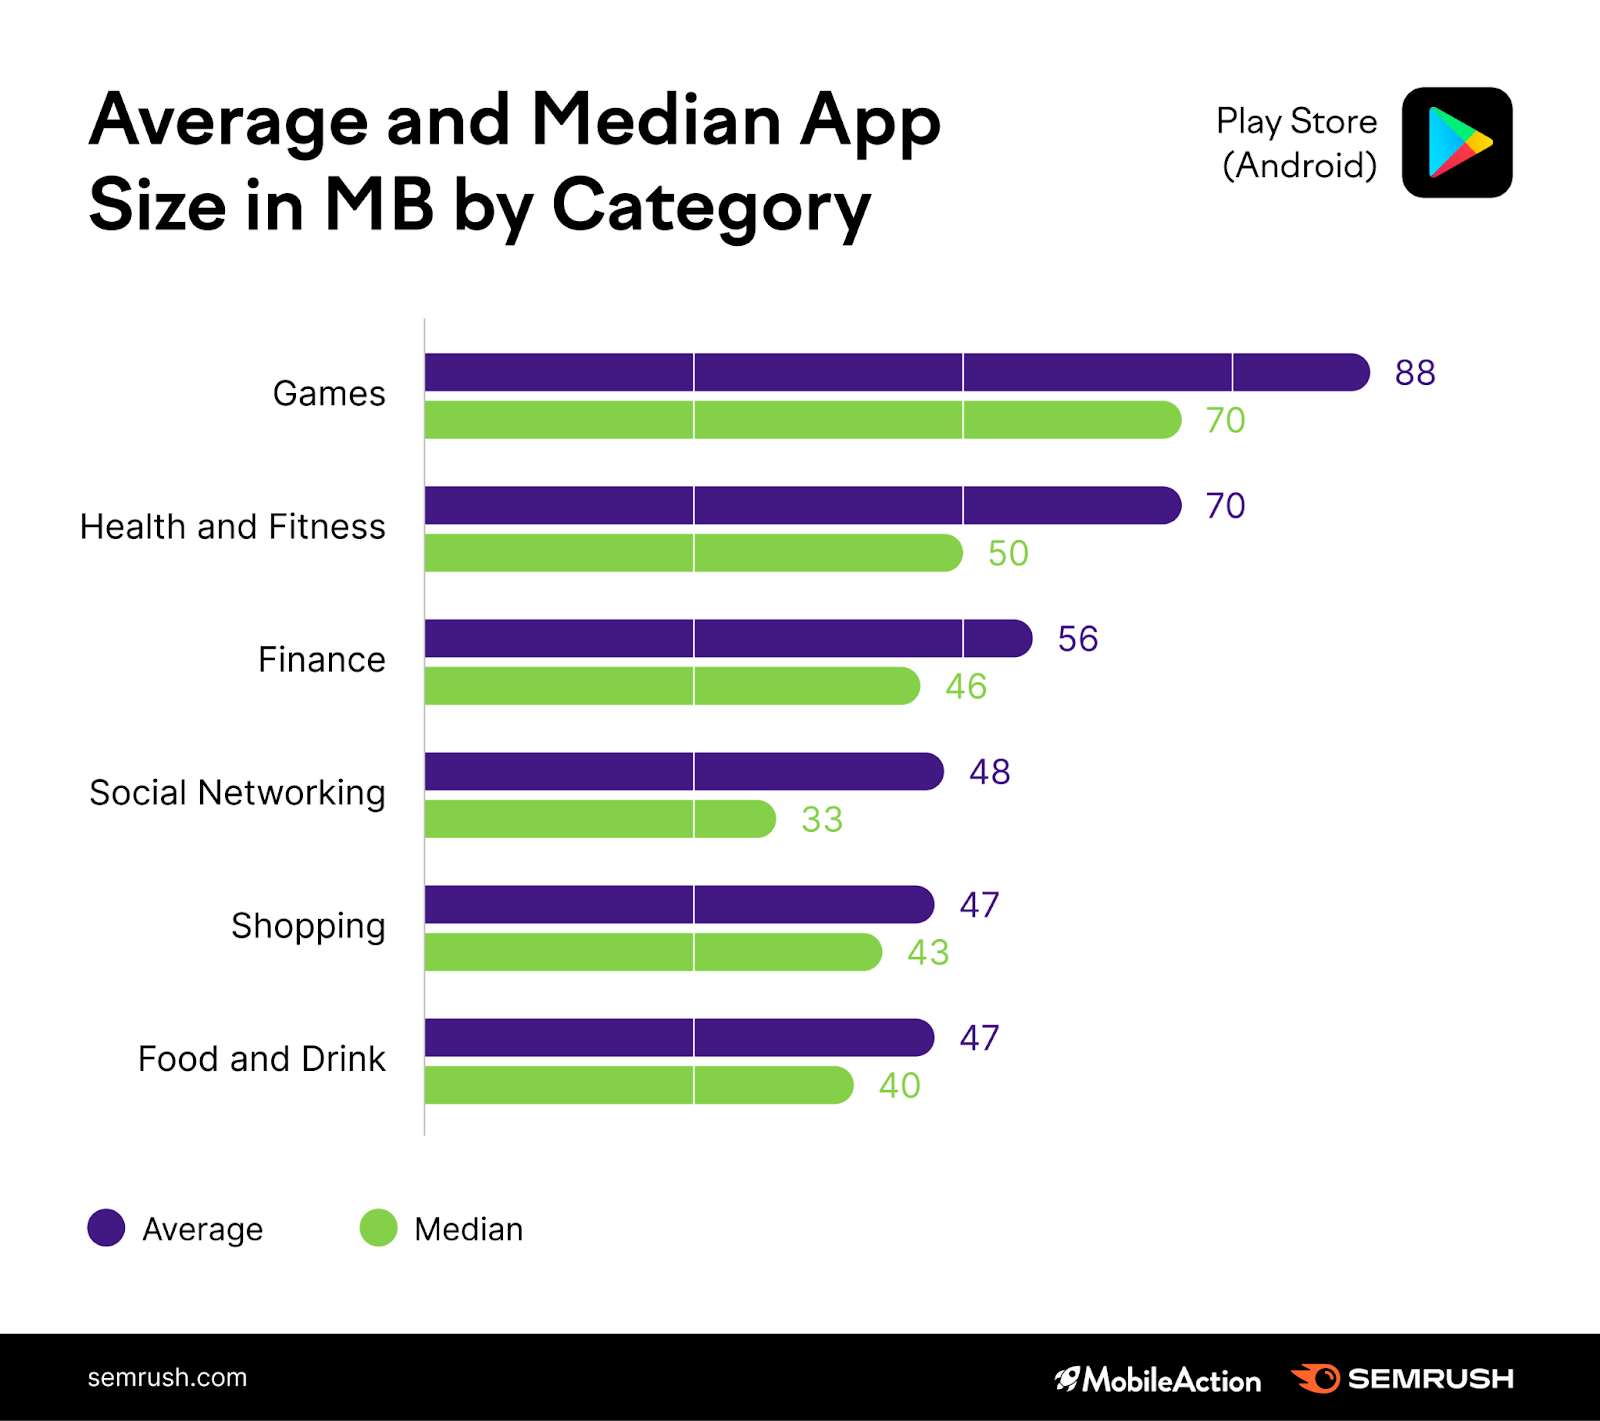
Games apps in the Play Store are almost 50% bigger than the rest.
App updates
The average app in the Play Store has 22 days between updates; this is one day more than the average for iOS apps.
When it comes to the top spots, however, it appears that the Play Store cares about app “freshness” slightly more than the App Store. Apps that make it into the #1 position tend to have the most recent updates.
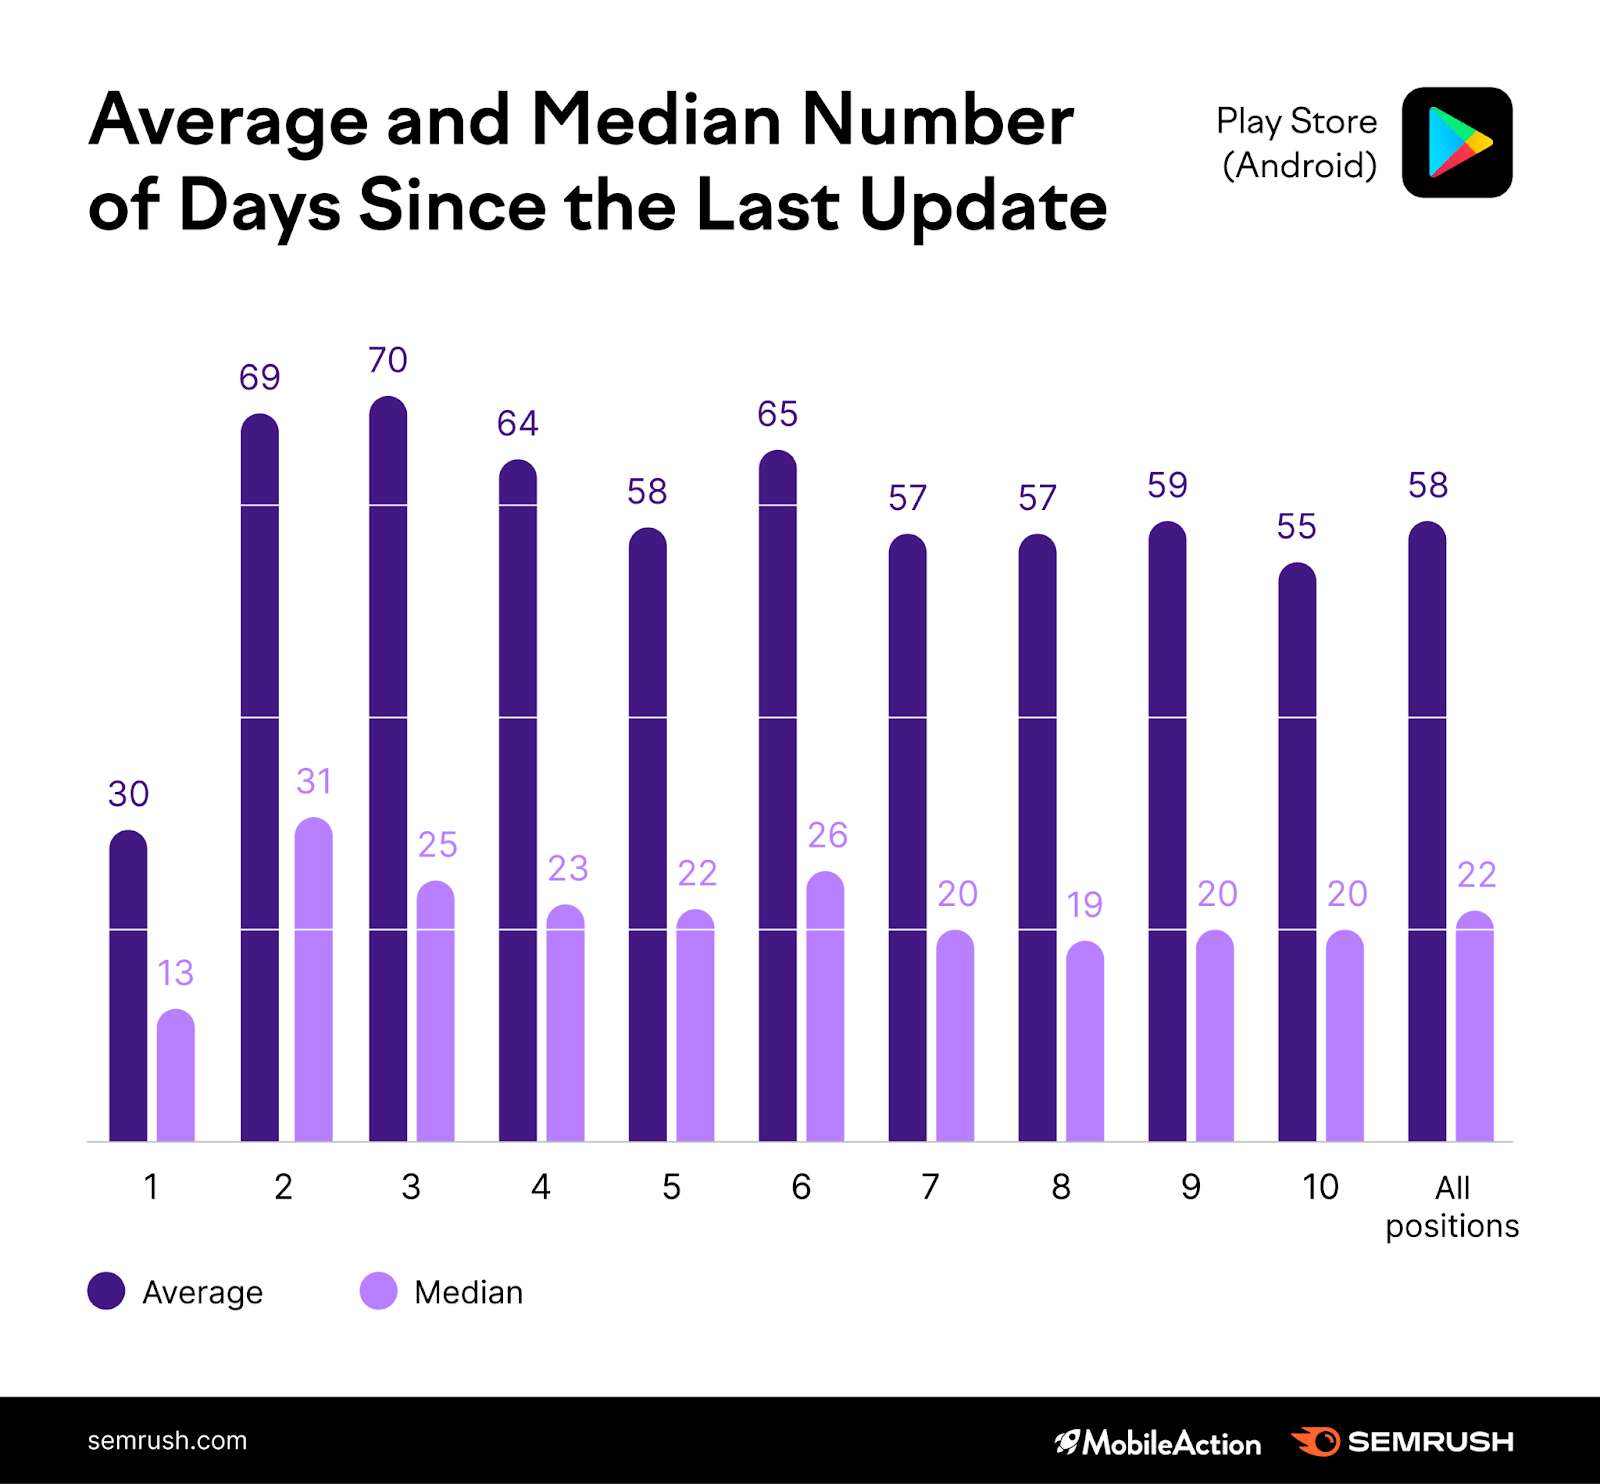
Beyond the first position, the correlation weakens, if not disappears.
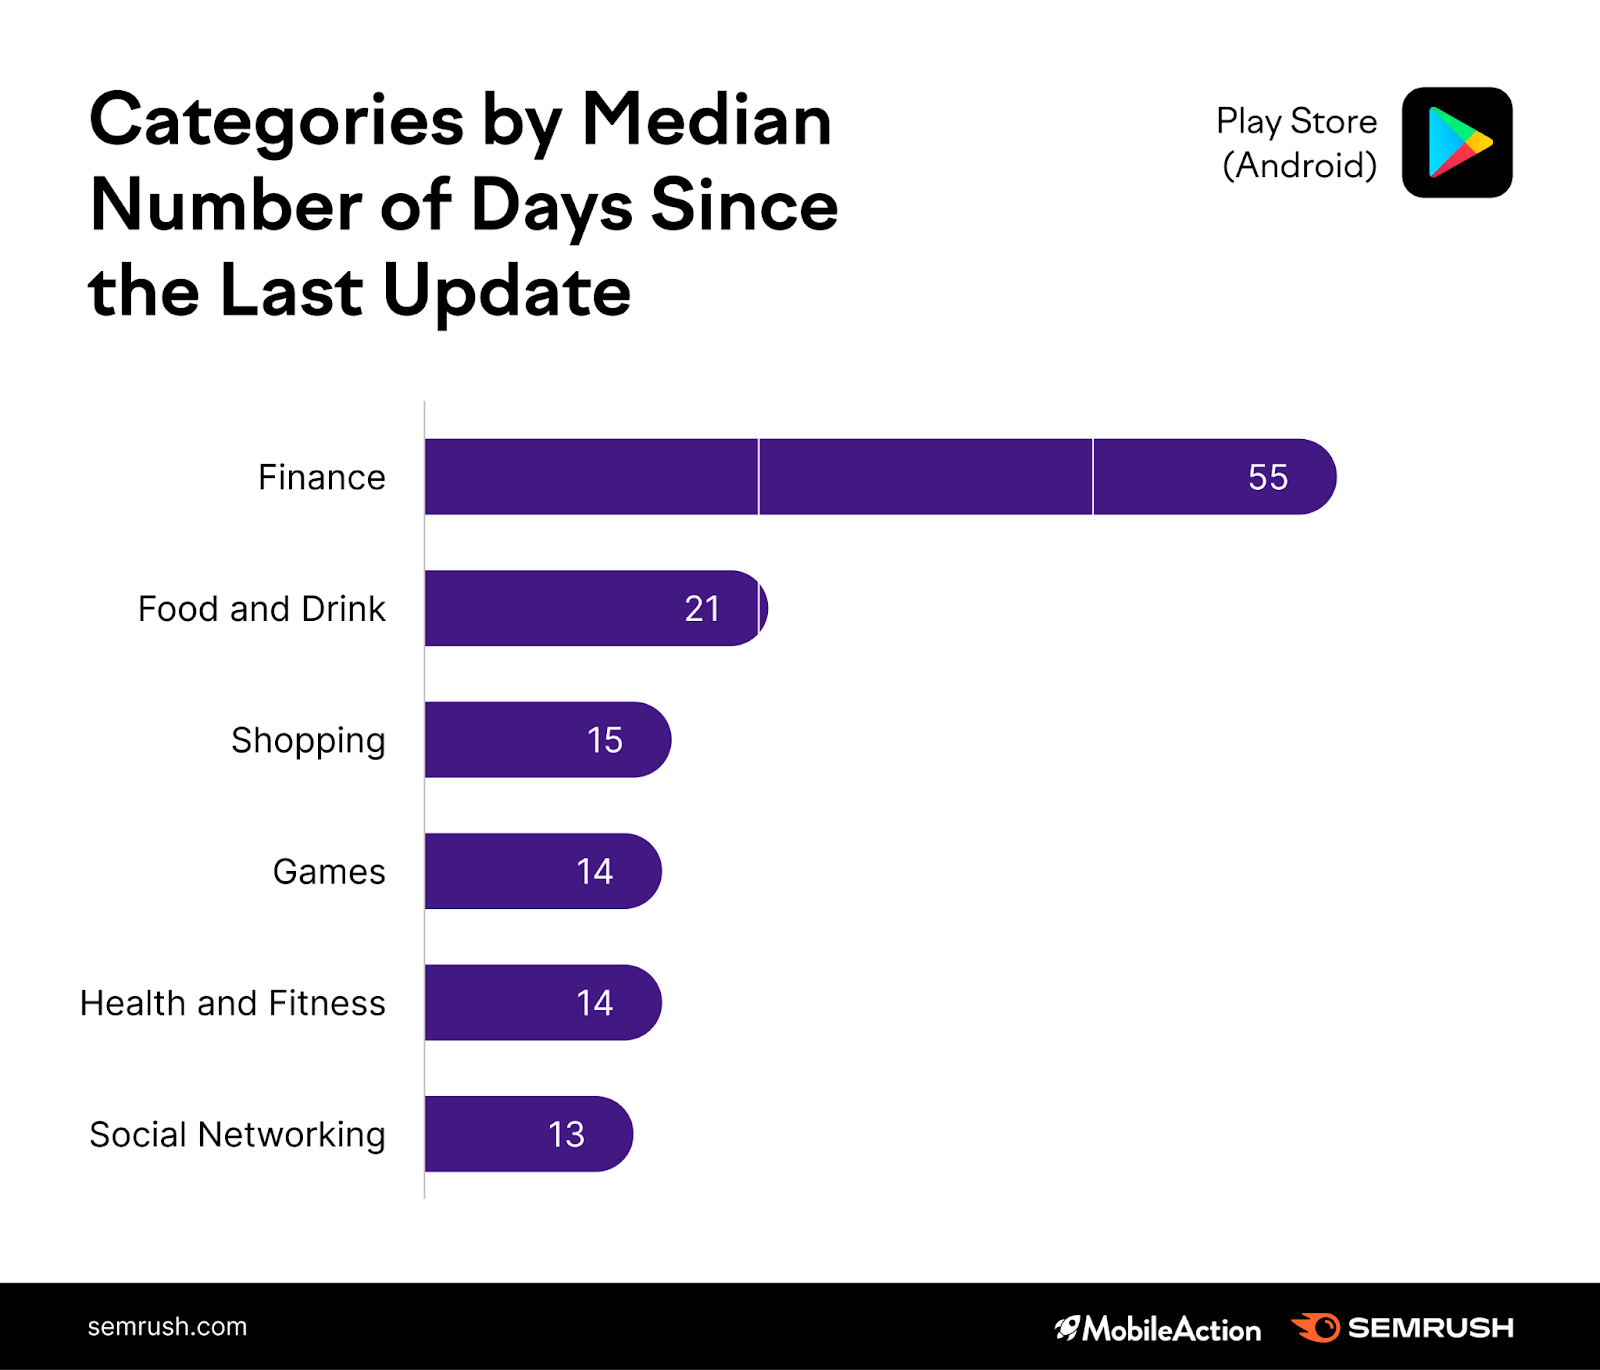
The App Store’s most up-to-date apps are typically within the Finance category. In the Play Store, it’s Social Networking apps that feature more updates. In contrast to the App Store, Finance apps on Android have the highest number of days between releasing improvements.
App monetization
From a bird’s-eye-view, the Play Store features more free apps than its iOS counterpart. We even spotted that some apps have a price tag on the App Store but are free on Android.
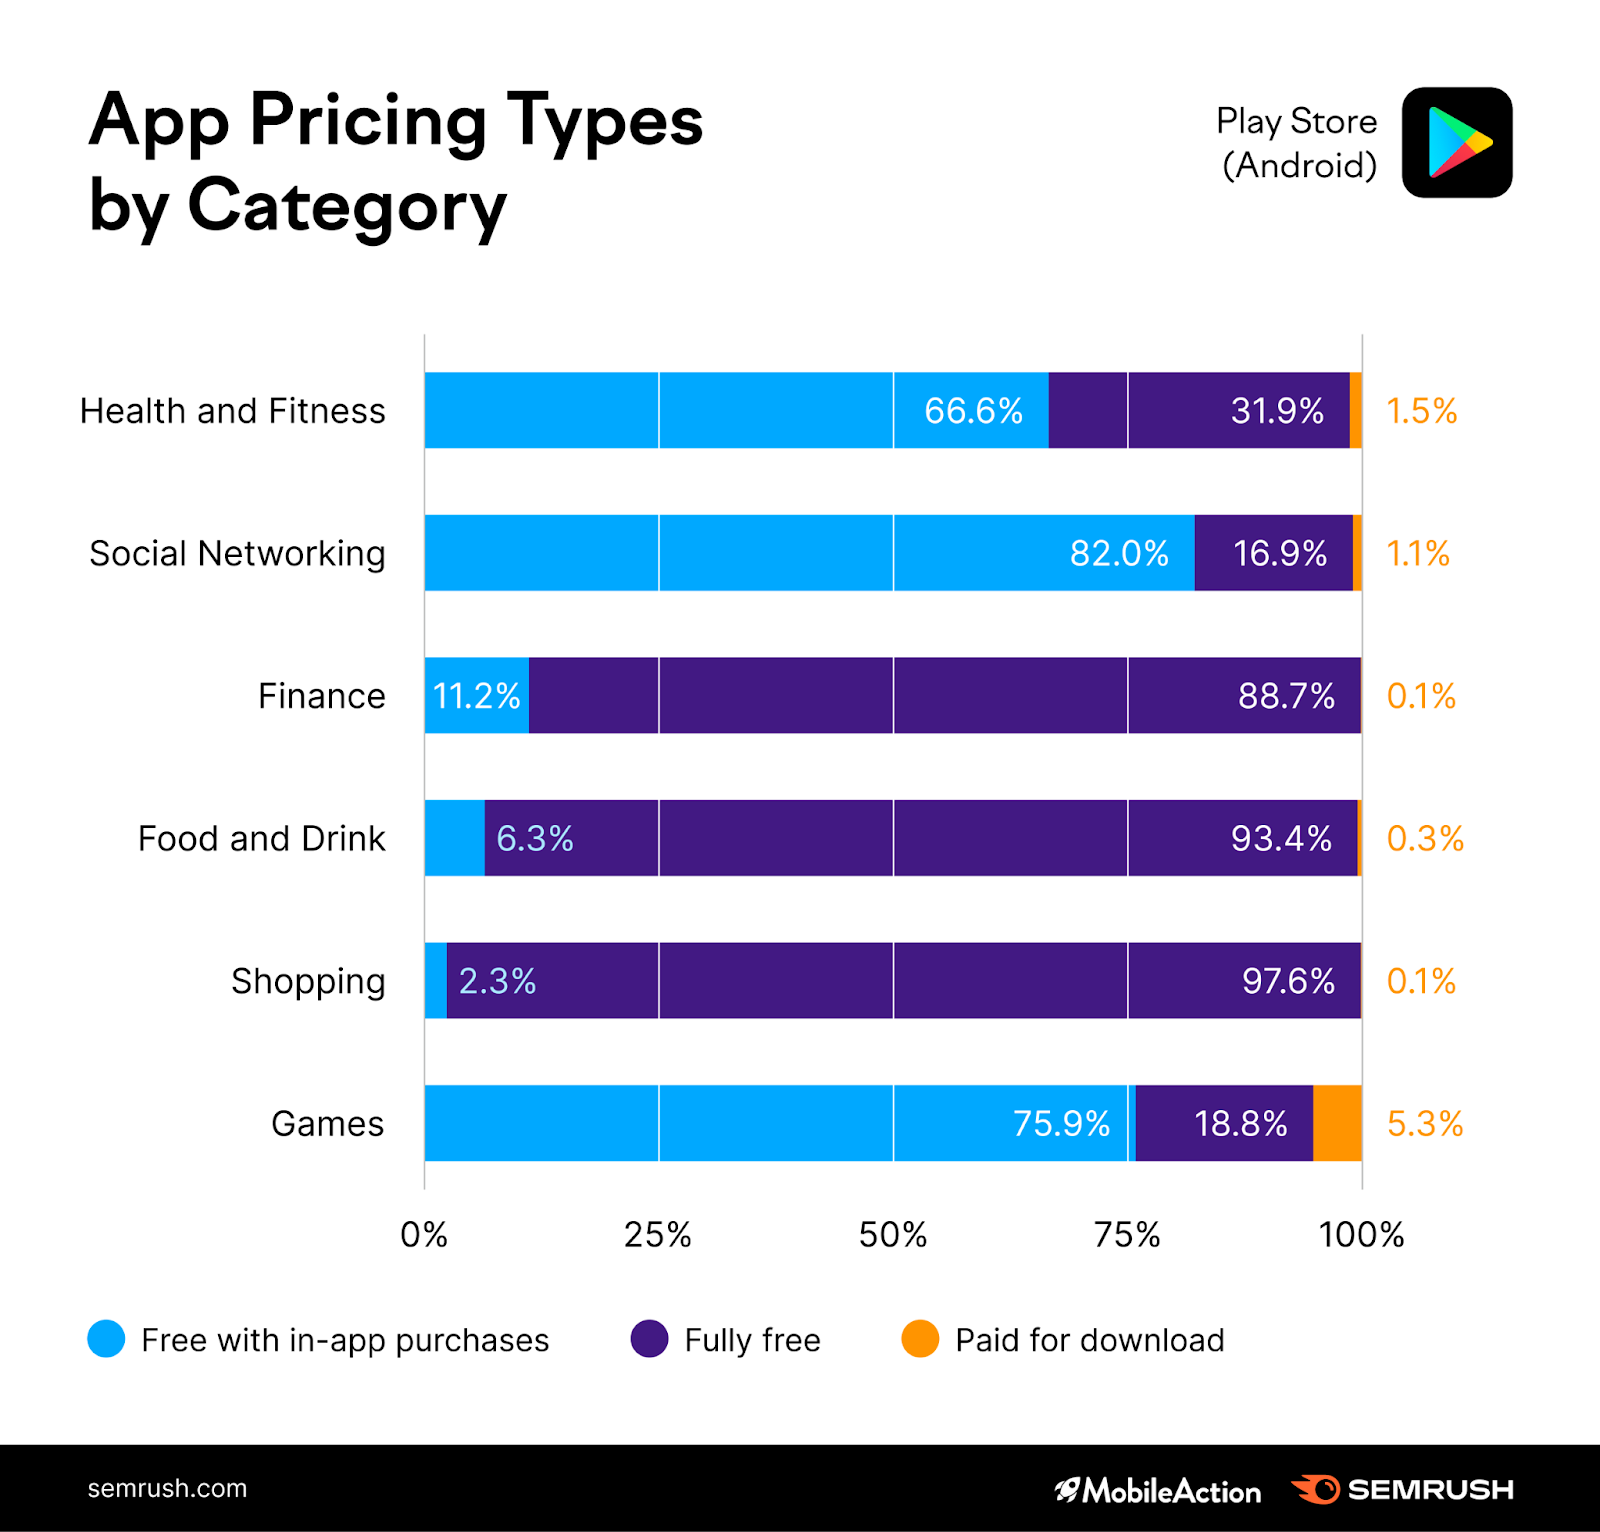
The overall patterns, however, are consistent across the stores. Health and Fitness, Social Networking, and Games apps are typically free to download but have internal purchases. Apps from Finance, Food and Drink, and Shopping categories tend to be fully free as they earn from selling their product rather than the app itself.
How Diverse Is the App Developer Landscape Within the Play Store?
Diversity of developers and apps
The Play Store seems to be less competitive than the App Store when it comes to the diversity of developers.
Health and Fitness
Social Networking
Finance
Developer
count
Developer
count
Developer
count
Leap Fitness Group
72
TikTok Pte. Ltd
26
Bank of America
34
Google LLC
19
Perry Street Software
25
PNC Bank, N.A.
20
iFit
16
Hornet Networks Ltd
20
TD Ameritrade
19
Fitbit, Inc.
16
Media Republic Apps
16
U.S. Bank Mobile
18
Nike, Inc.
16
Bigo Technology Pte. Ltd
16
Capital One Services, LLC
17
FitOn
14
9 Count
15
Coinbase Android
17
MapMyFitness, Inc.
14
Meta Platforms, Inc.
15
Robinhood
15
MyFitnessPal, Inc.
14
Grindr LLC
14
Green Dot
15
Simple Design Ltd
13
Video Chat Alternative
14
NetSpend
14
Smart Wearable Devices
13
Twitter, Inc.
13
Binance Inc.
13
Food and Drink
Shopping
Games
Developer
count
Developer
count
Developer
count
Uber Technologies, Inc.
42
Foot Locker, Inc.
38
ELECTRONIC ARTS
39
Double Fox Games
35
Nike, Inc.
29
My Town Games Ltd
20
Chick-fil-A, Inc.
31
Nordstrom, Inc.
22
Zynga
18
DoorDash
27
Wish Inc.
21
ninja kiwi
17
Starbucks Coffee Company
26
Poshmark, Inc.
21
Amanotes PTE, LTD
14
Grubhub
22
Alibaba Mobile
20
Miniclip. com
13
McDonalds USA, LLC
21
Roadget Business PTE. LTD
18
2K, Inc.
13
Burger King, Inc.
20
Etsy, Inc
17
etermax
12
ChowNow
18
Forever 21
16
Gameloft SE
12
Dunkin' Brands, Inc.
15
Walmart
15
PlaySimple Games
11
Across categories, we see more dominance of certain players, with the only exception being Social Networking and Food and Drink niches. In Health and Fitness, Leap Fitness Group has around 35% of the apps’ share within the industry. In Games, Electronic Arts owns around 23% of all the gaming apps.
Search trends
When it comes to the way people search for apps, Android users appear to be just as focused on brand names as iOS users. So, whether you are promoting your app on the Play Store or the App Store, it’s brand awareness that helps you win the race.
Health and Fitness
Social Networking
Finance
Keyword
Rank
Keyword
Rank
Keyword
Rank
fitbit
1
snapchat
1
coinbase
1
planet fitness
2
grindr
2
venmo
2
my fitness pal
3
yubo
3
bank of america
3
fitness’
4
4
crypto com
4
calm+
5
social media
5
credit karma
5
peloton
6
tik+tok
6
truebill
6
workout +
7
who stalks
7
metamask
7
calorie-counter
8
meet me
8
zelle
8
fasting tracker
9
live . me
9
citi mobile app
9
noom
10
10
trust wallet
10
Food and Drink
Shopping
Games
Keyword
Rank
Keyword
Rank
Keyword
Rank
mcdonalds app
1
shein
1
solitaire+
1
chipotle
2
footlocker
2
car games
2
pizza hut
3
stockx
3
slots +
3
taco bell
4
mercari
4
puzzle games
4
burger king
5
shop
5
casino
5
wendys app
6
aliexpress
6
basketball games
6
gopuff
7
ebay
7
retro bowl
7
food delivery
8
old navy
8
sudoku+
8
chick fil a app
9
depop
9
trivia
9
buffalo wild wings
10
finish line
10
racing games
10
Over to You
Now that you know more about ASO optimization and what makes the top-performing apps rank the way they do, here’s a final checklist that sums up our ASO study findings and highlights the most actionable discoveries:
Reviews have a more direct impact on your rankings than ratings. So don’t get discouraged when you see those 4 stars. The leading apps in their categories also don't make it to 5 stars. Find out the average number of reviews for the top apps in your industry and try to hit that benchmark, or it can be a deal breaker. Get creative and add lengthier descriptions for your app. It might not matter much for lower ranks, but descriptions of apps in the top 3 positions feature more words. Don’t forget to add compelling CTAs to your descriptions. They vary from industry to industry, but if you read carefully through our study, you’ll start noticing some patterns — for example, financial apps tend to highlight security, gaming apps set users up for a challenge, while some other categories want to convince users they are “the best”. Make sure your app name includes your target keyword! App size is not a problem. In fact, top apps tend to be “heavier” than the rest. So don’t hesitate to add more graphics and other features you think add MBs to your app — neither the App Store nor the Play Store seem to mind. When it comes to ranks, your pricing model doesn’t matter. Meanwhile, scout the competition and explore their monetization models. Because while stores might still give you those ranks, users might be more sensitive to pricing. Don’t release updates for the sake of updates. Rankings-wise, your last update date has little impact. ‘If it ain’t broke, don’t fix it’, but if you see issues with the user experience and other problems, updates are a must.For more ASO insights, check out our comprehensive App Store Optimization guide.
Innovative SEO services
SEO is a patience game; no secret there. We`ll work with you to develop a Search strategy focused on producing increased traffic rankings in as early as 3-months.
A proven Allinclusive. SEO services for measuring, executing, and optimizing for Search Engine success. We say what we do and do what we say.
Our company as Semrush Agency Partner has designed a search engine optimization service that is both ethical and result-driven. We use the latest tools, strategies, and trends to help you move up in the search engines for the right keywords to get noticed by the right audience.
Today, you can schedule a Discovery call with us about your company needs.
Source:


