

With the last phase of the rollout taking place back in August 2021, the Core Web Vitals update is already here. This means that we can now move on from preliminary assessments and identify some common patterns.
Our extensive Core Web Vitals study covers the following areas:
Taking historical data, we reviewed how update-ready both mobile and desktop websites were and which Core Web Vitals metrics (Largest Contentful Paint, Total Blocking Time,* and Cumulative Layout Shift) came with better values. We’ve also managed to highlight the most crucial factors that affect the pages’ performance in regard to the three metrics. Using intel from our Site Audit tool, we’ve looked at the average values for LCP, TBT, and CLS and pinpointed the most frequent issues across each metric.Armed with these insights, you can be better equipped to optimize your pages for maximum CWV compliance and so ensure ultimate user-friendliness and higher rankings.
*Note: in Site Audit, we use the Total Blocking Time (TBT) metric instead of the First Input Delay (FID) metric, as the latter implies having access to data from real users. Google itself stated that these two metrics correlate with each other and can both be used to assess interactivity issues.
Study Methodology
Our study is separated into a few parts:
The assessment of the changes for CWV compliance before and after the update. A look into factors that influence whether a site passes thresholds for each metric. A full CWV audit of the analyzed websites for exploring the most and least frequent issues for each metric.The first part of the study is based on the analysis of 1.7M desktop and 324K mobile URLs. We stacked pre-update June 2021 values for LCP, TBT, and CLS metrics up against the stats from September 2021, when the update was complete.
To make the comparison, we checked how many pages were within the three category ranges — “good,” “poor,” “to improve” — for each metric before and after the update.
Good
Needs Improvement
Poor
LCP
≤ 2.5s
≤ 4s
> 4s
TBT
< 300ms
≥ 300ms ≤ 600ms
> 600ms
CLS
≤ 0.1
≤ 0.25
> 0.25
We also mention “Any TBT” and “Any CLS” scores. These simply reflect averaging metrics for all URLs without regard to their TBT or CLS performance.
To pinpoint factors that affect each metric and to see what errors come up more often than others, we took Site Audit’s September 2021 audit of 4M desktop and 1.7M mobile URLs. Overall, the tool passed these pages through 23 different CWV-specific checks.** which allowed us to reveal the most difficult and easy-to-pass audits.
The entire study is based on lab data.
**Note: You can find a list of all the checks, their definitions, and a full mobile-desktop breakdown of the audit at the very end of the post.
Core Web Vitals Study Findings for Mobile & Desktop
How Many URLs Upped Their LCP, TBT, and CLS Scores
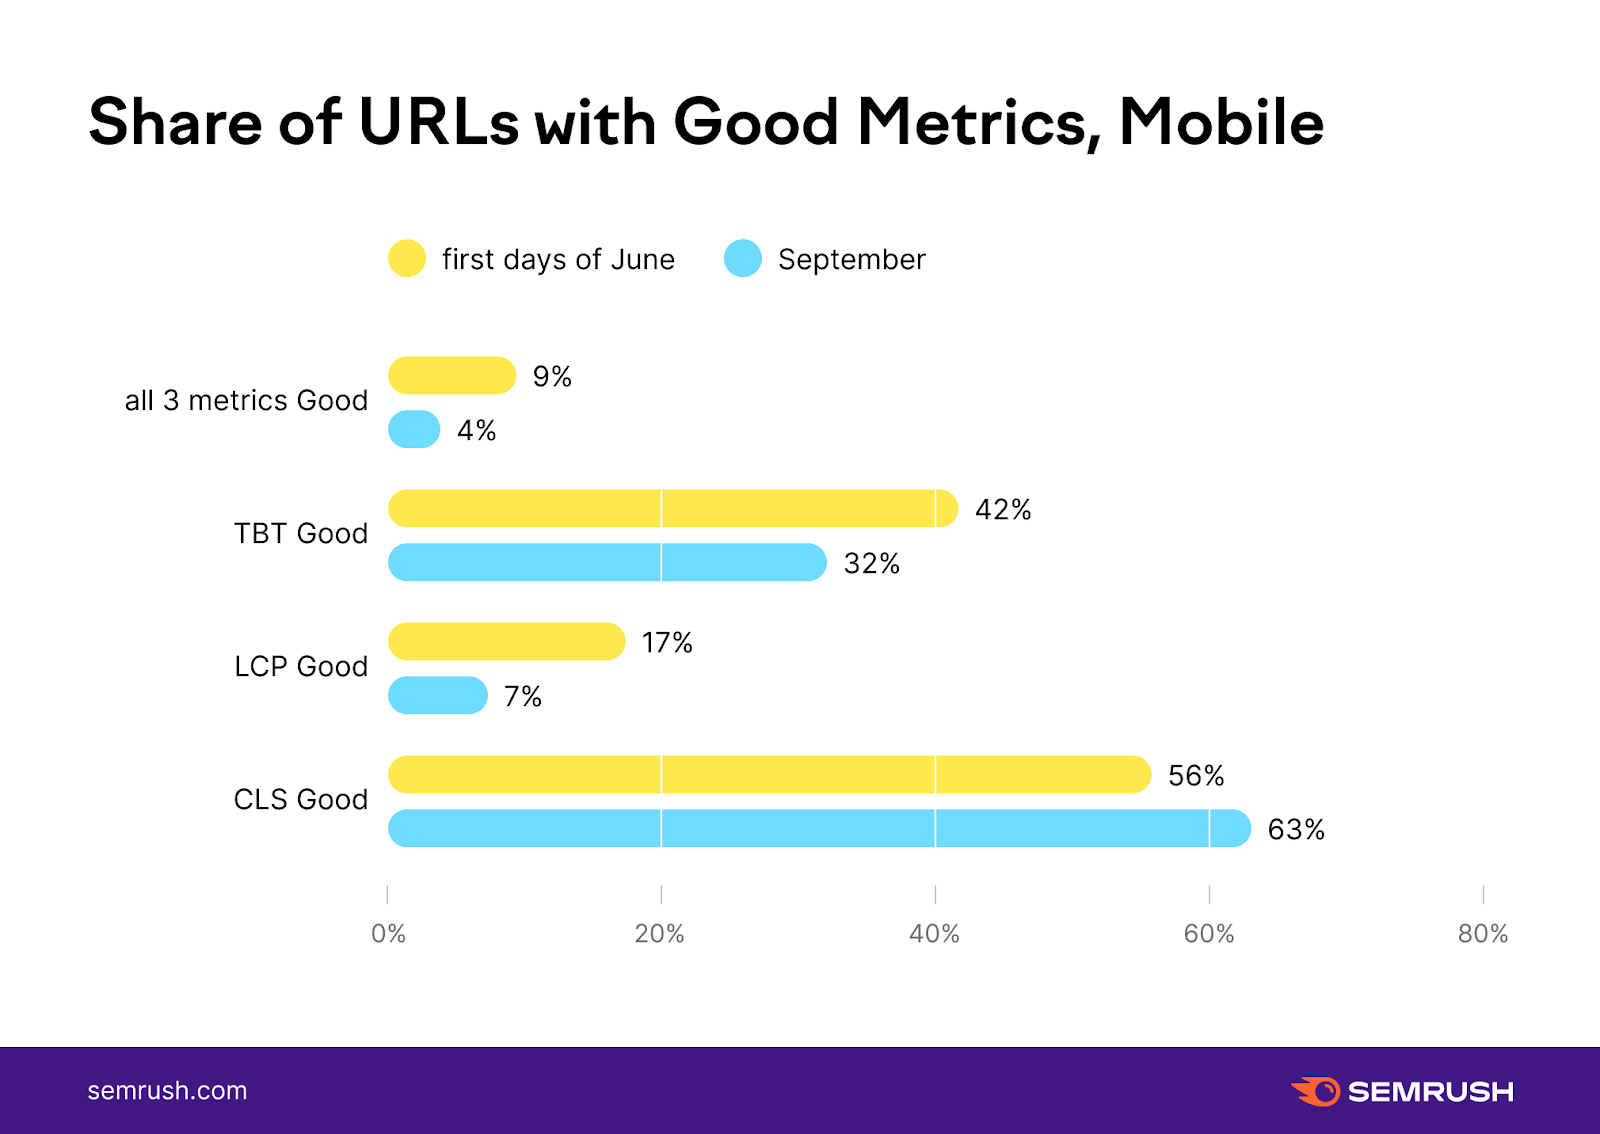
The graphs below show how many pages — mobile and desktop — actually passed the good thresholds for the three CWV metrics (combined and individual) as of June 2021 vs. September 2021.
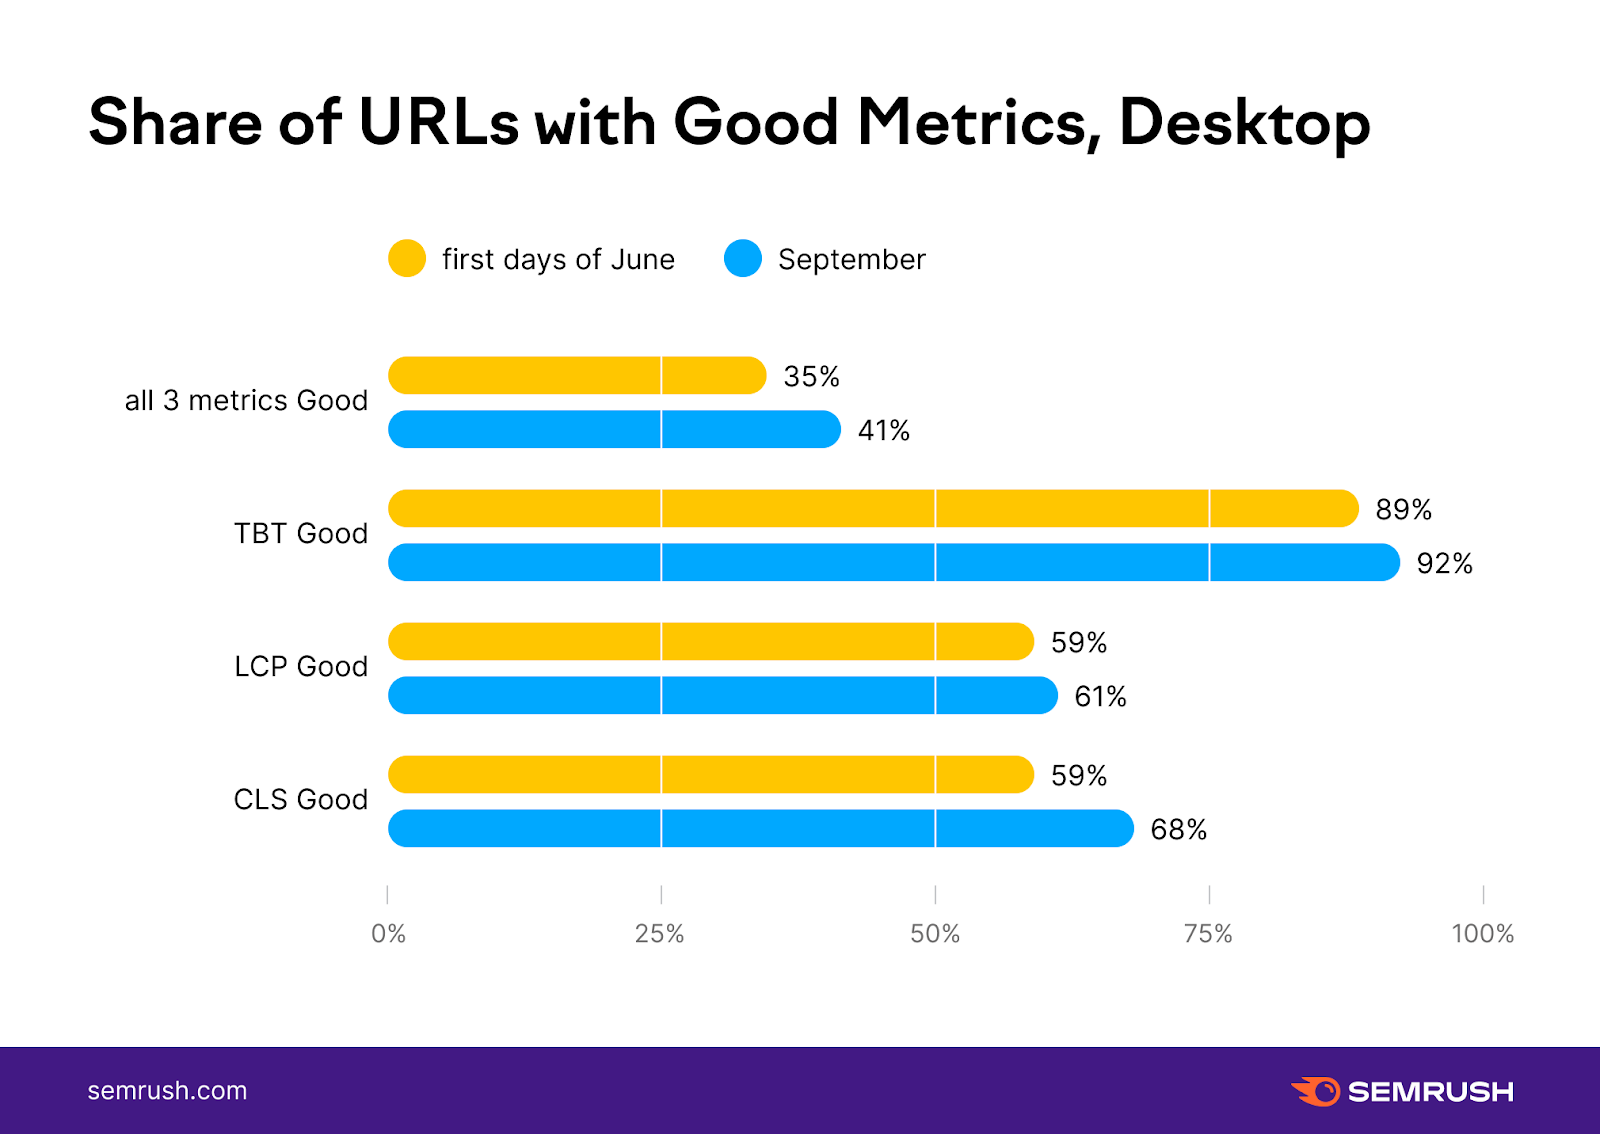
Before the update, only 34.5% of desktop pages could meet the required thresholds for all three metrics. Post-update, the number of desktop URLs that come with all “good” scores for LCP, TBT, and CLS increased by 7 percentage points.
Mobile URLs show a grimmer picture, with less than 4% of mobile pages passing the “good” thresholds for all three metrics. Back in June 2021, this number was almost three times higher, implying that mobile pages were less update-ready than their desktop counterparts.
Assessing Positive Shifts for CWV Metrics Pre- and Post-Update
CWV metrics have more layers than a mere “good” score, though. LCP, TBT, and CLS can fall into three categories: “Good,” “To improve,” and “Poor”.
To analyze the post-update changes on a more granular level, we checked all the improvements that occurred across the three metrics, exploring how many URLs made some wins, moving their LCP, TBT, and CLS scores from category to category.
When it comes to positive shifts for pre- and post-update scores, we see the following trends:
Mobile URLs
TOTAL (any improving shift between thresholds)
To improve -> Good
Poor -> Good
Poor -> To improve
share of URLs that improved (all 3 metrics)
0.1%
0.01%
0.07%
0.02%
share of URLs that improved (TBT only)
14%
5%
3%
6%
share of URLs that improved (CLS only)
19%
8%
7%
4%
share of URLs that improved (LCP only)
7%
1%
1%
5%
share of URLs that improved (at least 1 metric)
38%
14%
10%
14%
Desktop URLs
TOTAL (any improving shift between thresholds)
To improve → Good
Poor → Good
Poor → To improve
share of URLs that improved (all 3 metrics)
0.09%
0.05%
0.03%
0.01%
share of URLs that improved (TBT only)
7%
4%
1%
1%
share of URLs that improved (CLS only)
21%
9%
7%
5%
share of URLs that improved (LCP only)
14%
9%
2%
4%
share of URLs that improved (at least 1 metric)
39%
21%
10%
9%
We saw a very low — up to 0.1% — number of pages that improved all the scores across the board. However, a third of all pages saw score improvements for at least one metric. This is true for both mobile and desktop URLs. On mobile, the most popular category change for all the three metrics was from the “poor” to the “to improve” range. Desktop URLs show more positive trends as the majority of URLs’ LCP, TBT, and CLS scores moved from the “to improve” to “good” category. On mobile, the jump from “poor” to “good” seems almost like mission impossible, with only one exception. CLS appears to have the easiest threshold to pass from “poor” to “good” directly, and more pages made significant improvements to their CLS scores.We collected our insights after Google lowered the CLS threshold, so the apparent ease is probably linked to this change.
Mobile pages face the least positive shifts when it comes to LCP, while for desktop URLs, TBT appears to cause the biggest challenges, showing the lowest — 6.7% — positive change trend.Factors that Impact LCP, TBT, and CLS Scores
Analyzing each metric’s elements in more detail, we managed to pinpoint factors that affect those scores.
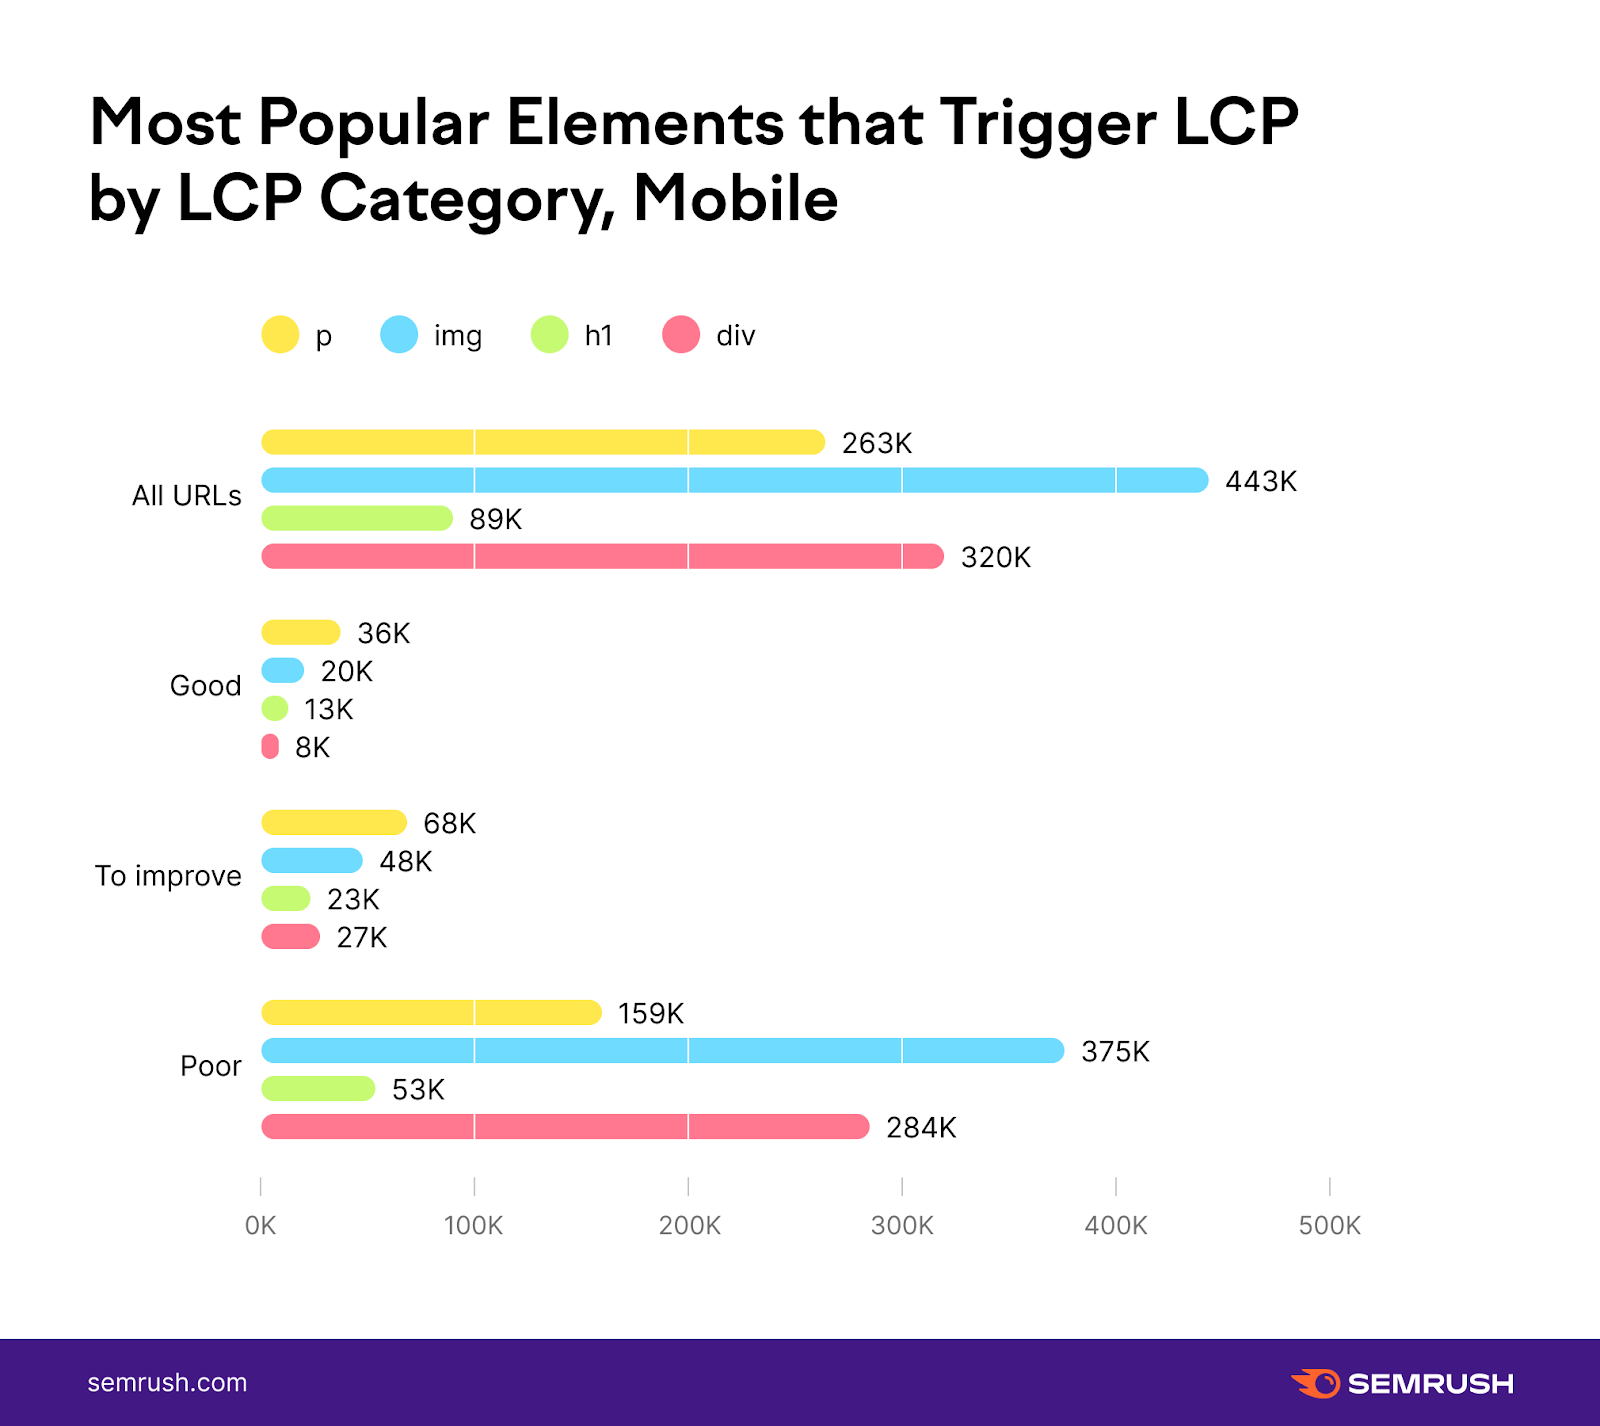
What Causes Poor LCP Scores
As LCP measures the load time of the largest page element — image or text block — within the user’s viewport, anything that extends beyond the screen does not count.
Therefore, we looked at which of the following elements are present/absent from the analyzed pages:
<img> tags are images, video poster images, background images, etc; <div> / <section> tags imply any element (container) on the page; <p> tag is a paragraph (text); <span> tag usually points to some kind of text element; and <h1> / <h2> / <h3> tags are used to indicate various page headers and subheaders.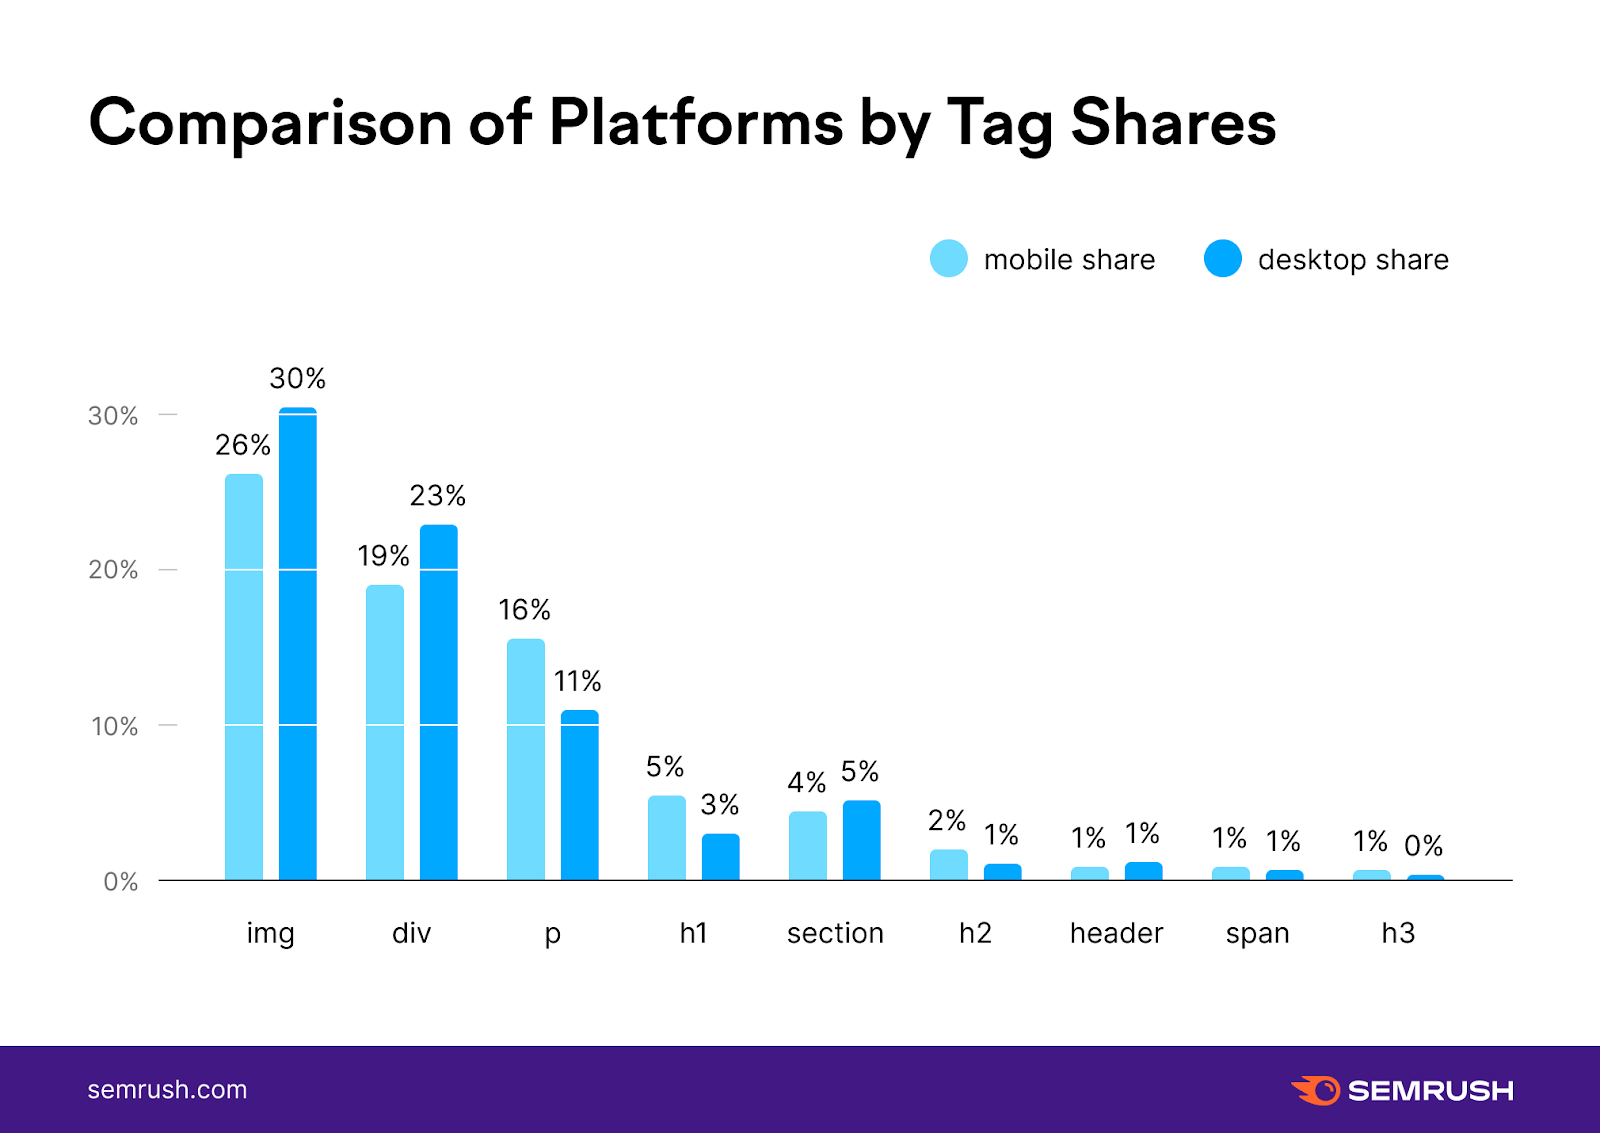
Our analysis showed that <img> and <div> tags are the most common elements that cause LCP slowness.
If we take a closer look, though, we’ll see more differences between mobile-desktop tag elements that affect LCP scores.
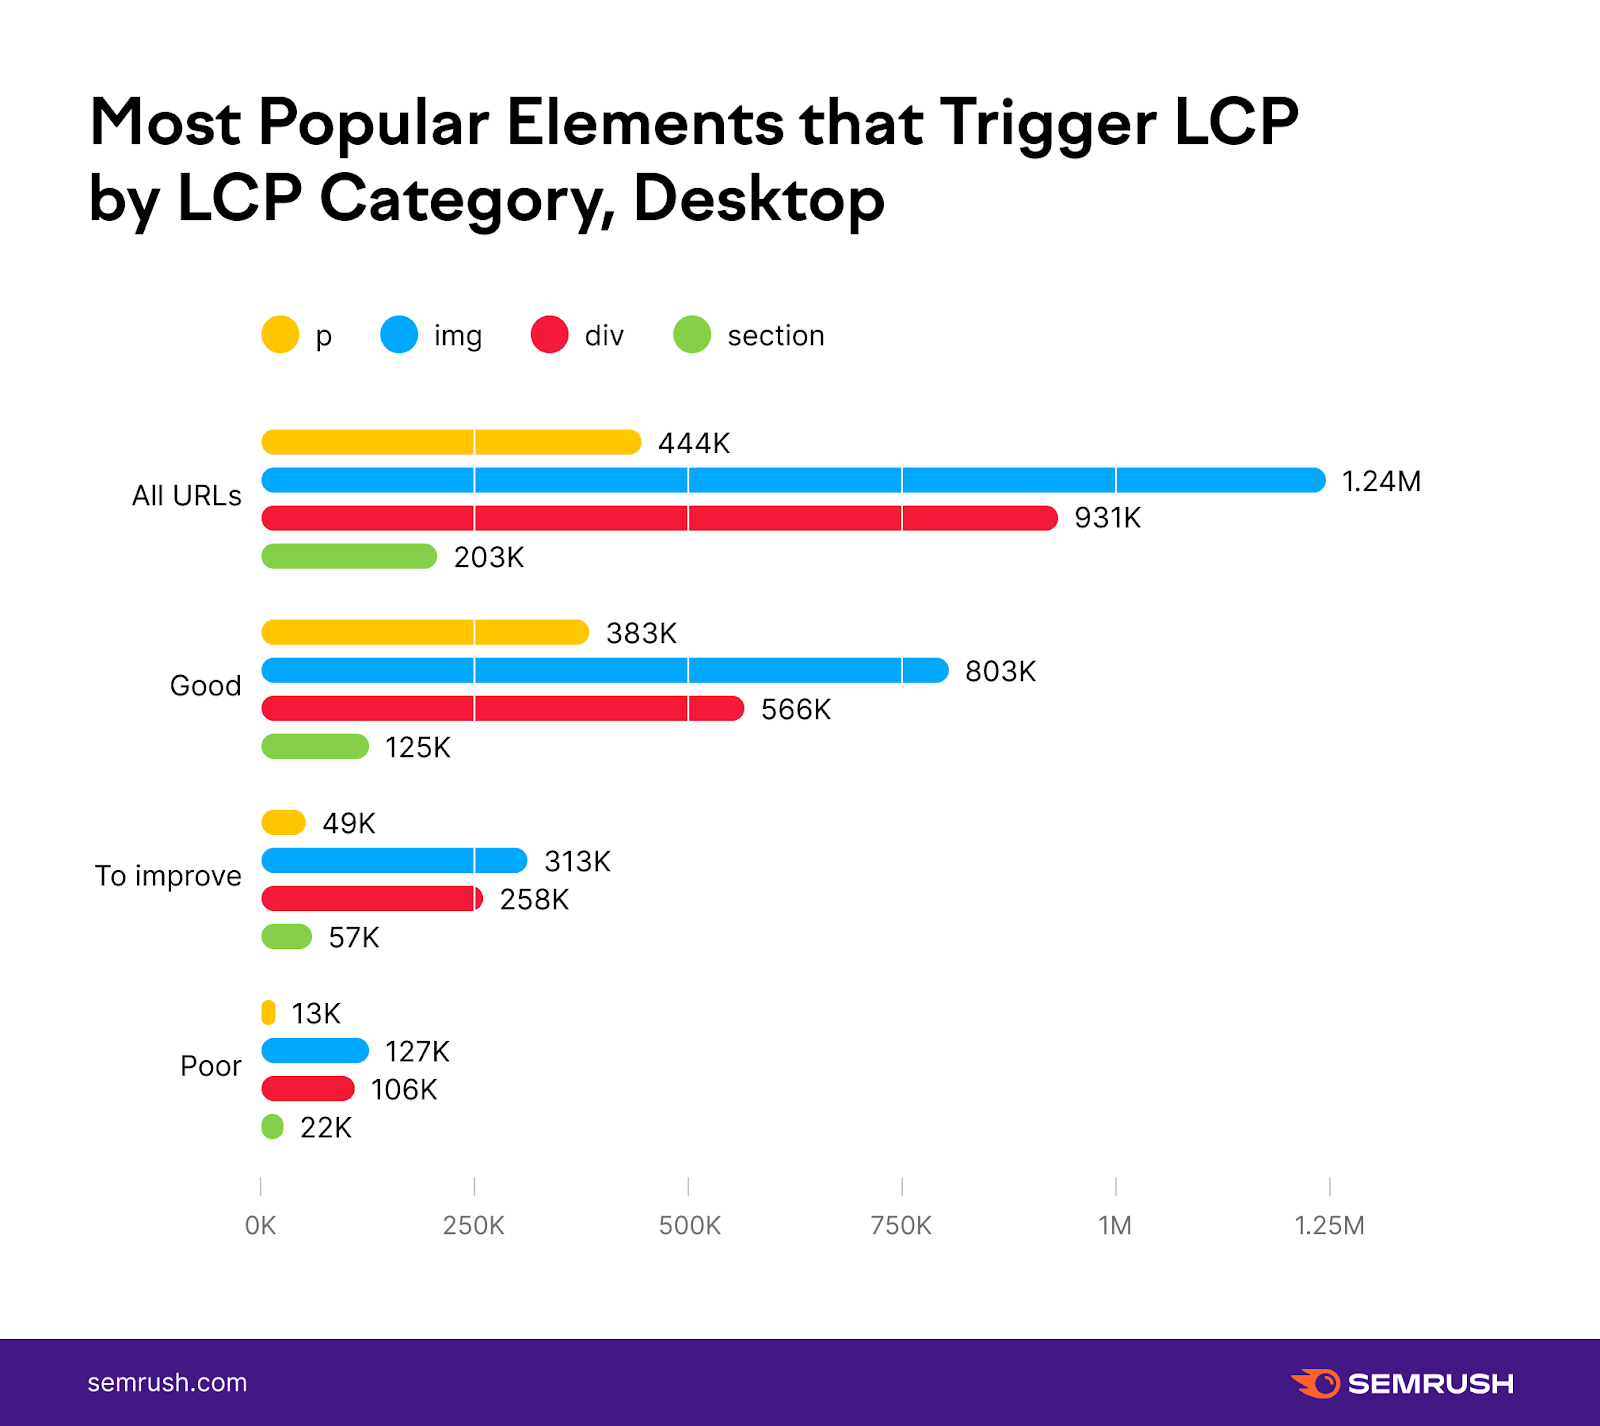 <img> and <div> tagsare mostly an issue for mobile URLs that are within a ”poor” LCP range. Mobile pages that have LCP within the “good” and “to improve” range are mostly affected by <p> and <img> tags. H1 starts to be an issue on mobile, probably because h1’s are one of the largest elements in viewport when we deal with smaller screens.
 This means that there is a difference between what’s considered to be the largest element on mobile vs. desktop.
You can use the Site Audit tool to unwrap which specific page element is considered the largest contentful element within the viewport in your particular case.
What Affects TBT Scores
As TBT measures how quickly users can start interacting with elements of the page, we had to look at the long tasks.
With long tasks being part of a JavaScript code that freezes the UI, to get a “good” TBT score, you have to keep your overall TBT under 300 ms.
While you can have as many long tasks as you want (as long as they don’t exceed the 300 ms threshold), it’s still interesting to see that both mobile and desktop pages that have a “good” TBT score come with the lowest number of long tasks:
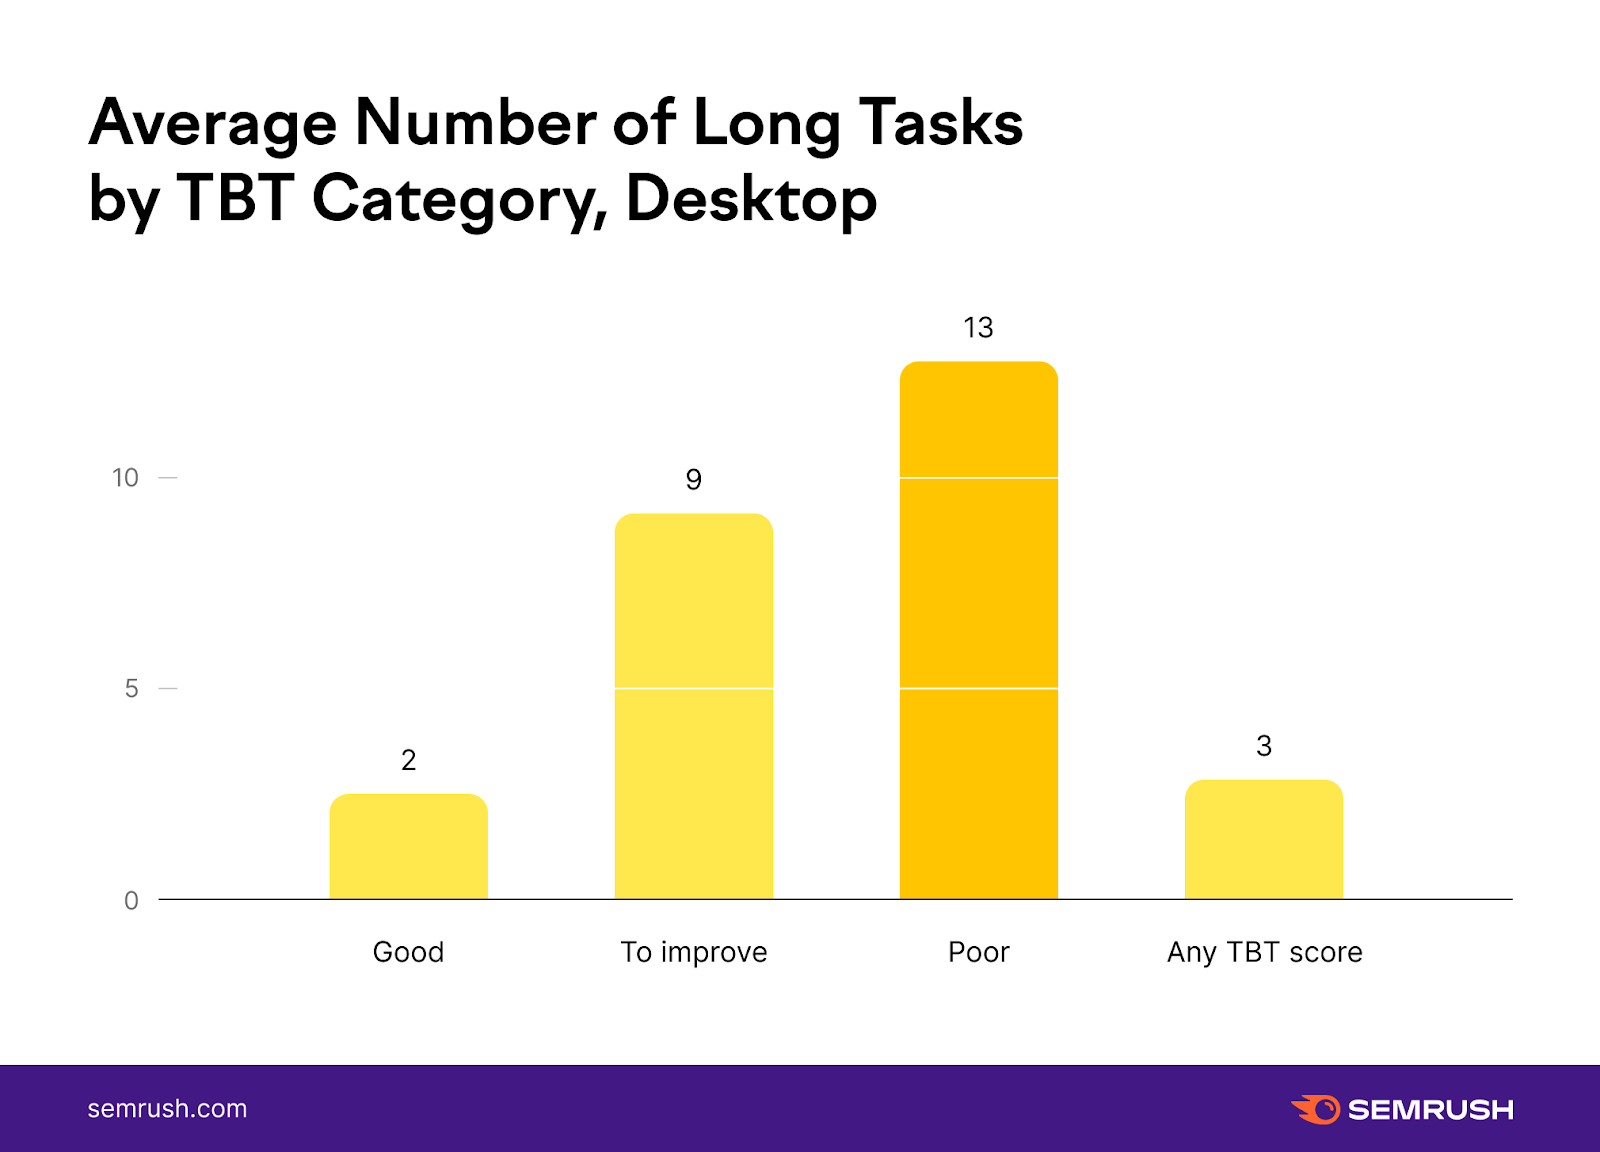
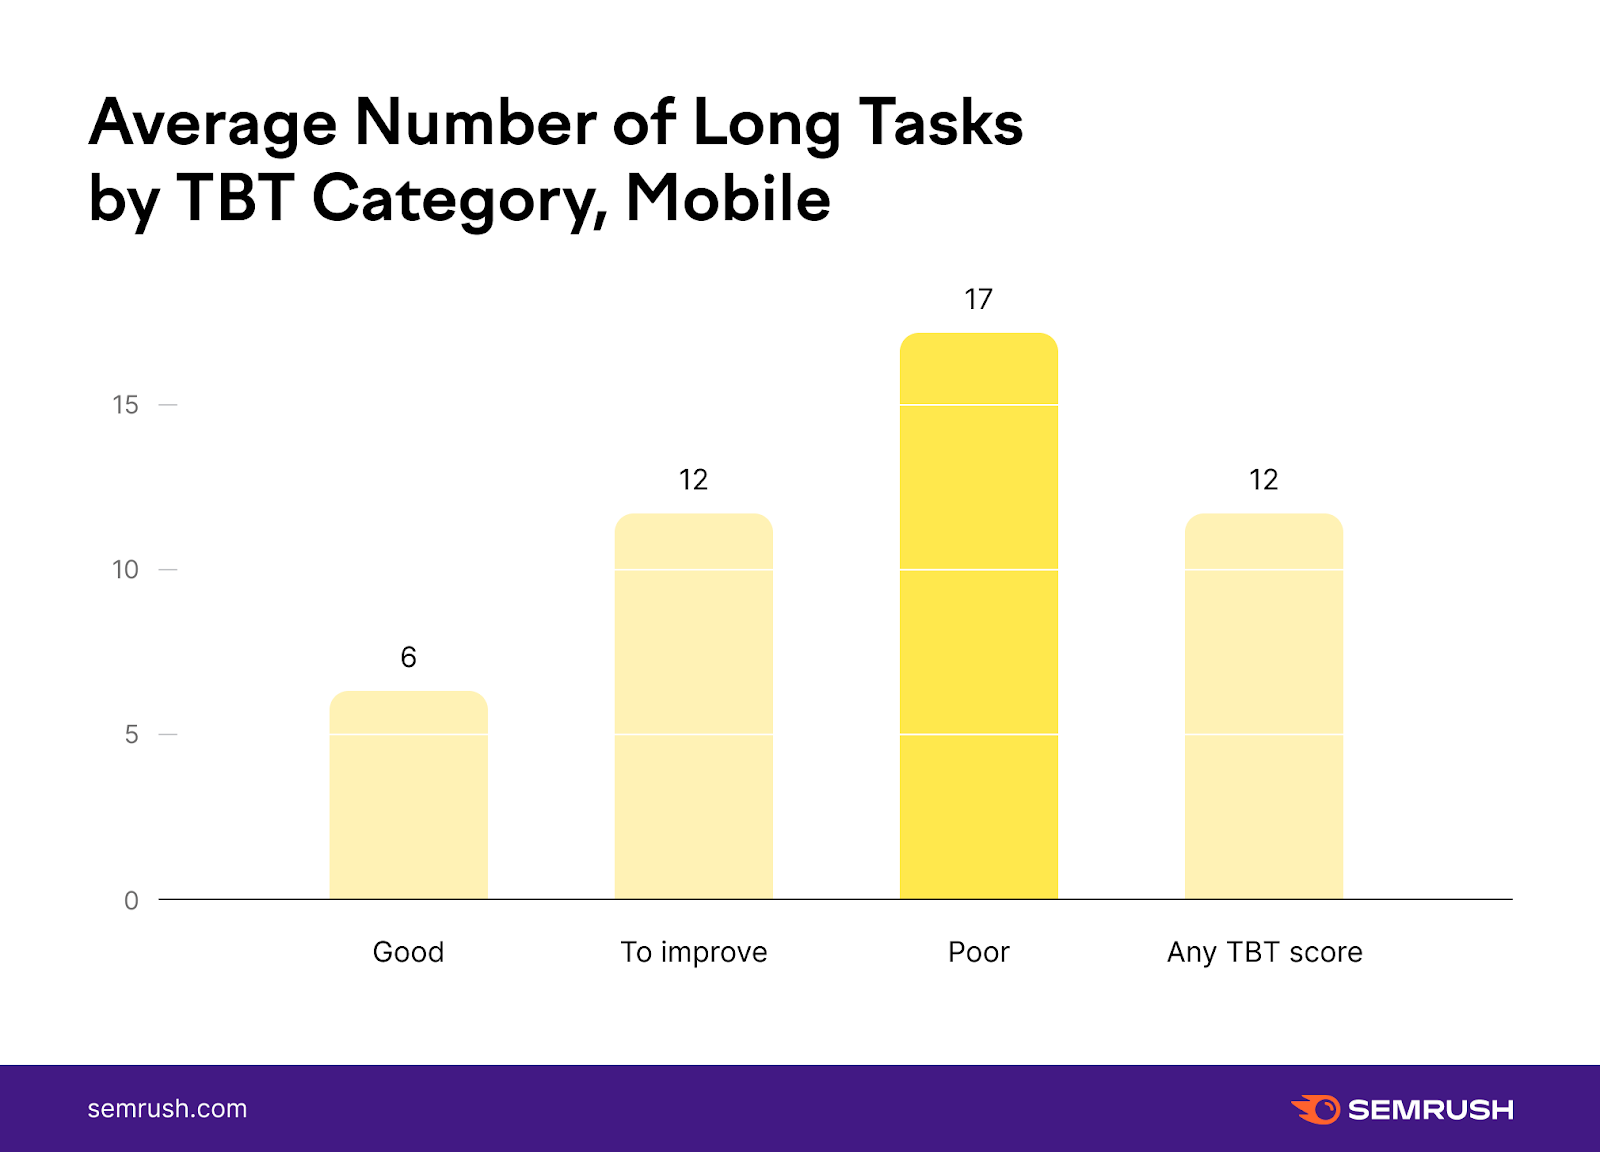
On average, a desktop page with a “poor” TBT score has 6X more long tasks compared to the ones that fall within the “good” range. On mobile, this difference is more modest — it’s threefold.
What Affects CLS Scores
The CLS metric that measures the visual stability of the page heavily depends on layout shifts that appear whenever there is a position change for a visible element from one rendered frame to the next.
As with TBT, layout shifts are all about the extent rather than the number of those shifts. And if we didn’t see direct proof for this with TBT, our CLS analysis makes this obvious:
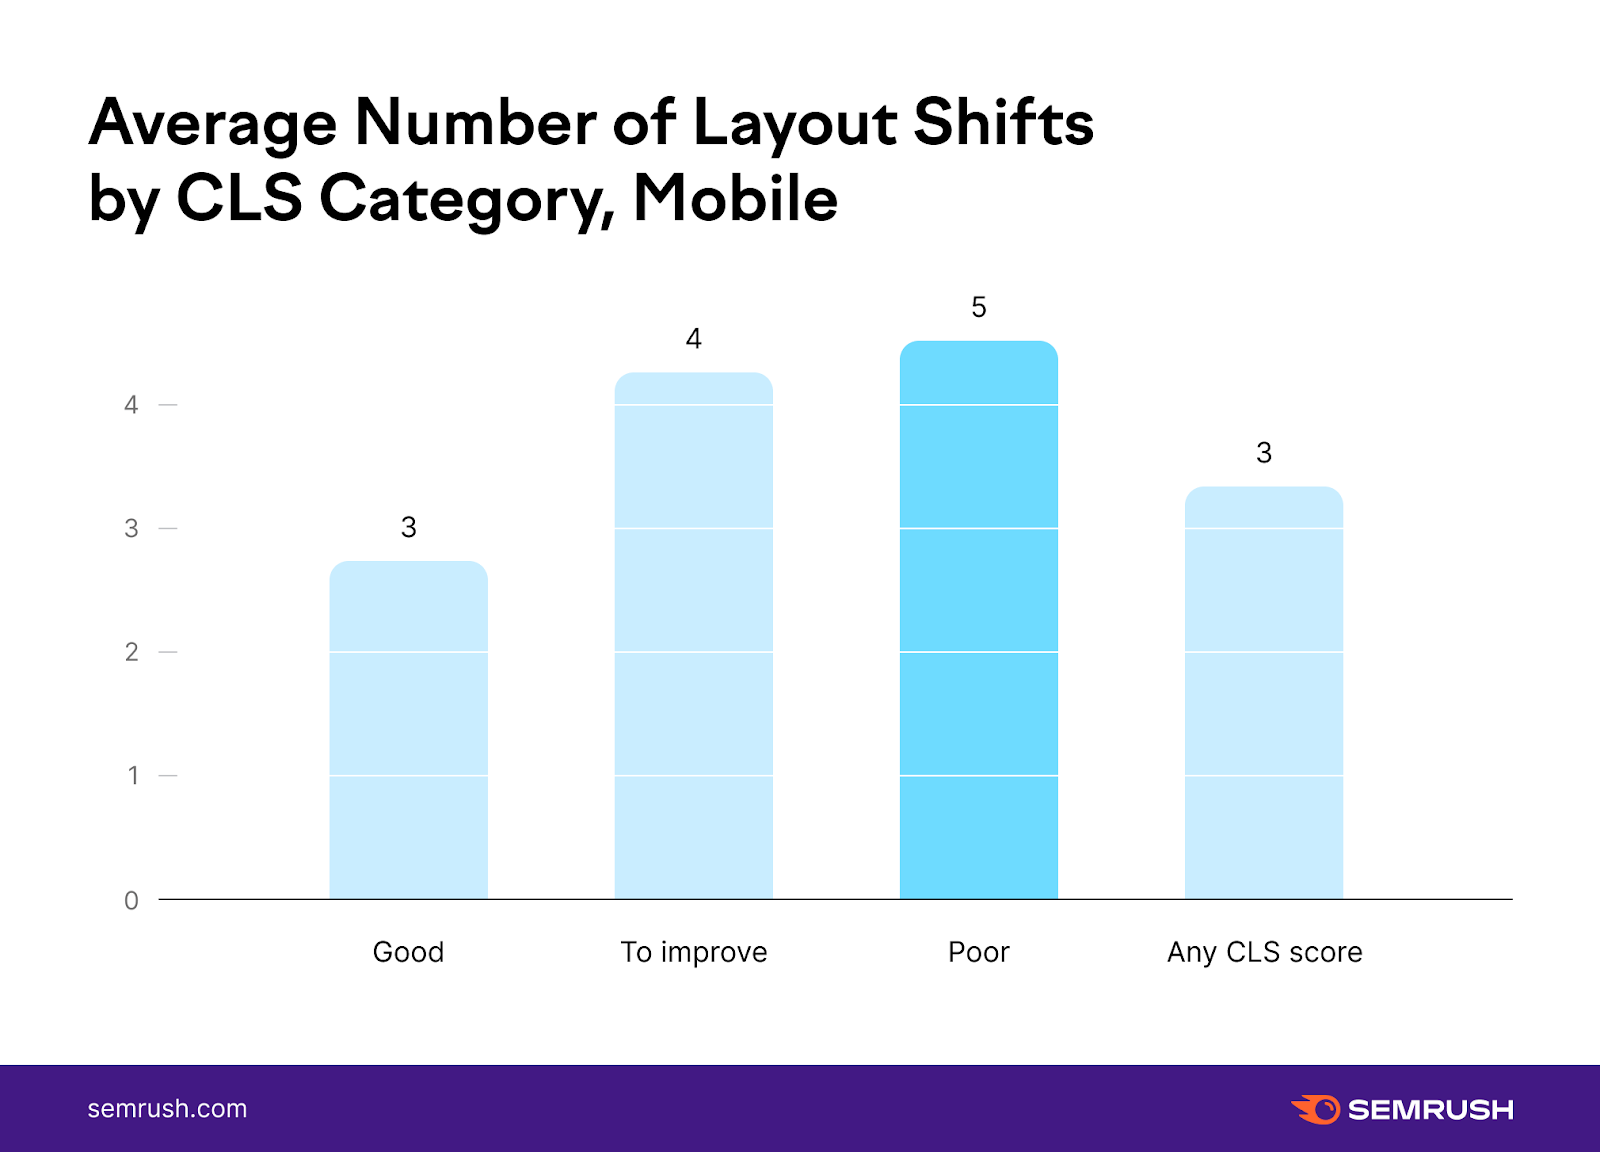
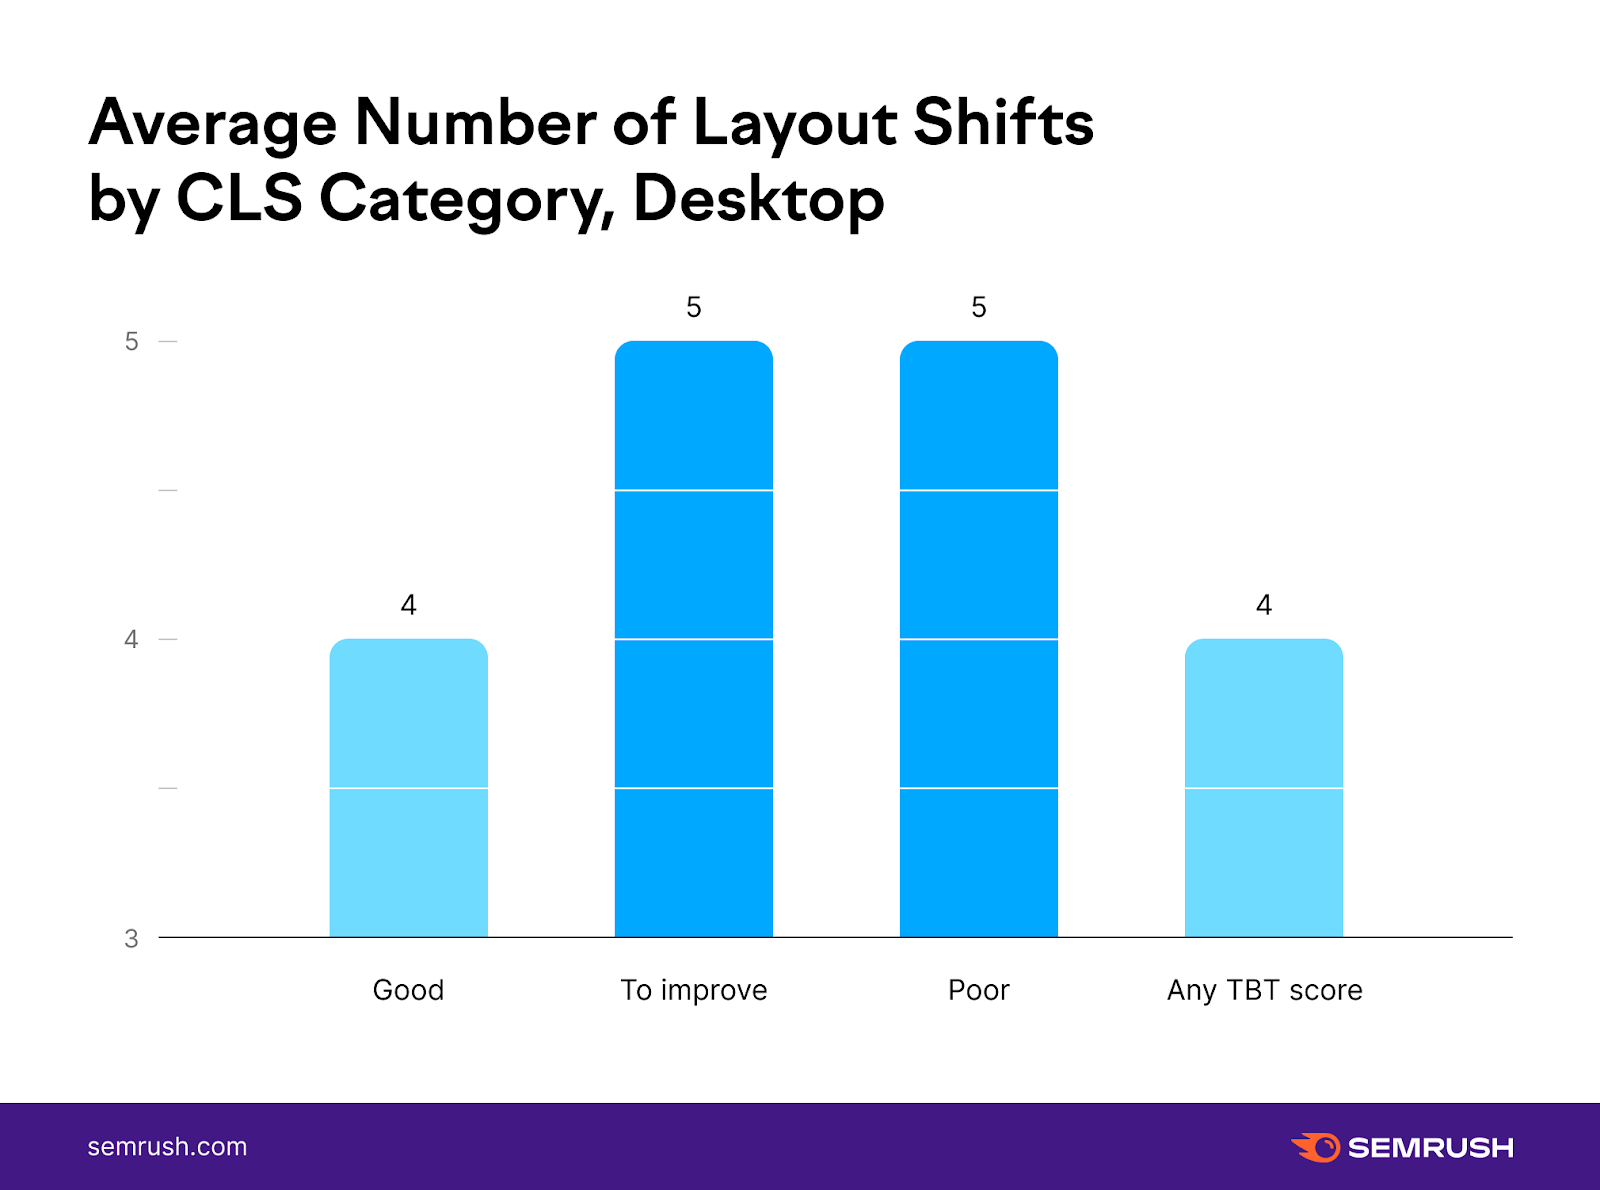
We don’t see a big difference in the number of layout shifts between pages with various CLS scores, which means that you can afford to have quite a few shifts as long as they meet the thresholds.
The Most Common Core Web Vitals Issues and How to Fix Them
While we’ve pinpointed the top factors that affect pages’ CWV scores, that doesn’t mean that these can be considered the most pressing issues for site owners.
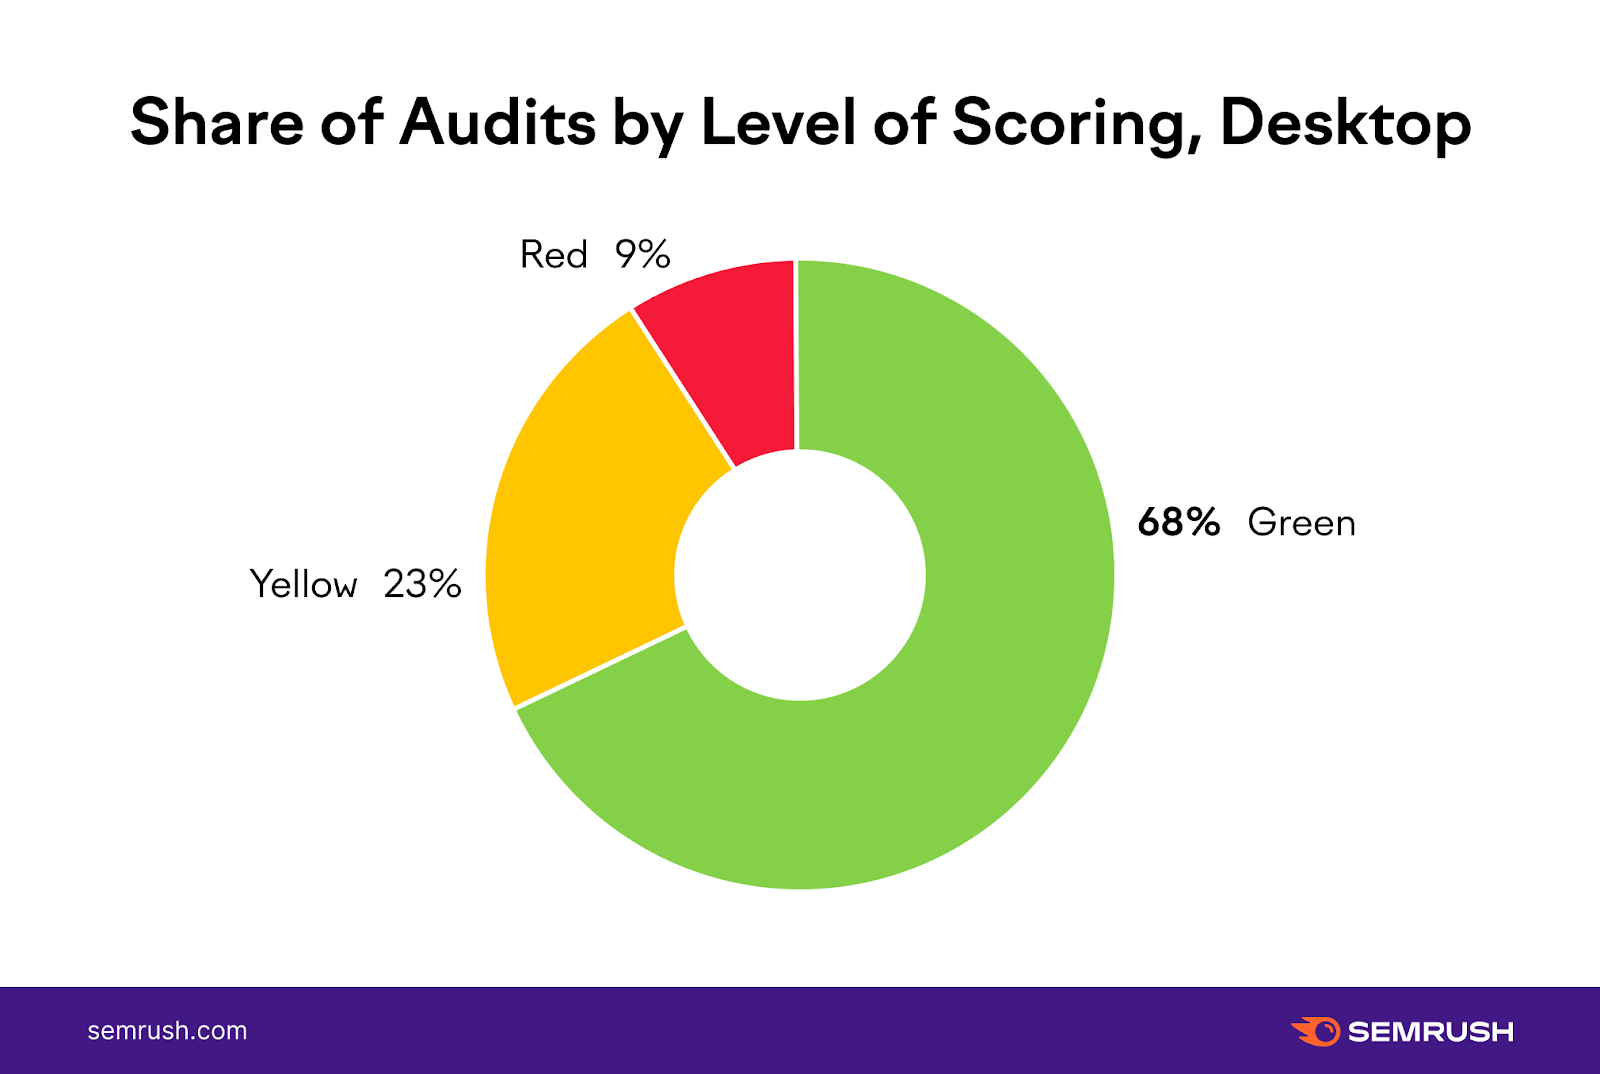
This is where Site Audit’s Core Web Vitals report enters the game and helps to identify the most difficult checks to pass.
The Site Audit tool passes any page through 23 various checks where we take Pagespeed Insights logic and consider:
If the check hits over the 90 mark, the page goes in the green zone, and we consider this audit as passed; The 50-89 mark gets the page into the yellow zone; and If the value is less than 49, the page moves into the red zone for a given check.From a bird’s-eye view, we can see that mobile pages face a much higher number of issues with CWV. Desktop URLs seem to be doing a pretty good job at passing CWV checks, with the majority — 68% — of checks in the green spot.
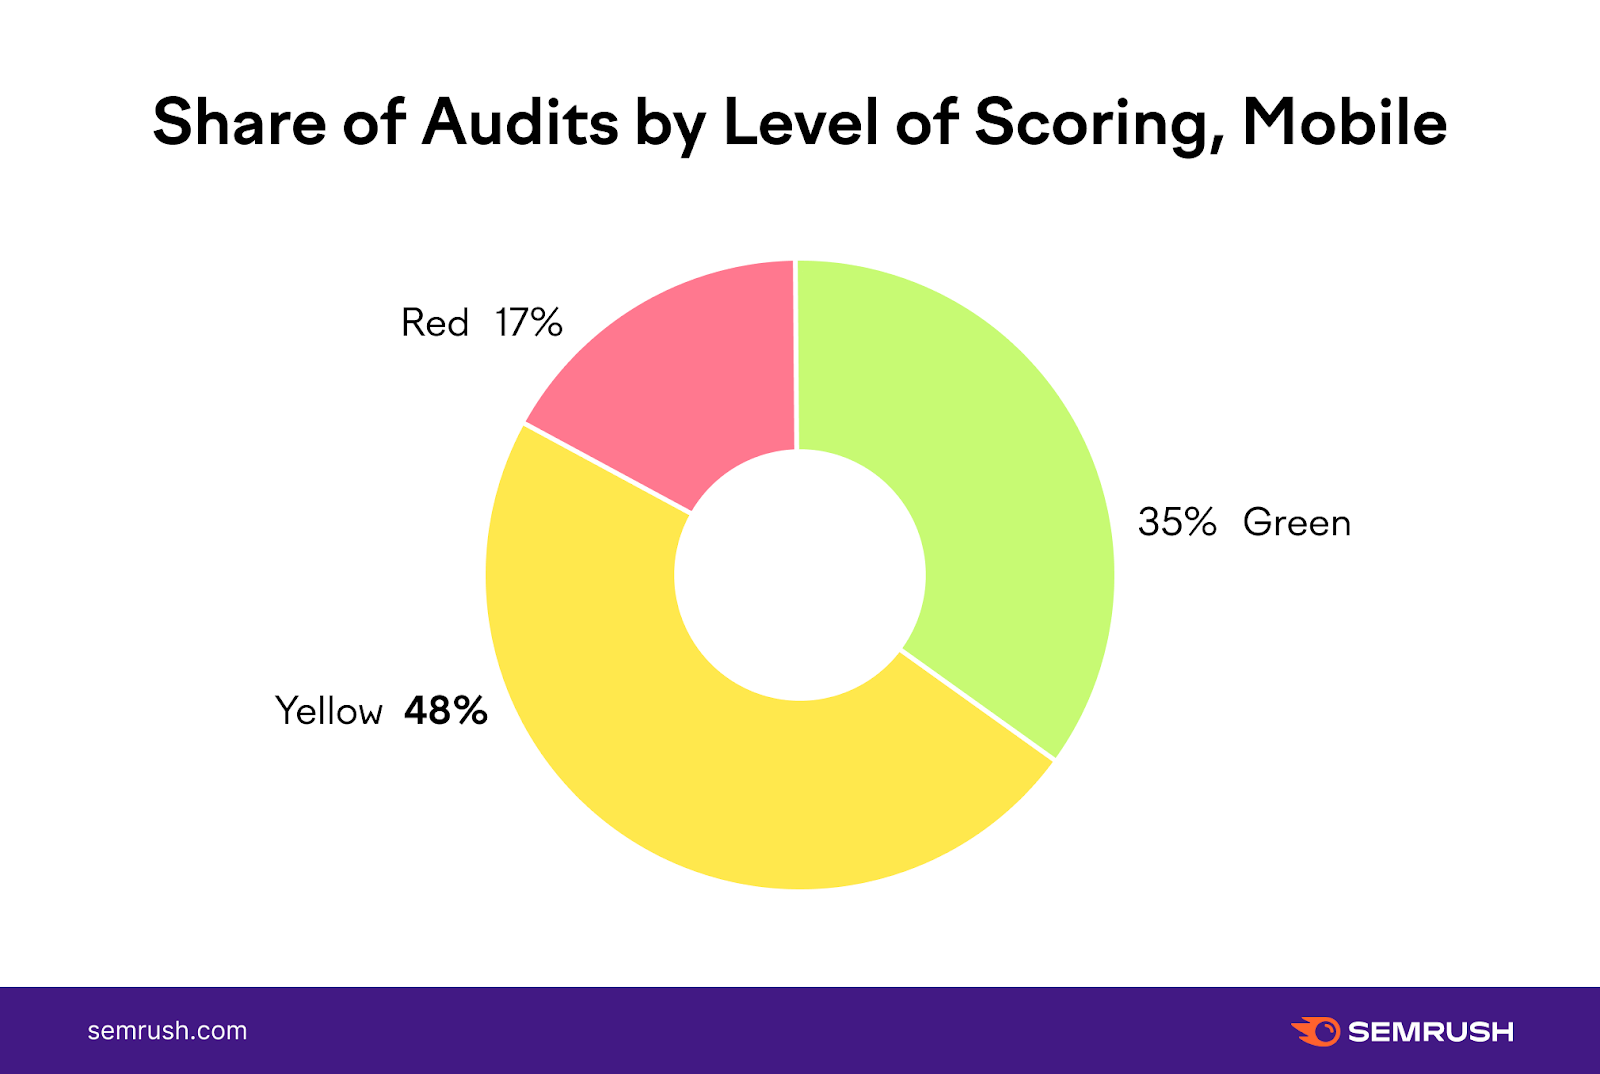
Unlike desktop, where pages passed the majority of checks, on mobile, only 34% of checks are green. A worrying 65% of all audits are either yellow or red, which means that mobile pages do not meet the CWV requirements for these checks.
Let’s take a more nuanced look at all the checks and see the top three easiest and hardest ones to pass for both mobile and desktop pages.
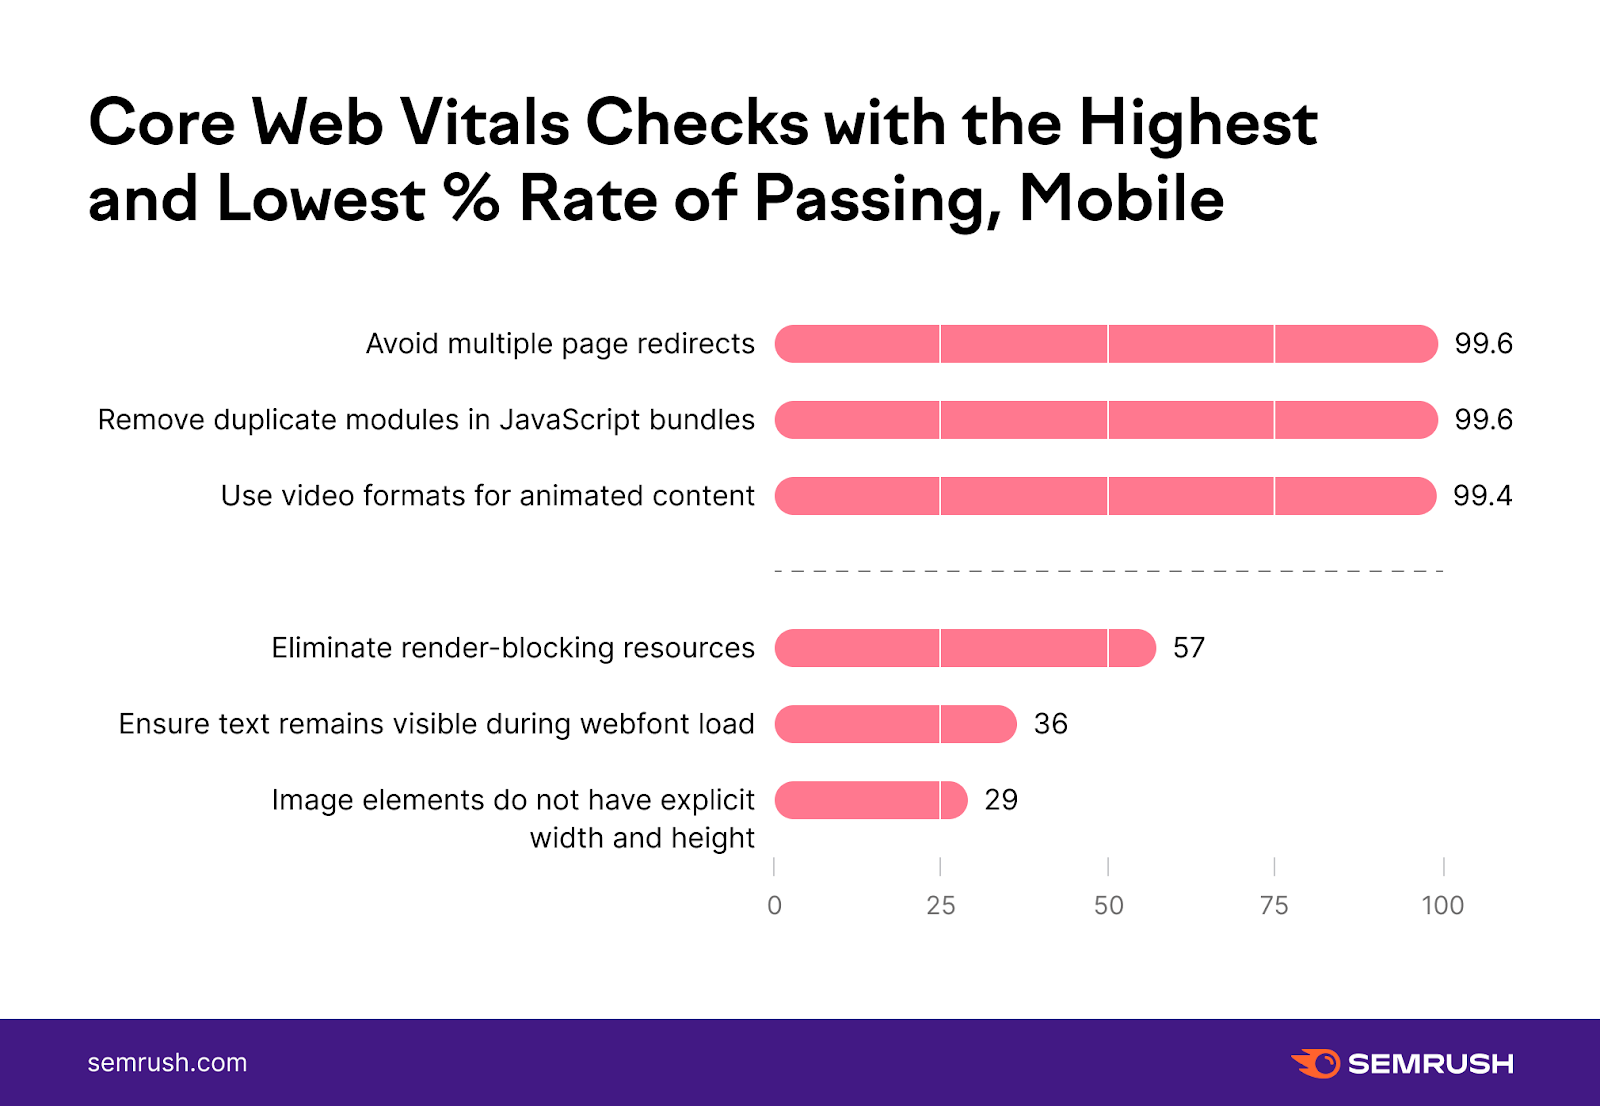
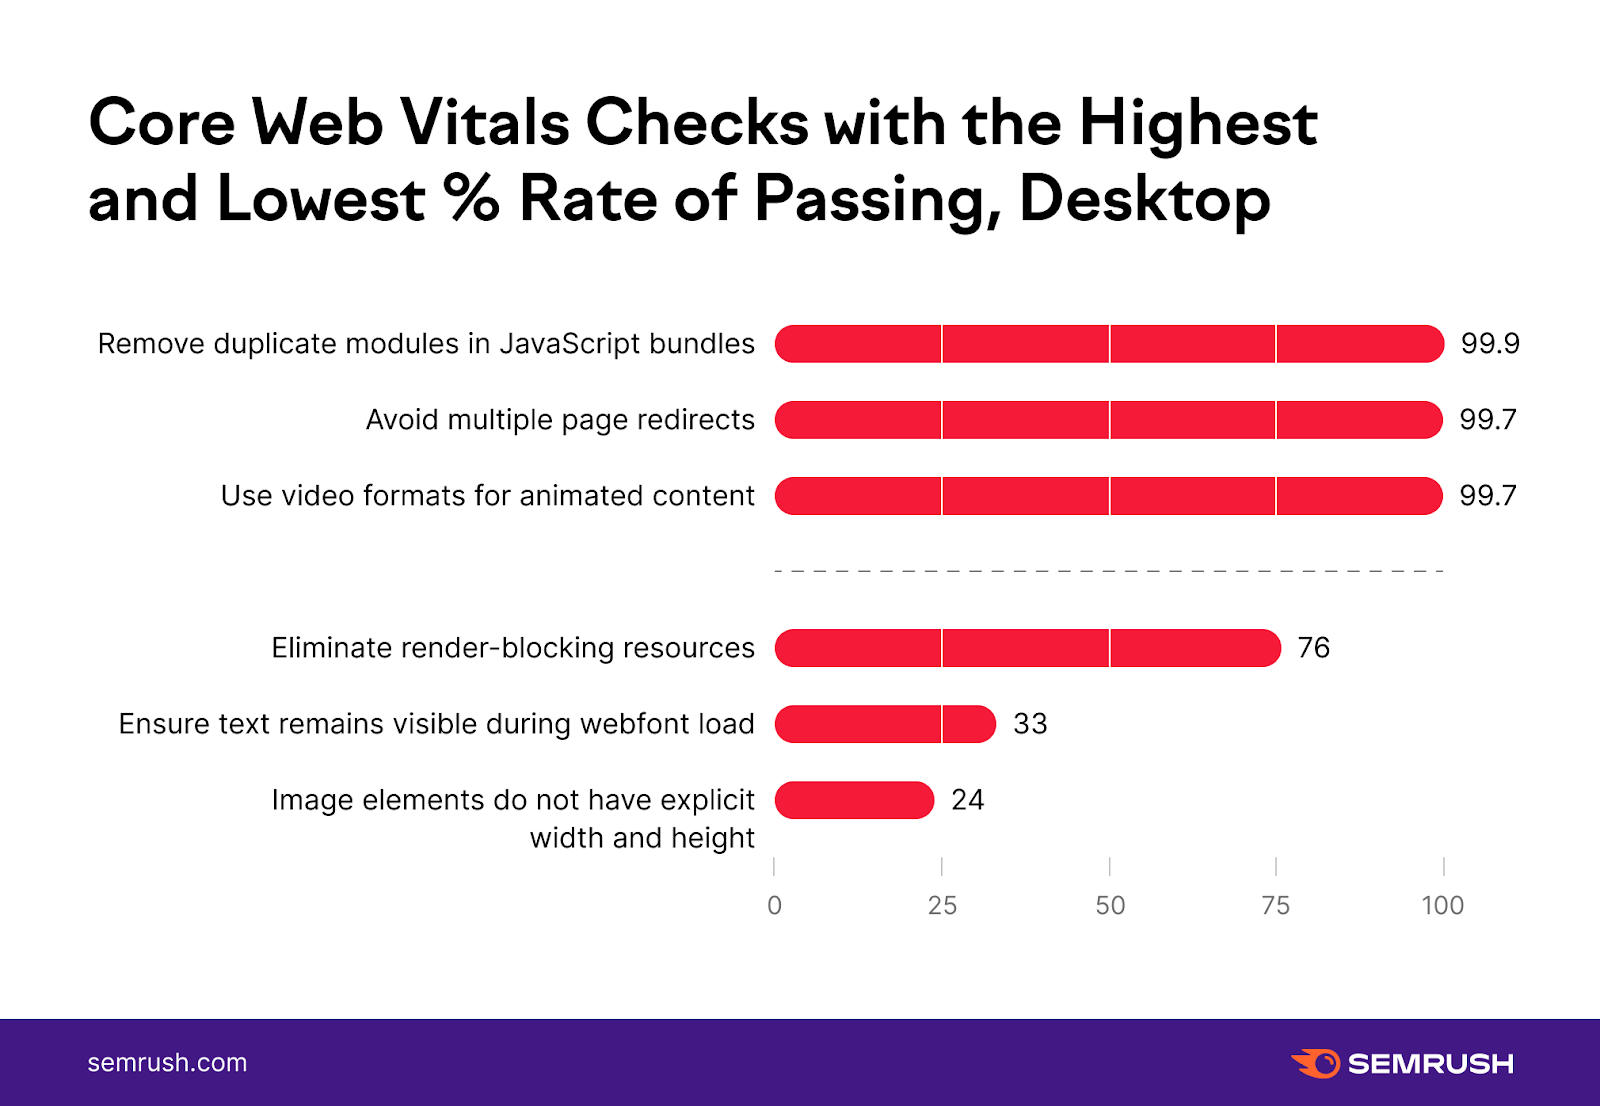
The tops look almost the same — be it desktop or mobile URLs:
Image elements that do not have explicit width and height appear to be the biggest problem for both mobile and desktop pages. Duplicate modules in JavaScript bundles, multiple page redirects, and usage of video formats for efficient animated content are typically passed with little to no issues. Yet when it comes to eliminating render-blocking resources, the difference is striking: desktop USLs almost pass this check, while mobile ones barely make it to the yellow zone.Site Audit does not only spot problems across all the metrics, but it also separates them into LCP, CLS, and TBT-related issues.
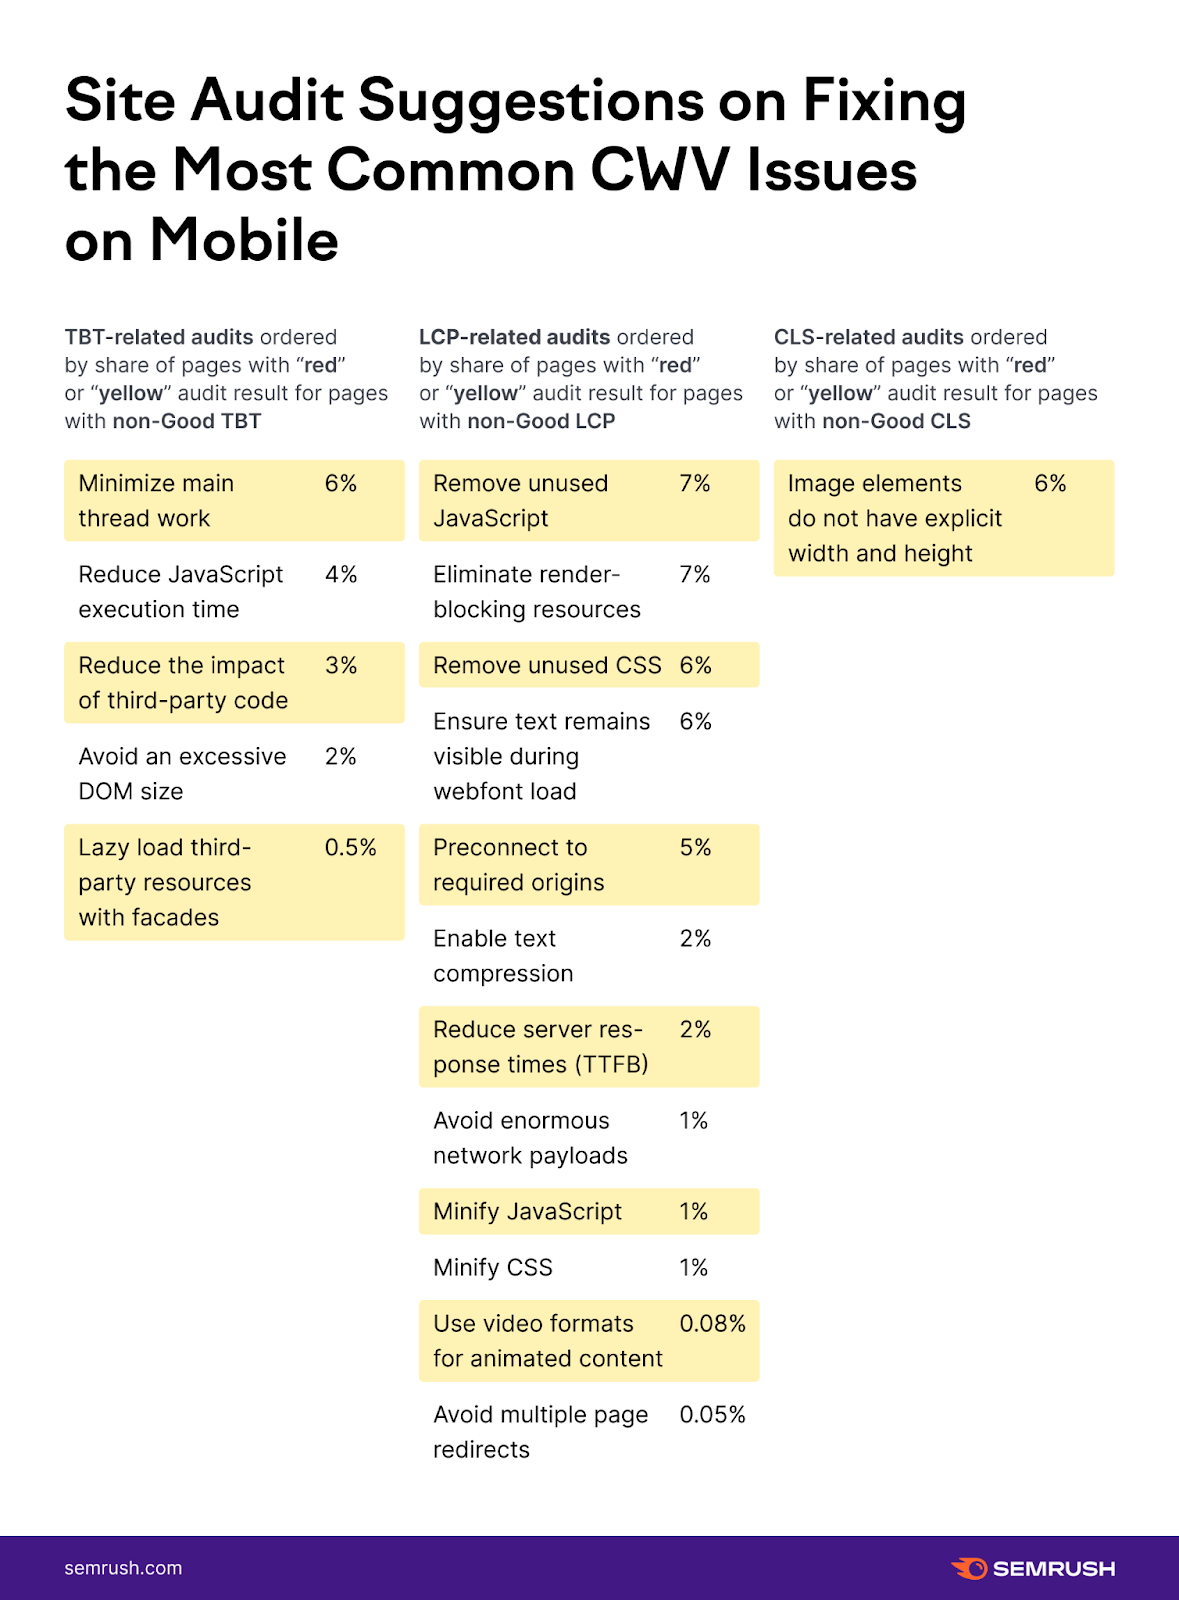
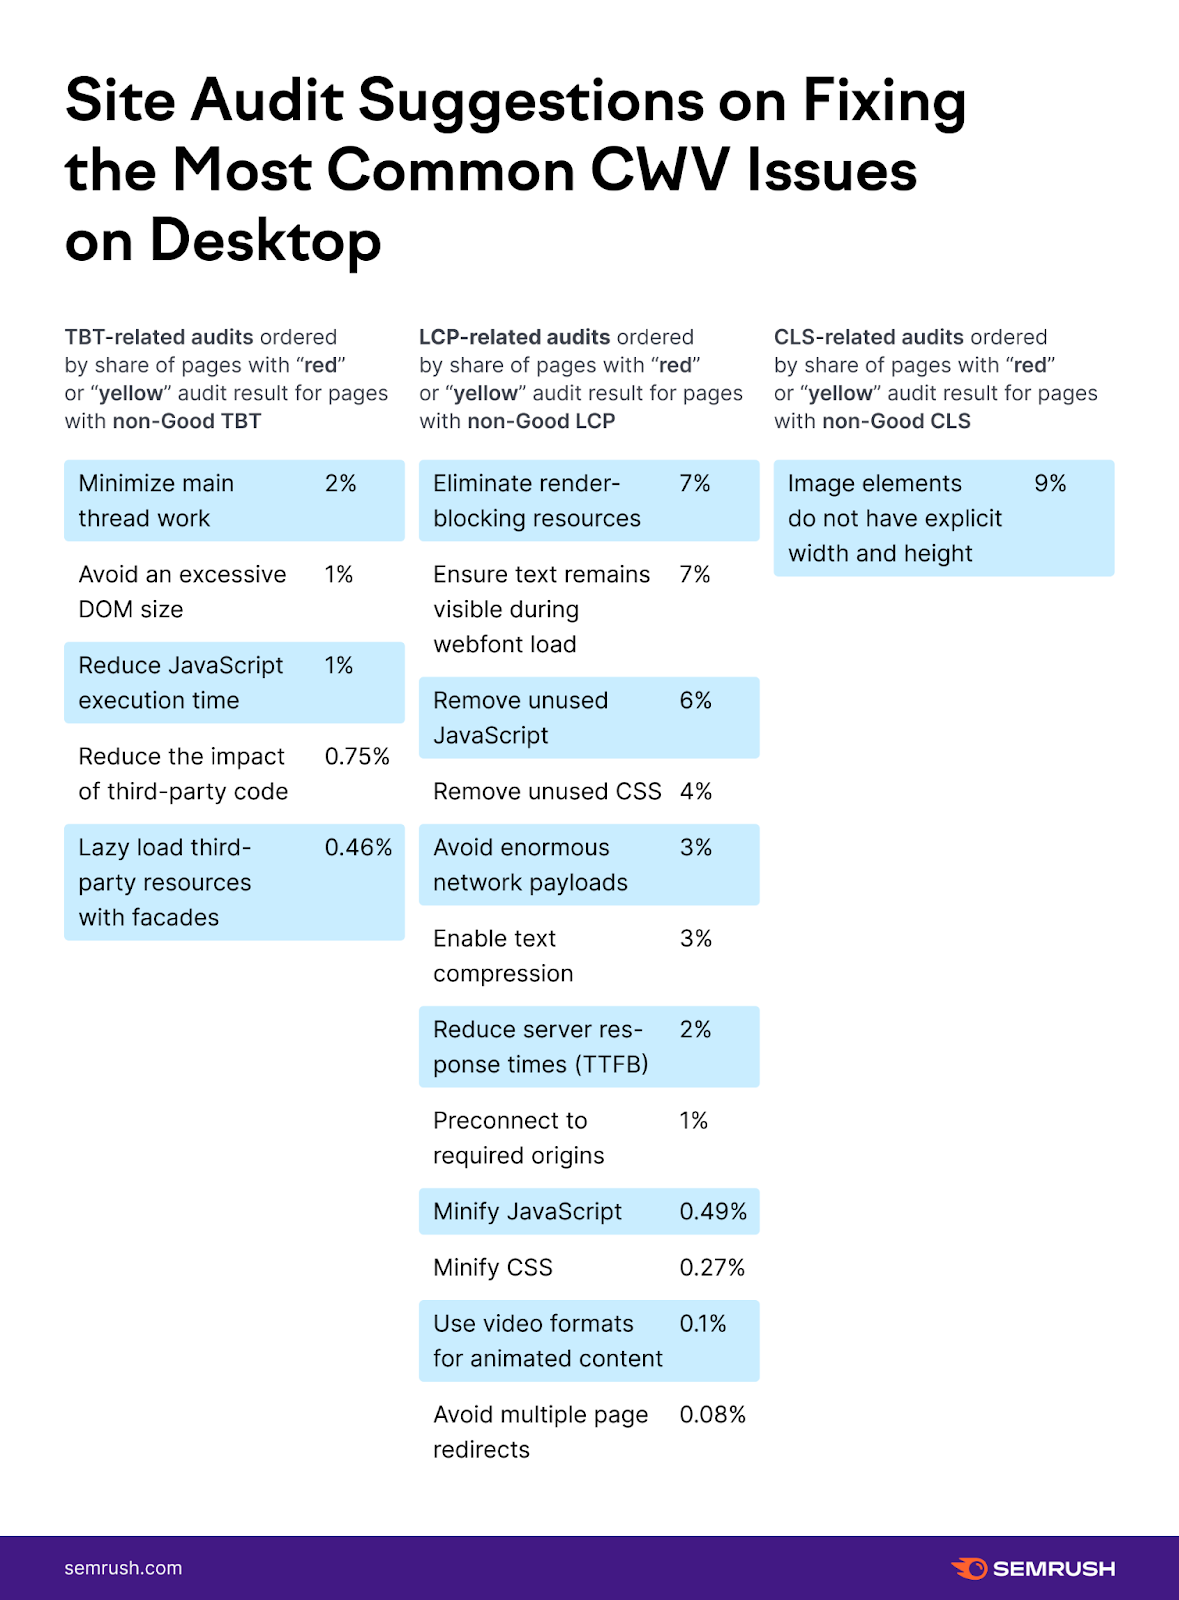
Make sure to go through the metric-by-metric breakdown of the most common problems for your particular pages, as Site Audit actually shapes the problem in a way that includes the solution.
Summing Up
With the Core Web Vitals Update already here, you have no choice but to improve your score for all three metrics — CLS, LCP, and TBT — to show Google that your pages provide the ultimate user-friendliness and deserve those rankings.
We hope that our study, which covered a lot of ground and revealed key insights, provides clear guidance to support your optimization efforts further.
While we suggest that you take another look at all the discoveries, there are a few things that you should take away from this study:
The web is not yet fully CWV-ready.Only a third of desktop and 3% of mobile URLs pass the thresholds for all the three CWV metrics.
Since the update, we only saw improvements across the board for around 1% of the pages. And only less than 40% saw better scores for at least one metric.
This means that chances are, you have a lot of space for improvement, and, done right and early, your page optimization efforts can give your pages a competitive edge.
Pay special attention to your mobile pages.The majority of checks for desktops are green (aka passed), while for mobiles, we mostly see yellows and reds. This means that it’s easier to pass audits on desktop than on mobile, with mobile pages on average facing more issues than desktop.
Most likely, this is due to the mobile thresholds and the fact that lab data is simulated on a 3G device.
Work on your LCP (for mobile) and TBT (for desktop) scores.With CLS as the least ‘problematic’ metric, you have to work on improving your LCP and TBT scores:
CLS improvements are more likely to give you a quick jump from the “poor” to “good” score range. Give an audit to your <img>, <div>, <p>, and <h1> tags to make sure they aren’t lowering your LCP score. Use the Site Audit tool to pinpoint page elements that are causing the slowness. Keep your total blocking time down to 300 ms to ensure a “good” TBT score. Once again, the Site Audit tool will help you pinpoint which long tasks are hindering your overall TBT score the most.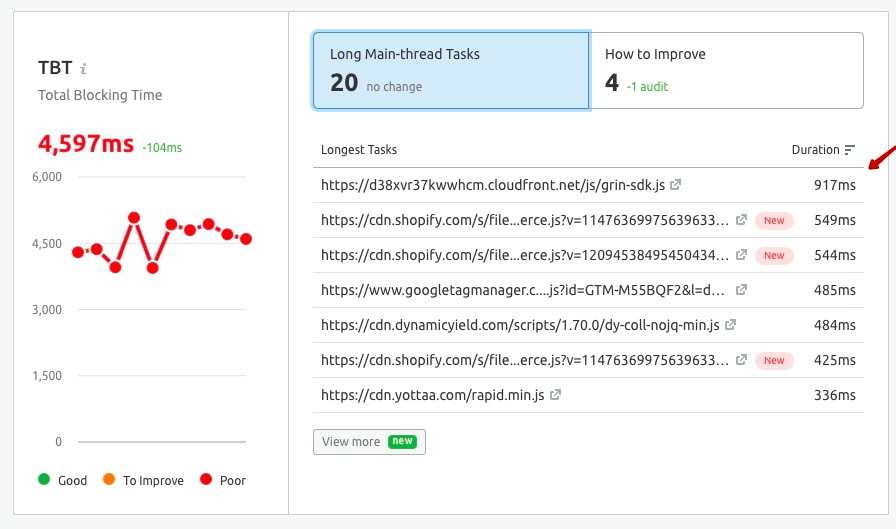 Watch out for the extent of your layout shifts and get rid of the ones that take up too much of the CLS threshold space. Site Audit reflects each largest layout shifts’ CLS contribution.
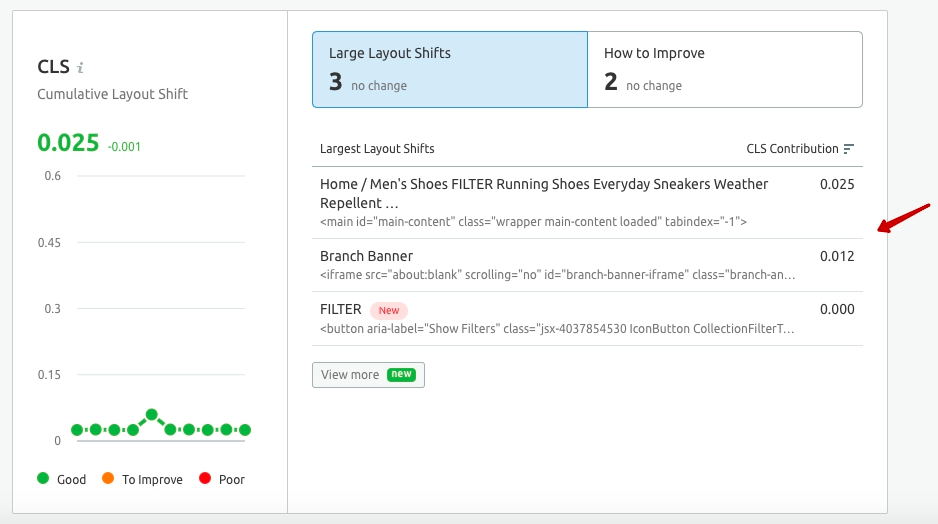
Watch out for image elements’ height and width and other common CWV issues.
Take a second look at the most difficult audits to pass. The majority of problems—both for mobile and desktop URLs—occur with image sizes. As it’s a CLS-related check that has a pretty quick fix, you can use it as a quick win for improving your CLS score.
Keep reasonable expectations.For desktops, the most common shift is to go from the “to improve” to a “good” range. But the majority of mobile URLs jump from the “poor” to “to improve” category, with the only exception being CLS. So don’t expect to make a quick move from all “poor” to all “good” scores across each and every CWV metric, and watch out for any changes in the thresholds.
Bonus: A Full List of the Most Common CWV Issues for Mobile and Desktop URLs
If you’re curious to explore the full list of all the Site Audit checks and to see the average scores for mobile-desktop pages, hover to the table below and get the complete picture.
Average Audit Scores
Audit
Average score (desktop)
Average score (mobile)
Remove duplicate modules in JavaScript bundles
100%
100%
Avoid multiple page redirects
100%
100%
Use video formats for animated content
100%
99%
Minify CSS
100%
98%
Avoid serving legacy JavaScript to modern browsers
99%
97%
Reduce the impact of third-party code
99%
72%
Reduce JavaScript execution time
99%
88%
Minify JavaScript
99%
96%
Minimize main thread work
99%
74%
Preconnect to required origins
94%
86%
Enable text compression
93%
88%
Remove unused CSS
92%
72%
Avoid enormous network payloads
92%
92%
Avoid an excessive DOM size
91%
91%
Remove unused JavaScript
85%
55%
Reduce server response times (TTFB)
82%
82%
Eliminate render-blocking resources
76%
57%
Ensure text remains visible during webfont load
33%
36%
Image elements do not have explicit width and height
24%
29%
For your convenience, we are adding Google’s notes on each audit check:
Reduce JavaScript execution time: When your JavaScript takes a long time to execute, it slows down your page performance in several ways, such as network cost, parse and compile cost, execution cost or memory cost; Avoid an excessive DOM size: A large DOM tree can slow down your page performance in multiple ways, such as network efficiency and load performance, runtime performance and memory performance; Remove duplicate modules in JavaScript bundles: JavaScript bundles on a majority of web pages are typically built by importing code from popular libraries, dependencies, and packages. This can often result in your page inheriting duplicate modules from multiple sources; Use video formats for animated content: Large GIFs are inefficient for delivering animated content, so it’s better to use video formats Ensure text remains visible during webfont load: Fonts are often large files that take a while to load. Some browsers hide text until the font loads, causing a flash of invisible text; Avoid serving legacy JavaScript to modern browsers: Avoid serving legacy JavaScript code (i.e., ES5 standard) to modern browsers so that you can prevent unnecessarily large JavaScript files from being downloaded by users; Minimize main thread work: The browser's renderer process is what turns your code into a web page that your users can interact with. By default, the main thread of the renderer process typically handles most code: it parses the HTML and builds the DOM, parses the CSS and applies the specified styles, and parses, evaluates, and executes the JavaScript; Avoid multiple page redirects: Redirects slow down your page load speed; Eliminate render-blocking resources: The Opportunities section of your Lighthouse report lists all URLs blocking the first paint of your page. The goal is to reduce the impact of these render-blocking URLs by inlining critical resources, deferring non-critical resources, and removing anything unused; Reduce server response times: The Opportunities section of your Lighthouse report reports Time to First Byte, the time that it takes for a user's browser to receive the first byte of page content; Lazy load third-party resources with facades: Third-party resources are often used for displaying ads or videos and integrating with social media. The default approach is to load third-party resources as soon as the page loads, but this can unnecessarily slow the page load. If the third-party content is not critical, this performance cost can be reduced by lazy loading it; Reduce the impact of third-party code: To add an advertising network, social media button, A/B test, or analytics service to your page, you usually need to add a third-party script to your HTML. These third-party scripts can significantly affect your page load performance; Avoid enormous network payloads: Large network payloads are highly correlated with long load times. They also cost users money; for example, users may have to pay for more cellular data. So, reducing the total size of your page's network requests is good for your users' experience on your site and their wallets; Minify CSS: The Opportunities section of your Lighthouse report lists all unminified CSS files, along with the potential savings in kibibytes (KiB) when these files are minified; Minify JavaScript: Minifying JavaScript files can reduce payload sizes and script parse time; Unsized images: The image looks fine, but it is wasting users' data and hurting page performance; Remove unused CSS rules: The Opportunities section of your Lighthouse report lists all stylesheets with unused CSS with a potential savings of 2 KiB or more. Remove the unused CSS to reduce unnecessary bytes consumed by network activity; Remove unused JavaScript: Unused JavaScript can slow down your page load speed; Preconnect to required origins.: The Opportunities section of your Lighthouse report lists all key requests that aren't yet prioritizing fetch requests with <link rel=preconnect>; Enable text compression: Text-based resources should be served with compression to minimize total network bytes.Innovative SEO services
SEO is a patience game; no secret there. We`ll work with you to develop a Search strategy focused on producing increased traffic rankings in as early as 3-months.
A proven Allinclusive. SEO services for measuring, executing, and optimizing for Search Engine success. We say what we do and do what we say.
Our company as Semrush Agency Partner has designed a search engine optimization service that is both ethical and result-driven. We use the latest tools, strategies, and trends to help you move up in the search engines for the right keywords to get noticed by the right audience.
Today, you can schedule a Discovery call with us about your company needs.
Source:


