

Earlier SEMrush released the findings of our analysis of the Fintech industry in 2018, focusing on the top 500 Fintech websites for seven countries: United Kingdom, Spain, United States, Italy, France, Germany, and Brazil.
Employing the same methodology that we used in our original study, we culled the data to determine the relative significance of site traffic from direct, organic search, social network and paid search channels to the top Fintech sites for each of the seven countries, as well as the geographic distribution of traffic sources and key user behavior metrics.
However, with the improved capabilities of the SEMrush Traffic Analytics tool, we were able to further distill the data to show the relative shares of site traffic from mobile devices versus desktop – not only for organic search traffic as detailed in the initial study but also for site search traffic in total. You can learn more about the tool's features here.
What’s more, the breakdown between mobile and desktop fintech site traffic applies not only to the total traffic from all channels but to the geographic origins and user behavior metrics of mobile devices versus desktop.
Here we’ll show how it works based on the data from the United Kingdom (U.K.) and United States (U.S.) fintech sites included in our study, and explore the potential implications for digital marketing strategy for site owners and marketers, regardless of their industry.
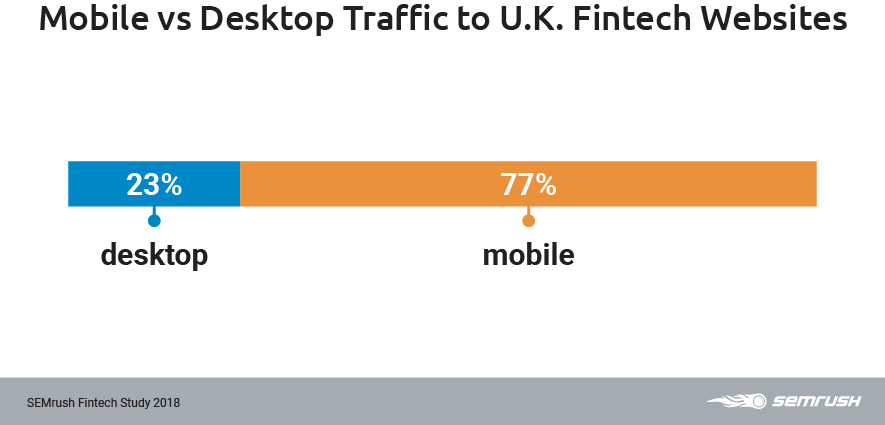
Mobile vs. Desktop Traffic
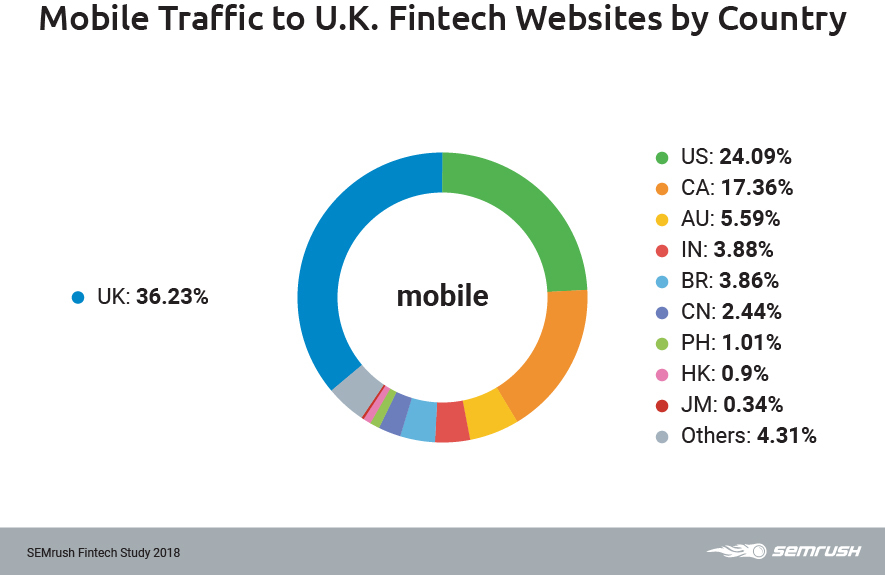
For U.K. fintech sites, traffic analytics reveals that the mobile share of traffic from all sources dominates that of desktop by a substantial margin, driving 77% of traffic compared to 23% from desktop.
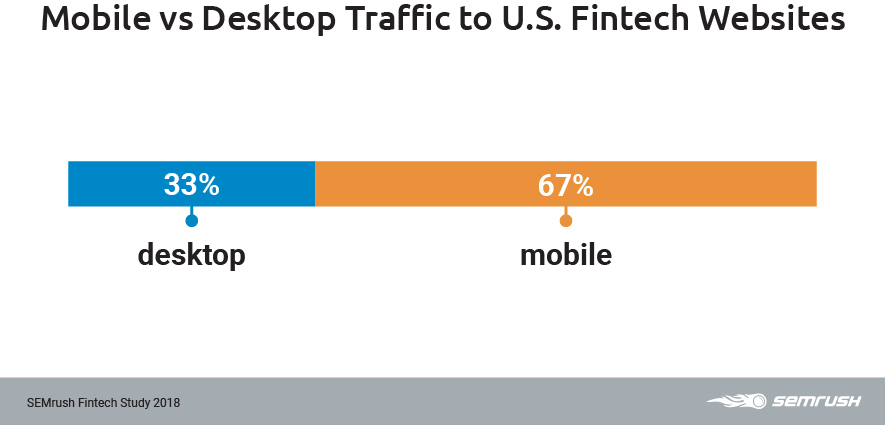
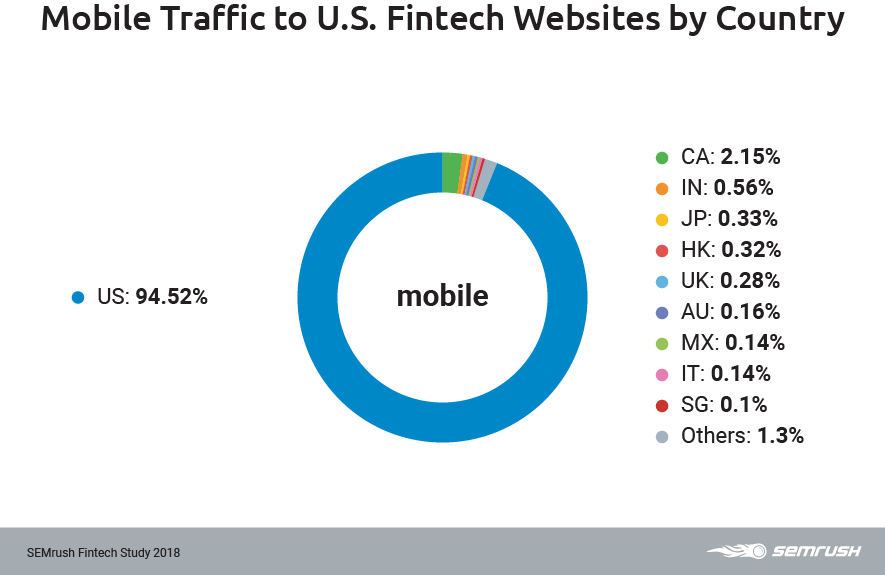
For those in the U.S., the results were likewise illuminating, showing 67% of total U.S. fintech site traffic coming from mobile devices, relative to 33% originating from desktop.
Mobile vs. Desktop Traffic: User Behavior Metrics
We examined the user behavior metrics of bounce rate, the number of site pages viewed per visit, and the time spent on site to show how both domestic and international users interact with fintech sites.
In general terms, these metrics reflect site visitors’ level of interest and engagement, as well as their experience with site performance.
UK Fintech Sites User Behaviour
The bounce rate is an indicator of users’ interest in investigating a website. Technically, it represents the percentage of visitors who navigate away from a site after viewing only one page.
Applying the deeper analytics capabilities of the Traffic Analytics tool, we can see that for U.K. fintech sites, the global average bounce rate of mobile users exceeds that of desktop by a relatively significant margin, showing 49% compared to desktop users’ 34 percent.
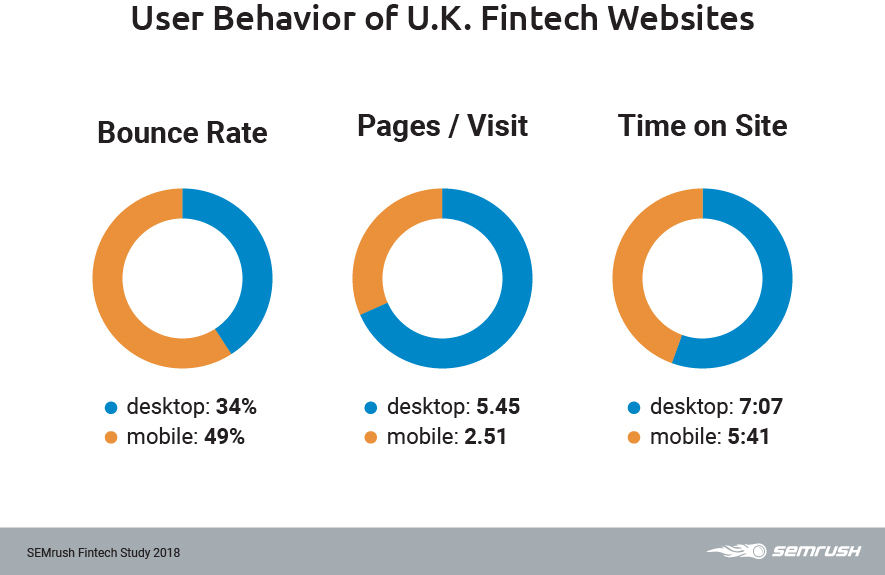
Similar to bounce rate, the number of site pages viewed during a given visit is an indication of interest, engagement, and user experience by showing how deep into a given website visitors venture.
Traffic Analytics shows that desktop users tend to go much deeper into U.K. fintech sites than their mobile counterparts, with over double the average number of pages viewed: 5.45 pages per visit as compared to the mobile global average of 2.51 pages.
The third metric studied for user behavior is time spent on site, which is the most telling of all – especially as it correlates to the bounce rate and the number of pages viewed per visit.
Our analysis shows that desktop users devoted a global average of just over 7:07 minutes on U.K. sites. Mobile visitors spent less time, with a global average of 5:41 minutes.
US Fintech Sites User Behaviour
Running the data through the new Traffic Analytics tool showsthat mobile users of U.S. fintech sites demonstrate a slightly higher global average bounce rate of 34%, as opposed to desktop users’ 31 percent.
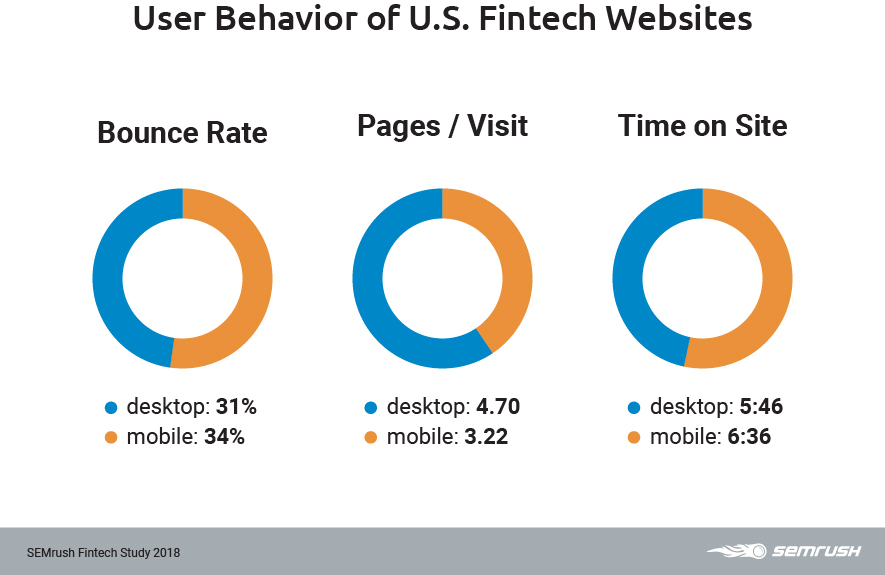
As with U.K. fintech sites, it is now evident that desktop users go deeper into U.S. sites than mobile visitors, but not nearly so dramatically: 4.7 pages viewed per visit relative to mobile users’ global average of 3.22 pages.
Also, for U.S. fintech sites, we were able to determine that mobile users invest a global average of 6:36 minutes, while desktop visitors average 5:46 minutes.
Mobile vs. Desktop Traffic: Geographic Distribution
As we did with the traffic sources and user behavior data, we ran the data on the geographic distribution of fintech site traffic through the advanced Traffic Analytics tool to discover the differences between mobile and desktop users, both domestic (within the same country) and international.
The U.K.
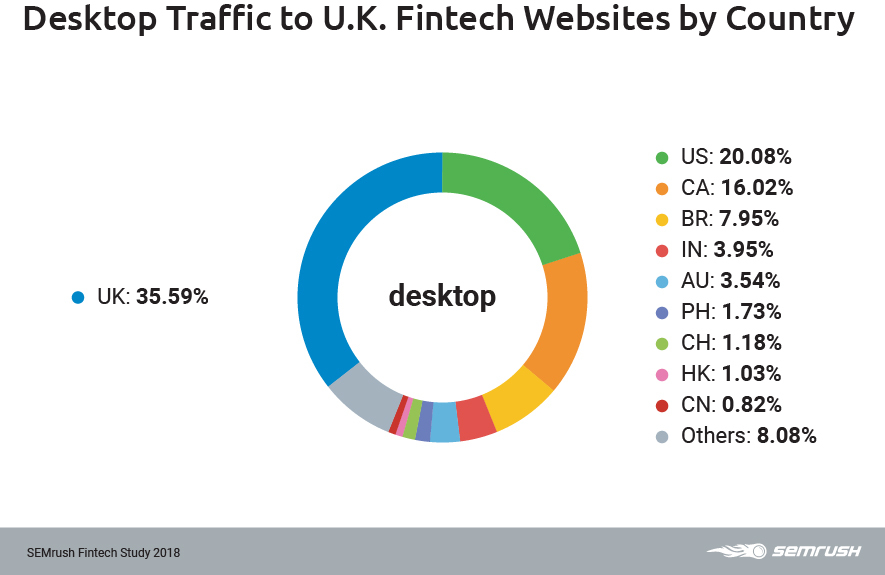
For U.K. fintech sites, the top three countries accounting for the most traffic are domestic (within the U.K.), followed by the U.S. and Canada. The mobile and desktop traffic volumes are approximately even.
Australia is the fourth most significant country of origin via mobile devices, and Brazil is the fourth largest source of desktop traffic.
The U.S.
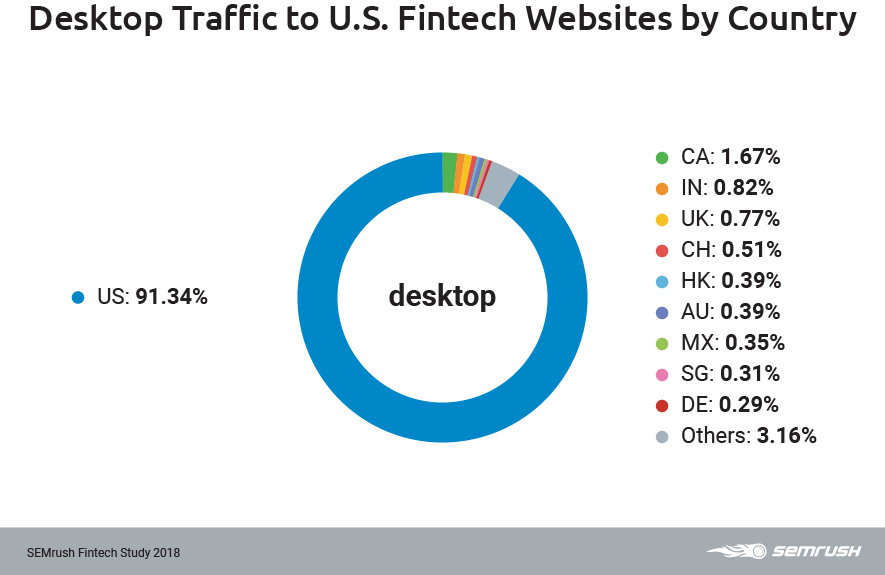
For U.S. fintech sites, domestic (U.S.) traffic is the predominant geographic source, with mobile users representing 94.52% of domestic traffic and desktop 91.34 percent.
Canada proves to be the second largest source of mobile (2.15%) and desktop (1.67%) traffic, while India is the third largest source of mobile (0.56%) and desktop (0.82%) traffic to U.S. fintech sites.
Applying the Traffic Analytics Tool to Your Digital Marketing Strategy
As you have likely concluded from our demonstration, running a finer comb through website traffic data — as is now possible with the full Traffic Analytics tool functionality — yields powerful insights that can translate into a more effective, efficient and competitive digital marketing strategy.
Regardless of your industry or your organization’s size (even if it’s just you!), the actionable data that you can generate to inform your digital campaign could be a game-changer.
For example, if you find that your site traffic originates mostly from mobile devices, you may decide to redirect resources into making your site’s pages more mobile friendly for improved performance and user experience rather than invest in updating your blog content.
This would mean implementing a responsive design, so your site renders well on mobile devices, as well as maximizing page load and search speeds. (This is especially important given that as of last month, Google’s “Speed Update” took effect, which uses page load speed as a ranking factor for mobile searches).
Similarly, if you invest in paid search, you’ll likely want to ensure your ads are formatted in HTML rather than traditional media.
And of course, if you find that a significant source of your traffic is international, you’ll want to ensure that Hreflang tags are properly implemented, so your site’s content displays the correct language.
As a final note, we are always striving to improve our products for our users. We hope you find our newest innovation useful in honing your digital marketing strategy.
Innovative SEO services
SEO is a patience game; no secret there. We`ll work with you to develop a Search strategy focused on producing increased traffic rankings in as early as 3-months.
A proven Allinclusive. SEO services for measuring, executing, and optimizing for Search Engine success. We say what we do and do what we say.
Our company as Semrush Agency Partner has designed a search engine optimization service that is both ethical and result-driven. We use the latest tools, strategies, and trends to help you move up in the search engines for the right keywords to get noticed by the right audience.
Today, you can schedule a Discovery call with us about your company needs.
Source:


