“Catch a man a fish, feed him for a day. Teach a man to fish, feed him for a lifetime.” Drops mic.
There’s nothing like feeling empowered, is there? What if I told you if you read this post in its entirety, you will learn something that will be instrumental in constructing every marketing campaign you help create? Please allow me to pick back up the mic and step on my soapbox. Because you’re a mere 1,000+ words and a few images away from being empowered.
The Timeless Marketing Question
Let’s be honest. We, as digital marketers, have a tough job. The expectations of what we should know how to do (IMO) are not in alignment with reality.
Most marketers are either creative or analytical, but the dynamic is shifting where we are expected to be both. This is especially true for smaller businesses who don’t have the resources to invest in a large scale marketing department. No matter what industry you’re in or what your [marketing] title is, there’s one, timeless question that’s asked before beginning a campaign:
“Who are we targeting this to?”
If you don’t know the answer, how would you find it? The generic, knee-jerk response will/should be: “the person who is most likely to purchase my product or service.” So, I ask again: if you don’t know WHO that is, how would you find it?
The short answer: Google Analytics.
It doesn’t have to be challenging or a long, drawn-out process to discover these people. With Google Analytics, you can quickly and effectively pull reports that will show you the type of person who has the highest likelihood of making a purchase.
While you’re reading, I would suggest opening your company’s Google Analytics account in a separate window on another monitor. Go ahead and do that now … OK, great to have you back — moving on!
Full disclosure: it took me a while get into a habit of navigating to the right reports and pulling the most important data. I’m certain that most of you know how to log in, pick the right container and pull a behavior report to understand which of your website’s pages received the most traffic.
I’m also writing this based on the assumption that someone within your company has already set up a Google Analytics account! If in fact that step has not been completed, use this resource to get started. Lastly, if you’re a beginner, it would behoove you to go through Google’s online training courses. Even having multiple years of Google Analytics experience, I learned a lot!
For the purposes of creating buyer personas using Google Analytics reports, the Audience tab will be home base.
Before you start pulling reports like a boss, be sure to set your date range in the upper right in hand corner. Go as far back as possible to pull all relevant historical data. For the purposes of this blog, I’ve pulled data from all of 2015.
Report #1: Demographic Overview
Going from broad information to specific, let’s start by pulling a Demographic Overview report which will show us basic age and gender information — see below:
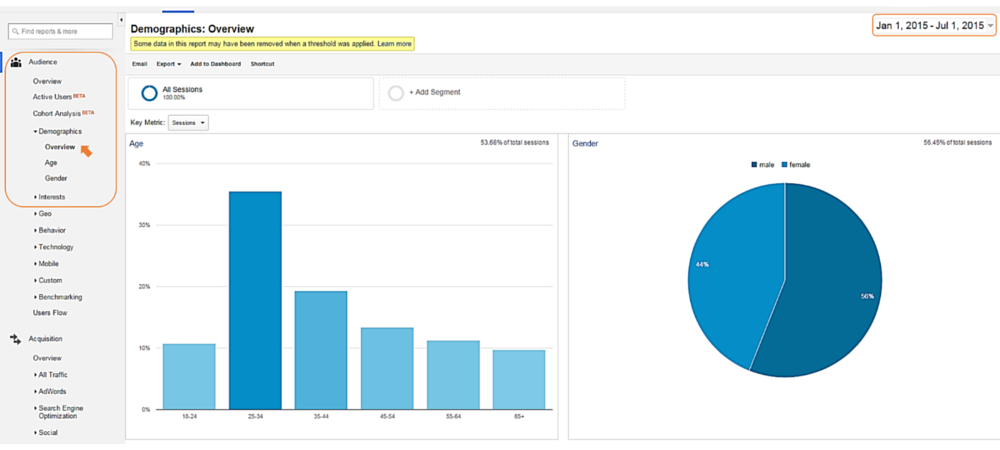
Quick Analysis of the Data:
Age range favors 25-34 year-olds Majority are maleNext Steps for Deeper Analysis with this Report
This report is pretty generic and does not offer any way to dive deeper into the data. If you’re simultaneously building out a buyer personas deck to present to stakeholders, be sure to screenshot and notate.
Report #2: Demographics: Age
Going a little deeper into the data, we can now see a more granular view of the age breakdown and which range is generating the most revenue — assuming you either have e-commerce analytics set up or have a separate container in Google Analytics that tracks purchase data only.
If you do not have e-commerce analytics tracking set up, you can still use the data to provide a very detailed analysis of website traffic. This data will still be valuable and useful for building your ideal customer profiles.
To pull this report, simply navigate to the Demographics dropdown in the Audience tab and select Age. See below:
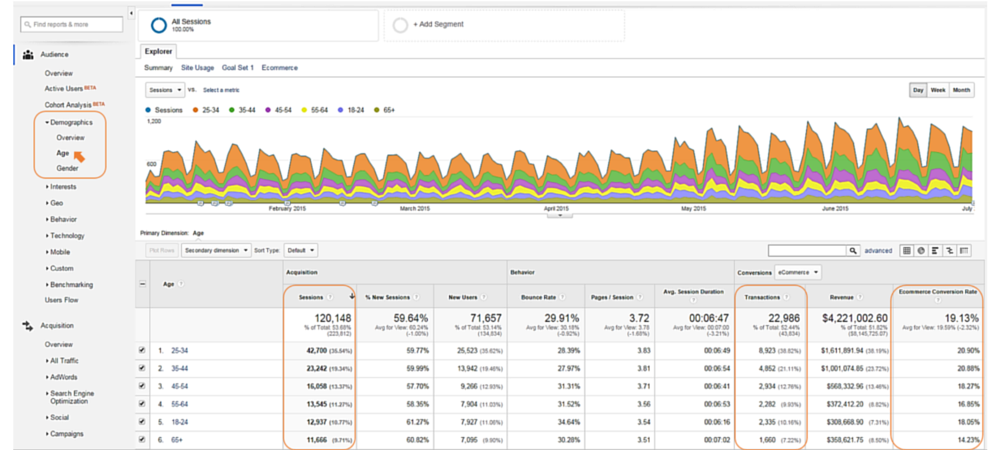
Quick Analysis of the Data:
The 25-34 age range generates the most revenue 25-34 have the most sessions and transactions 25-34 has the best conversion rateTakeaway: we should be targeting millennials.
Next Steps for Deeper Analysis with this Report
This report is very informative and empowers us to understand the age range that has the highest likelihood of buying our products. We’re going to circle back to this report because we’re going to need it to drill down into more granular and informative interest data.
Report #3: Demographics: Gender
Similar to the Age report, the Gender report will allow us to see and understand if men or women are making us the most money. Depending on your product or service line, this might not be a very eye-opening report. For instance, the marketing team over at Victoria’s Secret probably doesn’t need to pull this report … on second thought, maybe they do. I digress.
For companies whose audience is more ambiguous, this report will be very important for you to analyze.
To pull this report, go the Audience tab > Demographics dropdown > click on Gender. Then, voila! See below:
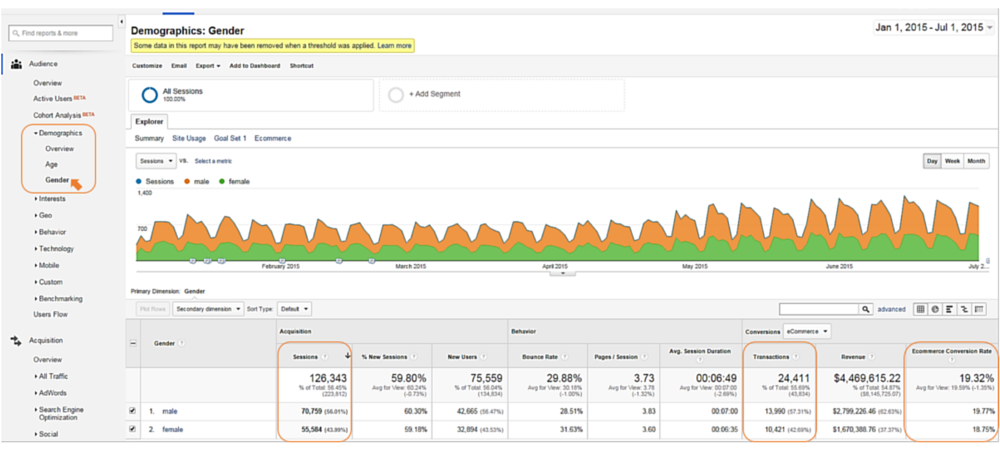
Quick Analysis of the Data:
Males have a higher conversion rate (over 1% better) Males have generated over $1M more in revenue compared to women Majority (56%) of our traffic is maleTakeaway: we should be targeting males (probably between ages 25-34).
Next Steps for Deeper Analysis with this Report
At this point, you should have a great starting point to build out your top three buyers. After analyzing the provided data, it’s easy to deduce that our most profitable buyer is a male more than likely between the ages of 25-34. The next report on the list will confirm that.
Report #4: Demographics: Age (+Gender)
So I’m going to let you in on a little secret. This report does not live naturally in Google Analytics. Meaning, you can’t find it in the left hand sidebar. To access, you must pull the same Demographic Age report (#2) and click into the age range to display gender breakdown.
Once you work those magical clicking powers, you will see a report that looks like this one:
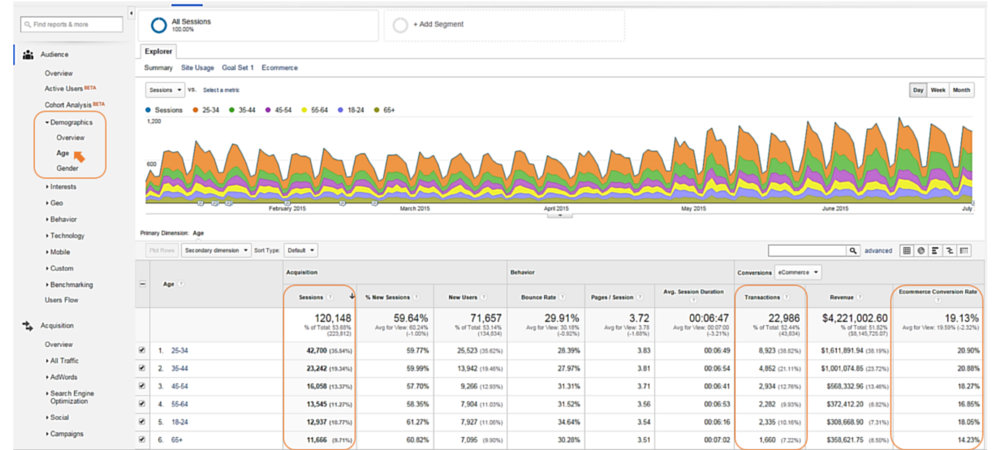
Quick Analysis of the Data:
Just as suspected, males 25-34 generate the most revenue (nearly ¼ of the total) Males 25-34 account for over 22% of all transactions (5,049 / 22,986) Males 25-34 account for 20% of all website sessions (24,140 / 120,148)Takeaway: we get it. Male 25-34 is the primary. But what are they interested in?
Next Steps for Deeper Analysis with this Report
Now we get into interests. Similar to the Age+Gender report, pulling an interest report based on Age+Gender does not live organically in Google Analytics. There are a couple ways to access this report, but allow me to show you the easiest.
Report(s) #5: Demographics: Age/Gender + Interests
Don’t leave the current report you’re in! Stay put in the Age+Gender analysis but now, the next big secret is to click male. If your Google Analytics works the same as mine, it should take you to the “Other Categories” report. This is a very granular interests report but let’s go to more generic interests; here’s how:
Right above Secondary dimension lives Primary dimension. The word “Other” should be in blue. Click “Other” and change to “Affinity Categories.” Click the corresponding green box in the dropdown. Once that is complete, the below report should populate:
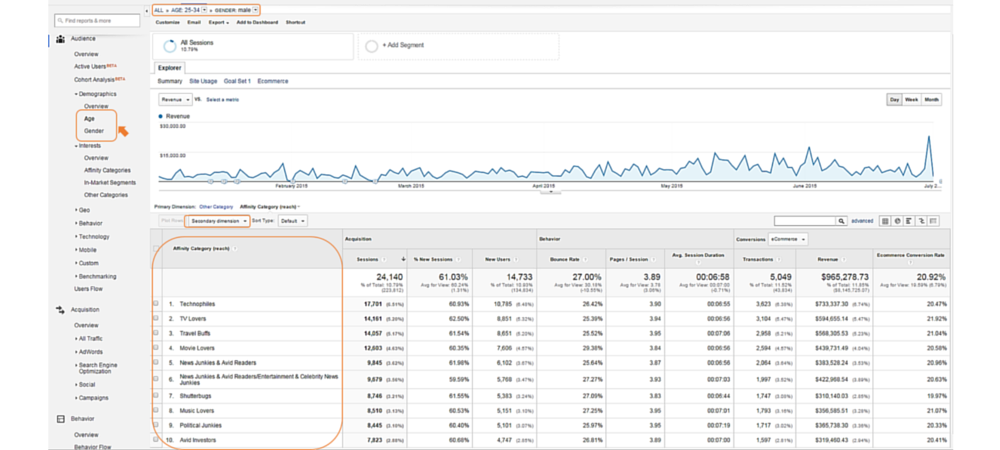
Quick Analysis of the Data: (male 25-34)
This segment is very tech-savvy They love watching TV (probably NetFlix — because, of course) They love to travel, watch movies (also on NetFlix) and read the news (on their phones)To continue the interest analysis of this segment, you’ll need to go back to the primary dimension dropdown, click on “other” and type “In-Market Segments.” This will change the primary dimension completely and provide only data that you’ve requested opposed to adding a secondary element.
Here’s a look at this report:
Quick Analysis of the Data: (male 25-34)
Love to fly and stay in hotels They have jobs that are in the financial or real estate industry Love cell phones, computers (electronics in general) and clothesAs you can see, the report is a continuation of the affinity analysis. It dives a little deeper but the analysis goes even further. Go back to the primary dimension one last time and type in “other” to go back to the Other Interest report that you originally got brought to.
Here’s the final report:
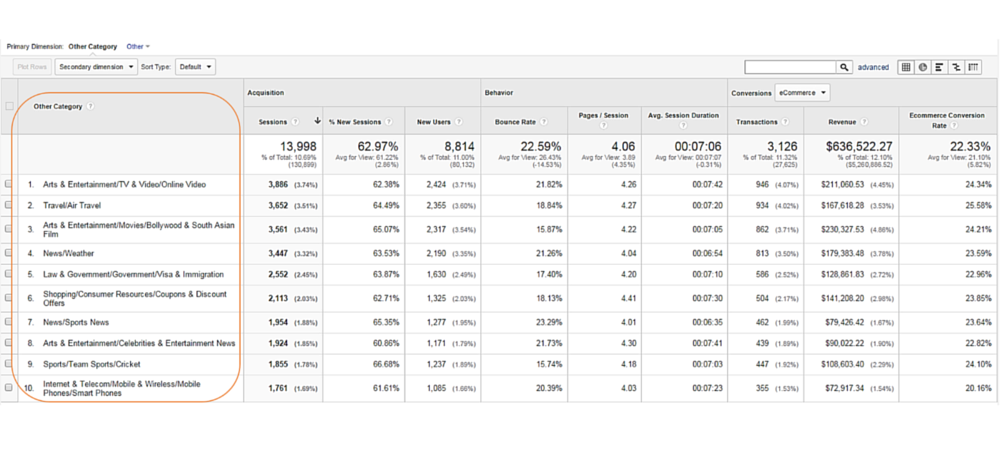
Quick Analysis of the Data: (male 25-34)
Online video + air travel = they love watching TV/movies on a plane Into Bollywood/South Asian films (aka, they’re more than likely of Indian decent) Have done a lot searching on Visas and immigration lawsPulling it All Together to Create a Profile (with an Amazing Example!)
And with that, you have all the data necessary to piece together your first buyer persona. The next steps would be to go back through and see who the next profile should be. It’s always wise to create at least three.
The questions remains: now that I have all of this information, how can I use it?
I’m glad you asked. Here is the profile I built using all of the aforementioned data from Google Analytics:

Time to Go Fishing
That wasn’t so bad, was it? I think Google Analytics can be pretty intimidating at times. We get so good at pulling the most basic reports without trying to drill in to learn more and mine the data to discover more insightful information.
Well. That’s all in the past. Now you have the knowledge to create buyer personas on your own without anybody’s help. Get started now and surprise your boss this week with some amazing insight into your customers.
Have any questions or comments on this process? Let me know by leaving a comment!
Innovative SEO services
SEO is a patience game; no secret there. We`ll work with you to develop a Search strategy focused on producing increased traffic rankings in as early as 3-months.
A proven Allinclusive. SEO services for measuring, executing, and optimizing for Search Engine success. We say what we do and do what we say.
Our company as Semrush Agency Partner has designed a search engine optimization service that is both ethical and result-driven. We use the latest tools, strategies, and trends to help you move up in the search engines for the right keywords to get noticed by the right audience.
Today, you can schedule a Discovery call with us about your company needs.
Source:


![How To Create a Strategic Dashboard in Excel Using Semrush Data [Excel Template Included]](https://allinclusive.agency/uploads/images/how-to-create-a-strategic-dashboard-in-excel-using-semrush-data-excel-template-included.svg)
