

It is one thing to analyze data you can grasp as a marketing specialist. It is another to visualize it in an impactful way.
Data visualization gives you the power to turn masses of information into valuable insights to tell compelling stories that help you make data-driven decisions.
You can achieve this with SEO reporting tools like Google Data Studio (GDS).
If you have ever dealt with GDS, terms like “data blending”, “custom segments” and “dimension breakdown” are likely to make you shiver.
Despite its complexity, GDS is one of the most powerful SEO reporting tools available. This is why we have developed a report template to help SEO specialists save time on setting up dozens of widgets and fully understanding the tool itself.
 Click the image to get the template
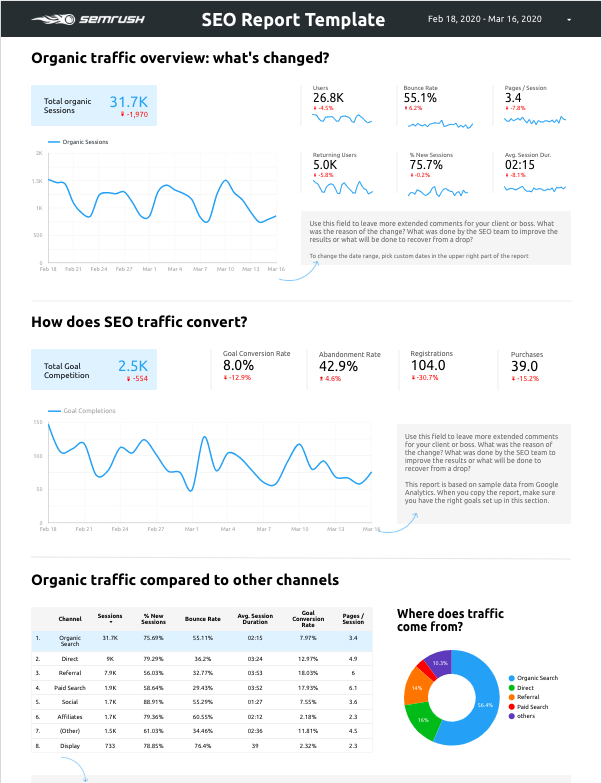
The report consists of three pages. The first page only requires access to Google Analytics, so you don’t need a paid subscription to Semrush to make use of it. The second and third pages are based on Google Search Console and Semrush data.
With an Semrush Guru subscription, the combined report will allow you to send data to Data Studio and gain access to 40+ marketing tools for SEO, paid advertising, content writing, social media management, and marketing reporting.
Let’s look at each part of the report in detail.
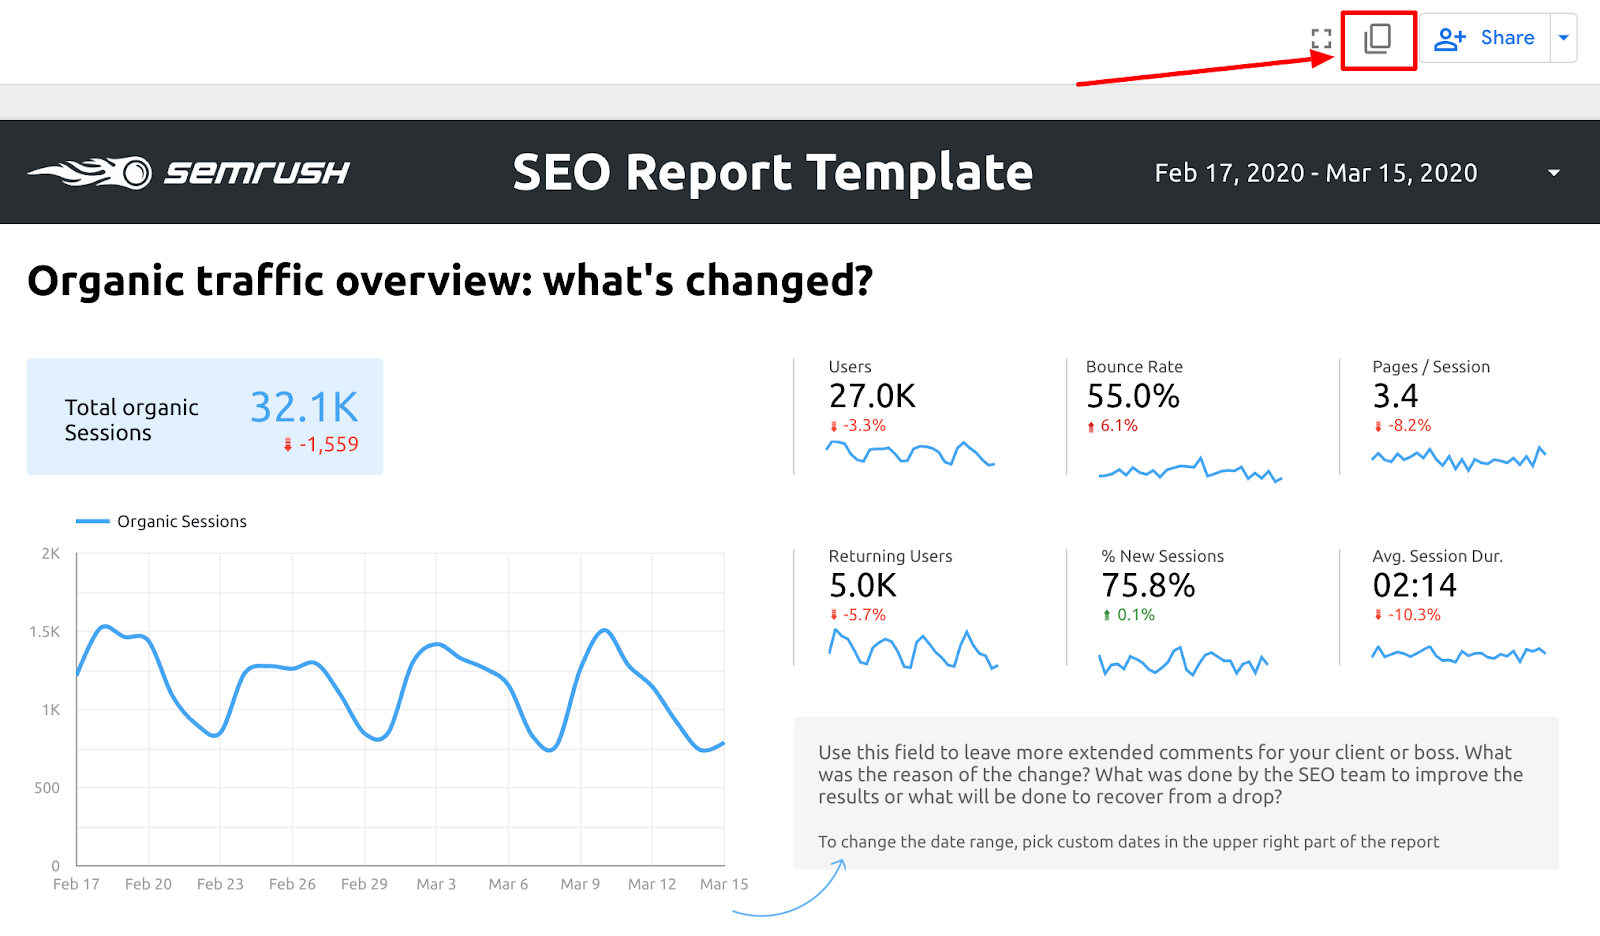
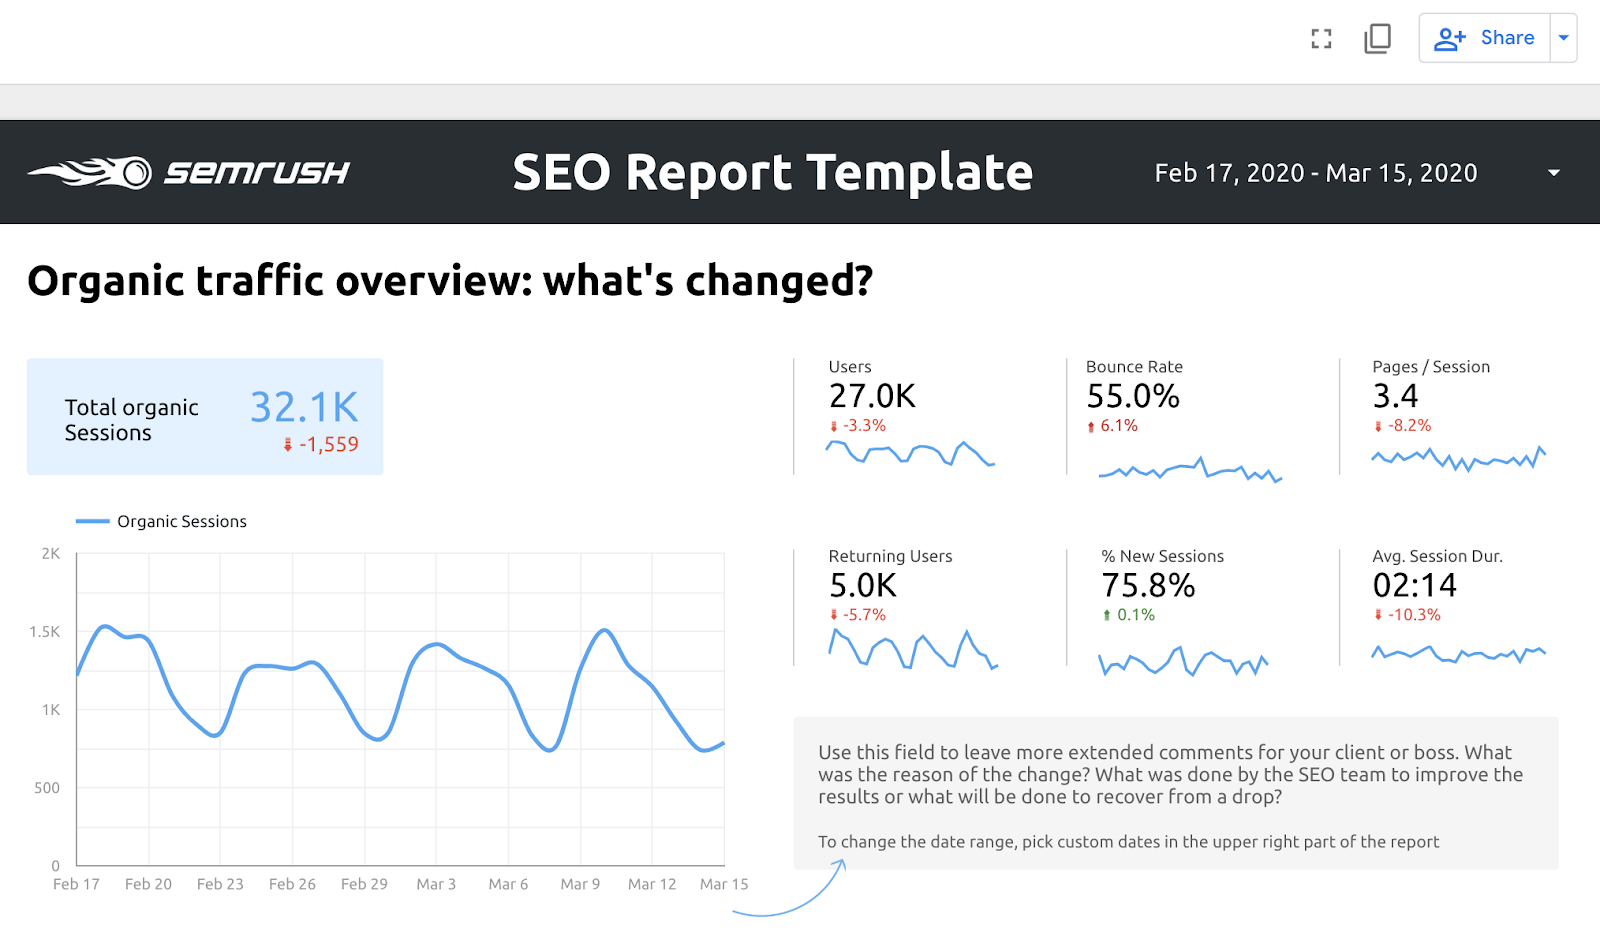
Organic Traffic Overview: What’s Changed?
Source: Google Analytics
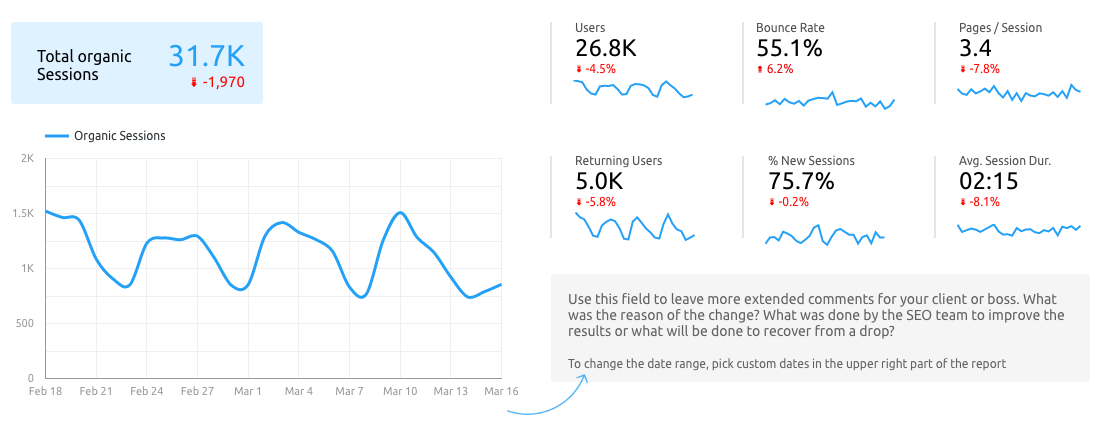
The Overview provides an instant view of the organic traffic situation. The three most important elements of the Overview section are:
Organic traffic sessions
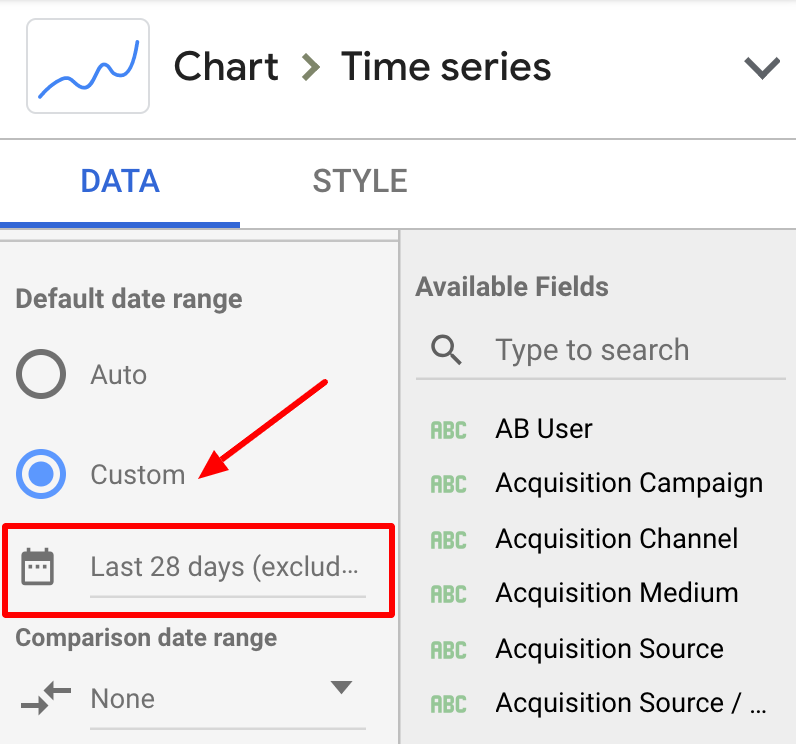
How this number changed over the determined time period (you can pick custom dates in the upper-right part of the report)
The trend line over the past month (you can change the date range in the Default date range section):
To the right of the Organic Sessions graph, you will find a series of metrics that depict user behaviors:
Users
Bounce Rate
Pages / Session
Returning Users
% New Sessions
Average Session Duration
You can use the comments field to document any changes in your data.
If your results improved, was it because you managed to break into the top-three positions for some high-volume keywords? Did newly implemented meta tags double the organic click-through rate (CTR)? Did you improve your site speed and bounce rate?
If your results worsened, was it because you lost featured snippets for some high-volume keywords? Did you experience any technical issues slowing the site down? Did a Google update hit your website?
The comment field can be useful to help you explain changes to others and, if necessary, present a recovery plan.
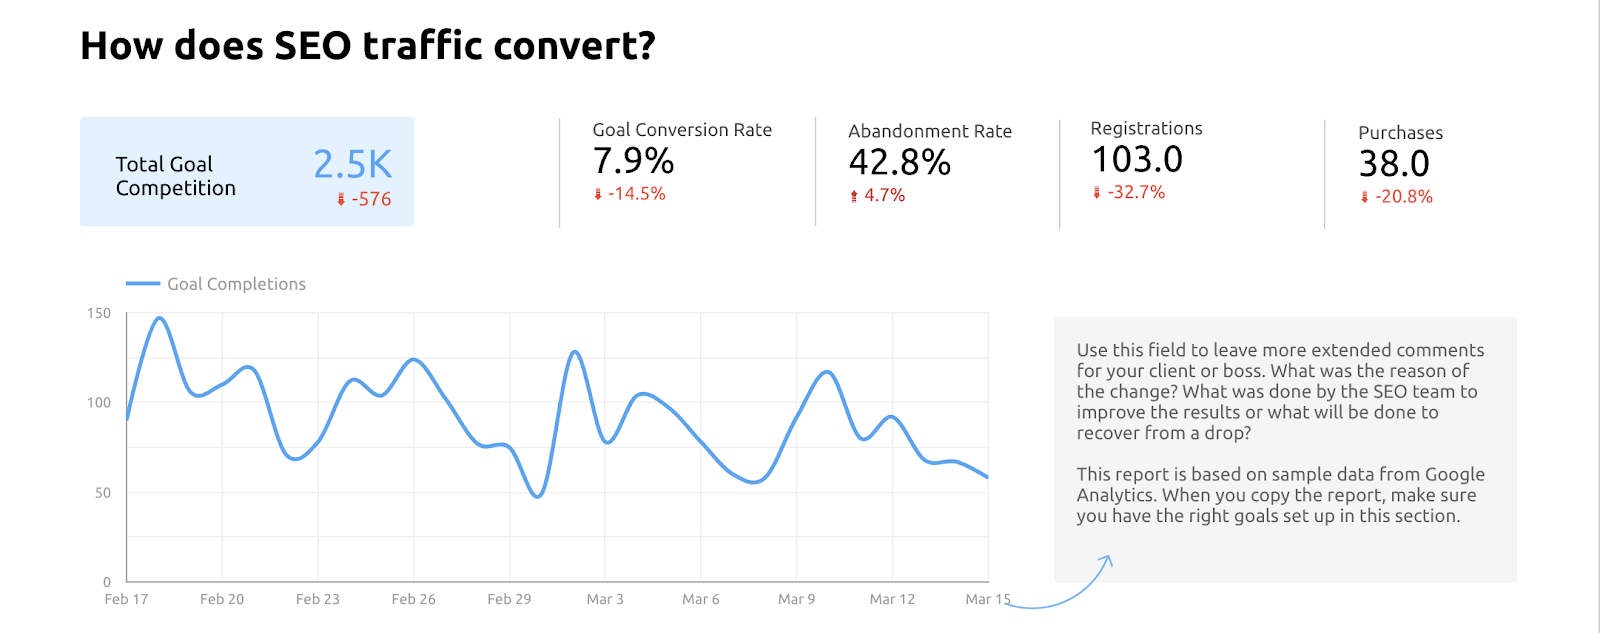
How Does SEO Traffic Convert?
Source: Google Analytics
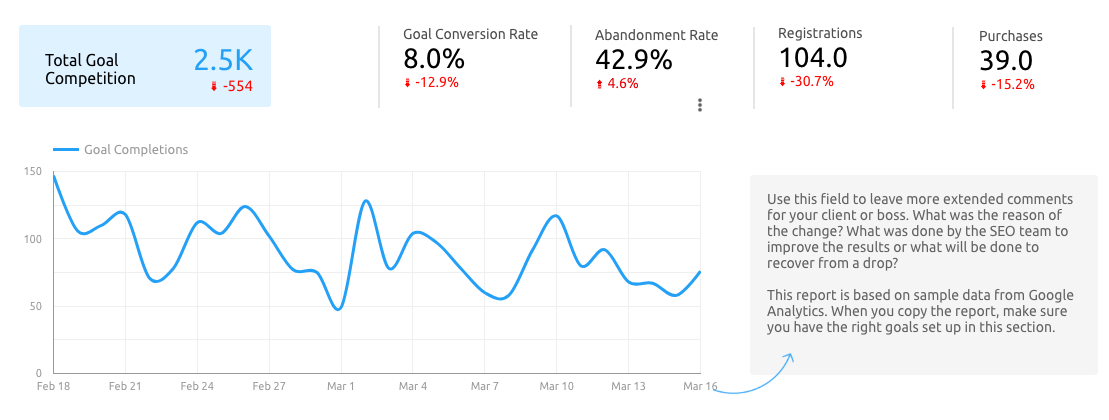
Business owners are not only concerned about getting traffic. They need to understand how and why it converts to help them achieve their business goals.
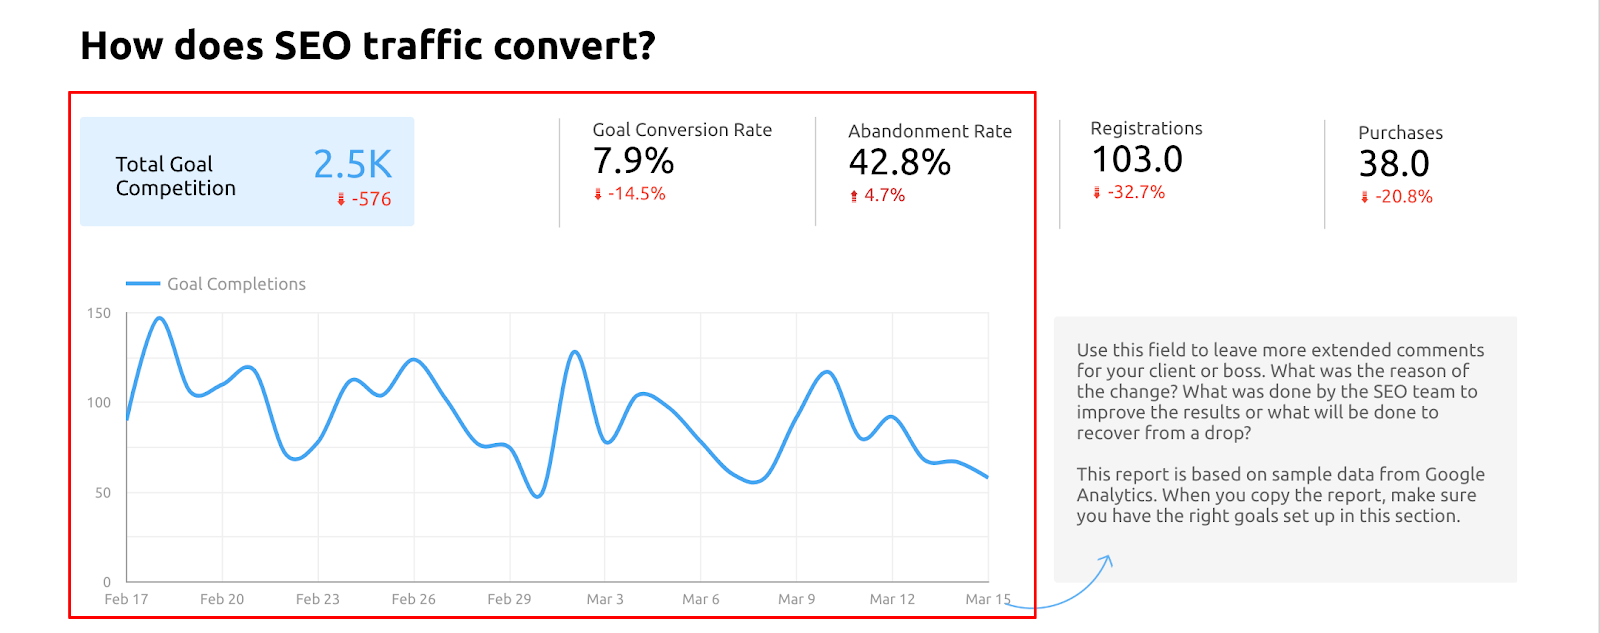
This is why this section of the report focuses on Total Goal Completions and the Goal Completions Trend Graph to tell the full story.
The example above suggests that you keep track of the goal conversion and abandonment rates to spot potential technical problems, UX issues or irrelevant traffic, but you can manually add some of your most important goals to the report yourself.
For instance, a SaaS business may be tracking registrations, trials and payments to see how the users are moving through the sales funnel.
An e-shop can track different stages of purchase, such as clicks on ‘Add to cart’, clicks on ‘Proceed to payment’, and payment completions.
The report can be tailored to suit your needs when it comes to understanding how your traffic converts.
Organic Traffic Compared to Other Channels
Source: Google Analytics
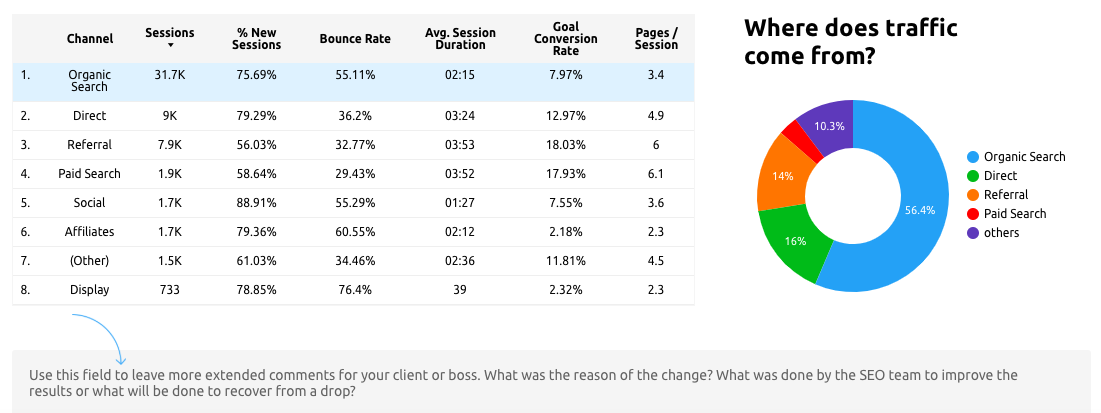
This section gives you a top-level idea of how Organic Search performs alongside your other marketing activities.
Large-scale Paid Search campaigns, for example, might affect Bounce Rate and Average Session Duration; an SEO should be able to see whether or not that kind of activity has a knock-on effect on Organic performance.
To get a quick overview of Organic versus other channels, you can create a table with metrics such as:
Sessions
% New Sessions
Bounce Rate
Average Session Duration
Goal Conversion Rate
Pages/Session
The table is accompanied by a pie chart that visualizes the traffic sources so you can get a clearer view of Organic Search’s contribution.
SERP Visibility: What’s Changed?
Source: Google Search Console
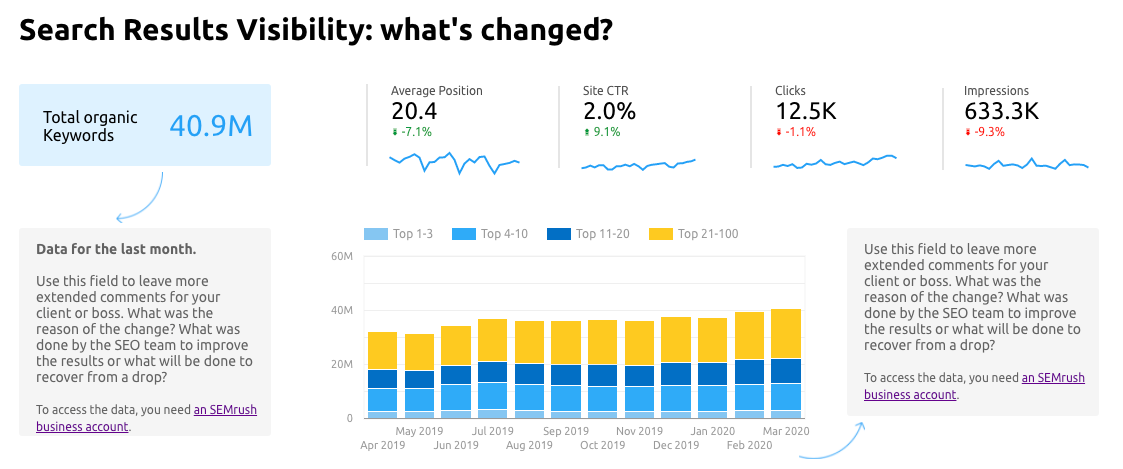
The second page of the report will help you understand your Organic performance in more detail.
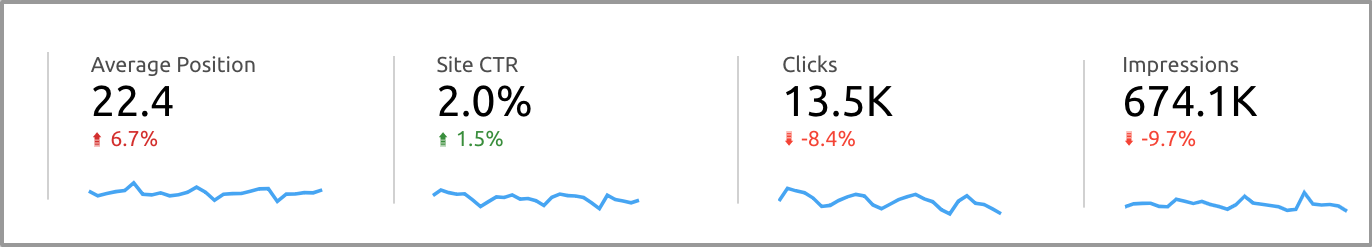
The first section, dedicated to your visibility in the SERPs, includes:
Average Position: An average of your positions for every keyword for which you rank.
Site CTR: A sign of issues with snippets (meta titles and descriptions). CTR can also change when a competitor gets a featured snippet or other SERP feature for themselves.
Clicks: The actual number of unique times people clicked on your website on the search results page.
Impressions: How many times your website appeared on the search results page (without necessarily being clicked on).
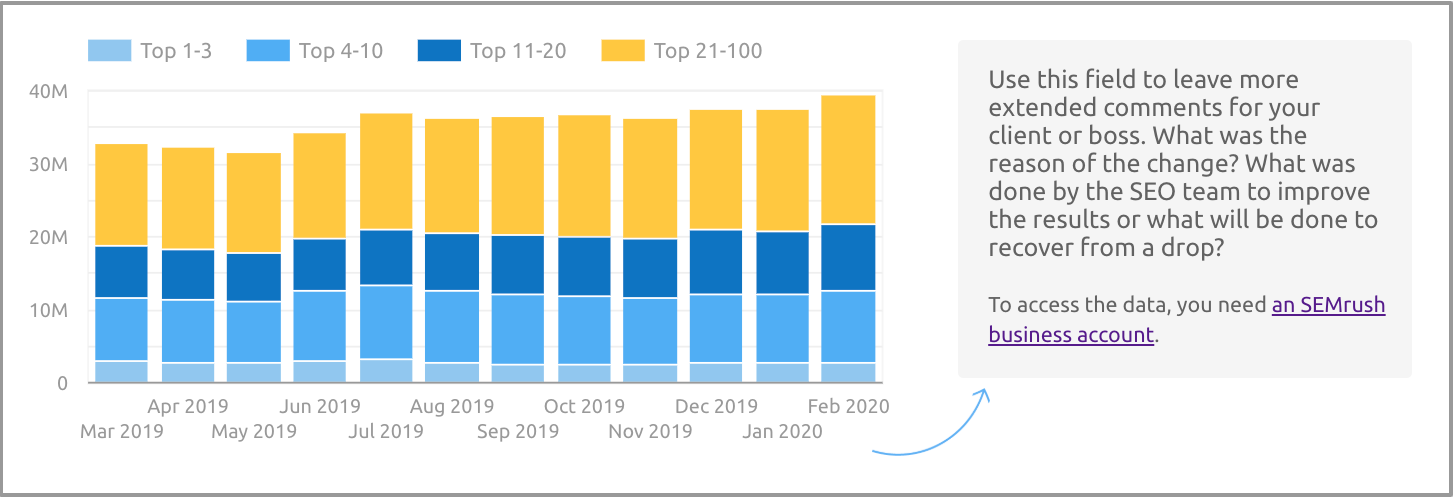
In the comment section of the report, you can record the activities that made a difference to your visibility. You might have rewritten your content according to best practices to get more clicks and impressions, or you might have worked on meta descriptions to boost CTR.
Remember that your visibility might decline because of competitor activity that is out of your control, so you will want to monitor that in the Position Changes report and document it here, too.
For a more detailed breakdown of your visibility in the SERPs, you can use Semrush’s Organic Analytics report.
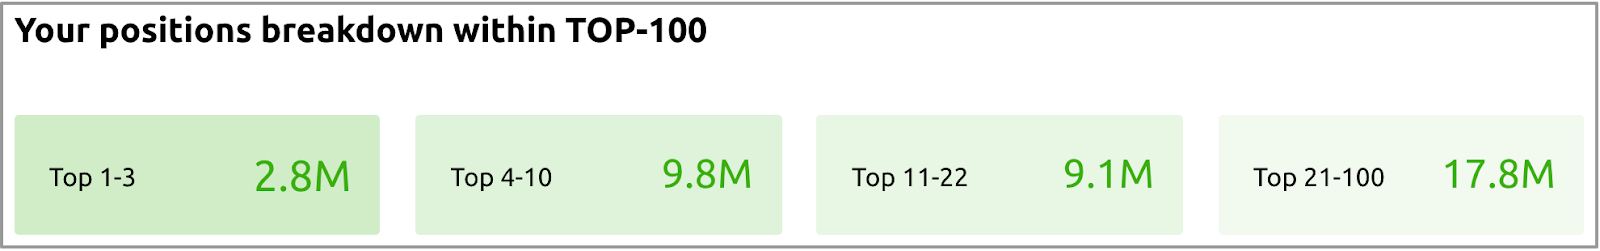
Your Positions Breakdown within TOP-100
Source: Semrush
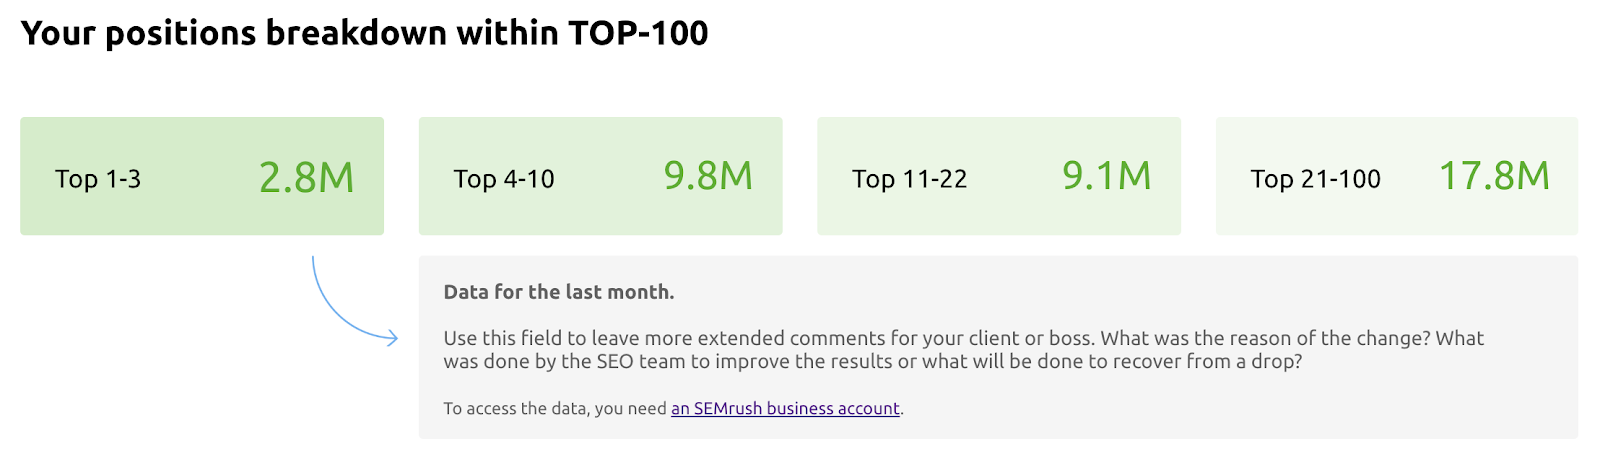
Google Search Console does not provide detailed statistics about the Organic positions you occupy for certain keywords, so we have included both the total number of keywords and exact positions here.
You can view all keywords grouped according to your position in Google’s search results.
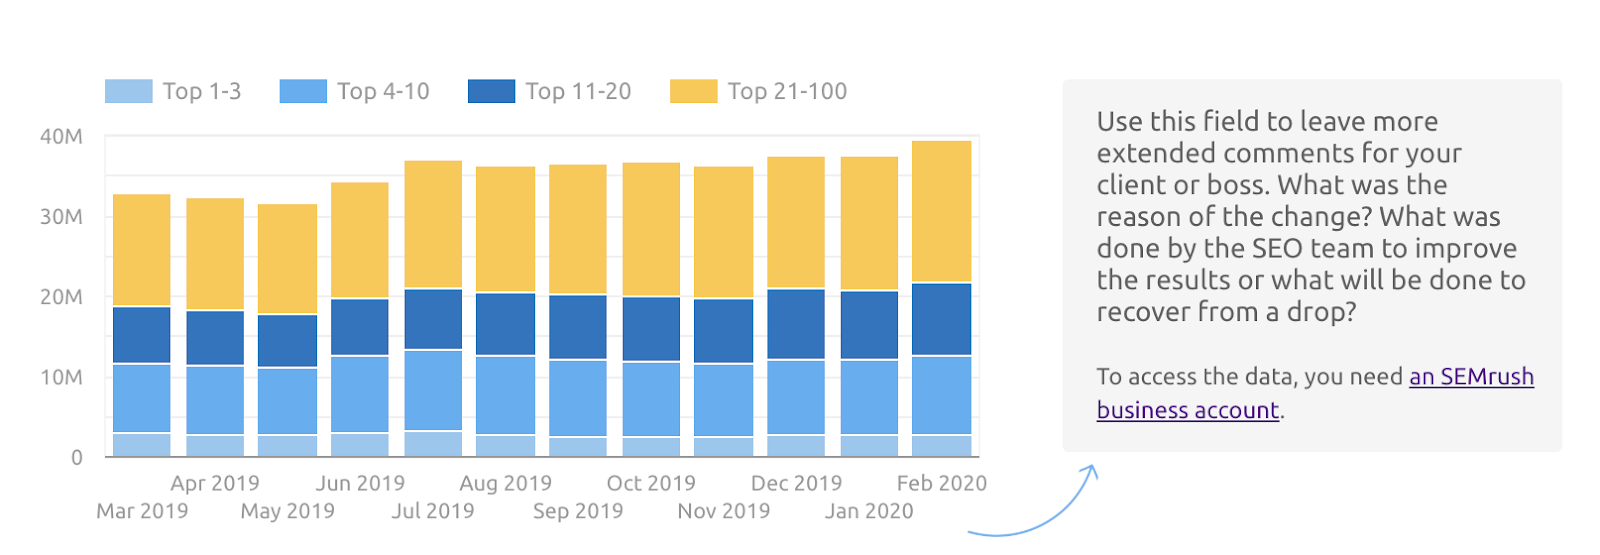
This gives you a clearer picture of your search visibility and keyword performance so you can identify opportunities to improve your Organic Search rankings.
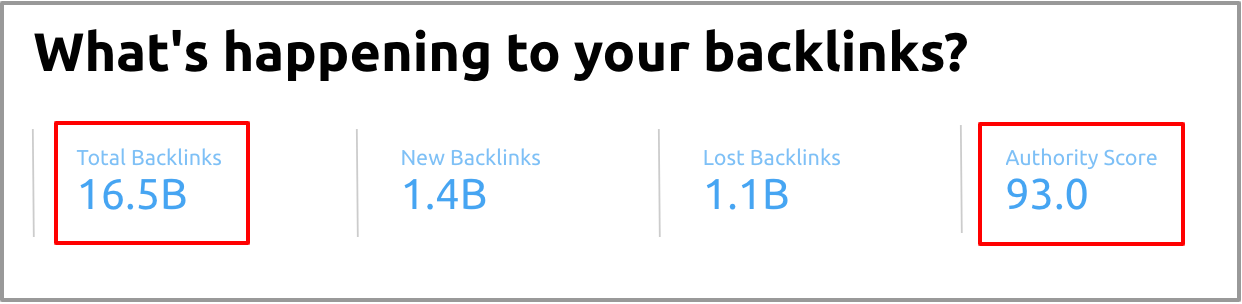
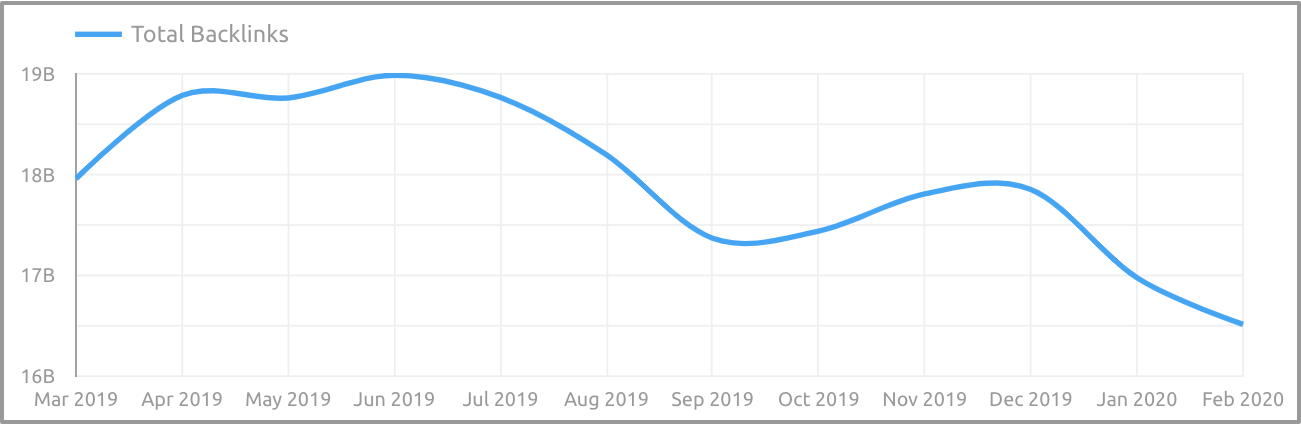
What's Happening to Your Backlinks?
Source: Semrush
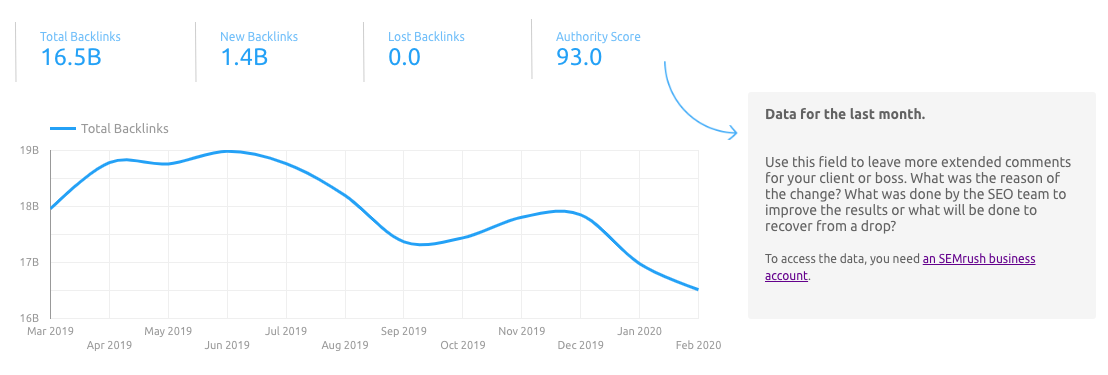
Earning links is one of the biggest SEO challenges any website owner faces.
Checking the types of backlinks that point to your site and the Organic traffic they are driving can illustrate the effectiveness of your link building efforts.
You can keep track of changes in your backlink profile in this section of the report template. It can help you spot a sudden increase or decrease in the number of backlinks, which may provide the early warning signs that help you change your strategic course to avoid potential penalties.
An important metric to track here is the Authority score. This is a compound domain score that measures the overall quality of a website according to its backlink profile.
It indicates both the number and quality of backlinks, as well as the associated strength of a domain.
The higher the Authority Score, the greater the trust in the domain, so you can use it to understand whether or not your link building strategy is working for you.
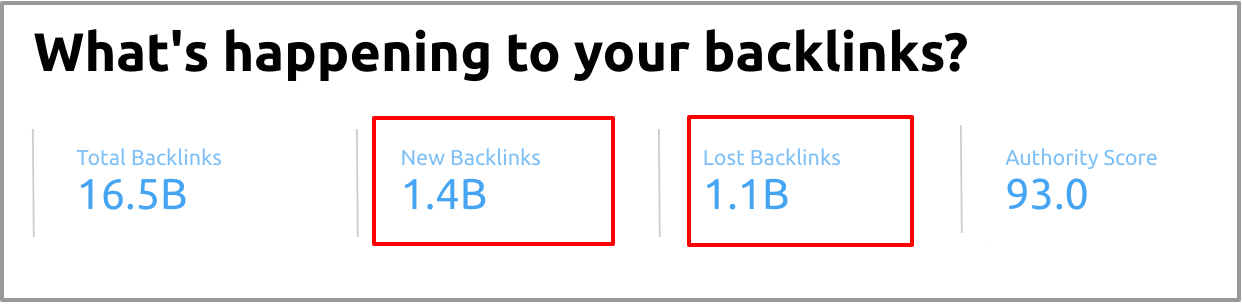
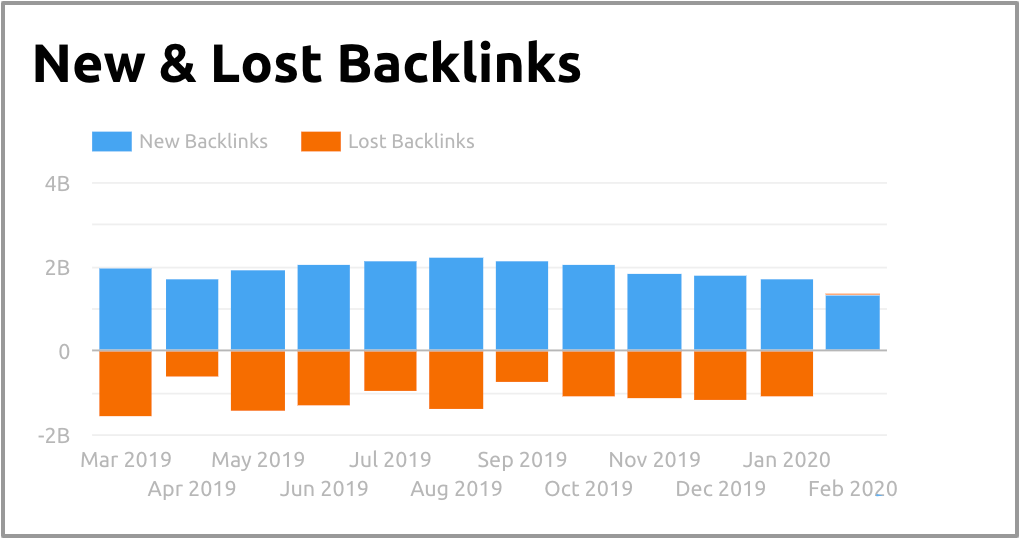
New and Lost Backlinks
Source: Semrush

This section of the report shows the backlink trend for the past 12 months in terms of gains and losses.
This will allow you to assess how successful and consistent your link building strategy has been over time. You will be able to spot seasonal trends at play, for instance, or see if a shift in a company's content strategy affected the relevance of the links you attract.
You can use the data to inform content writers, strategists or media buyers, too, for a more comprehensive and connected approach.
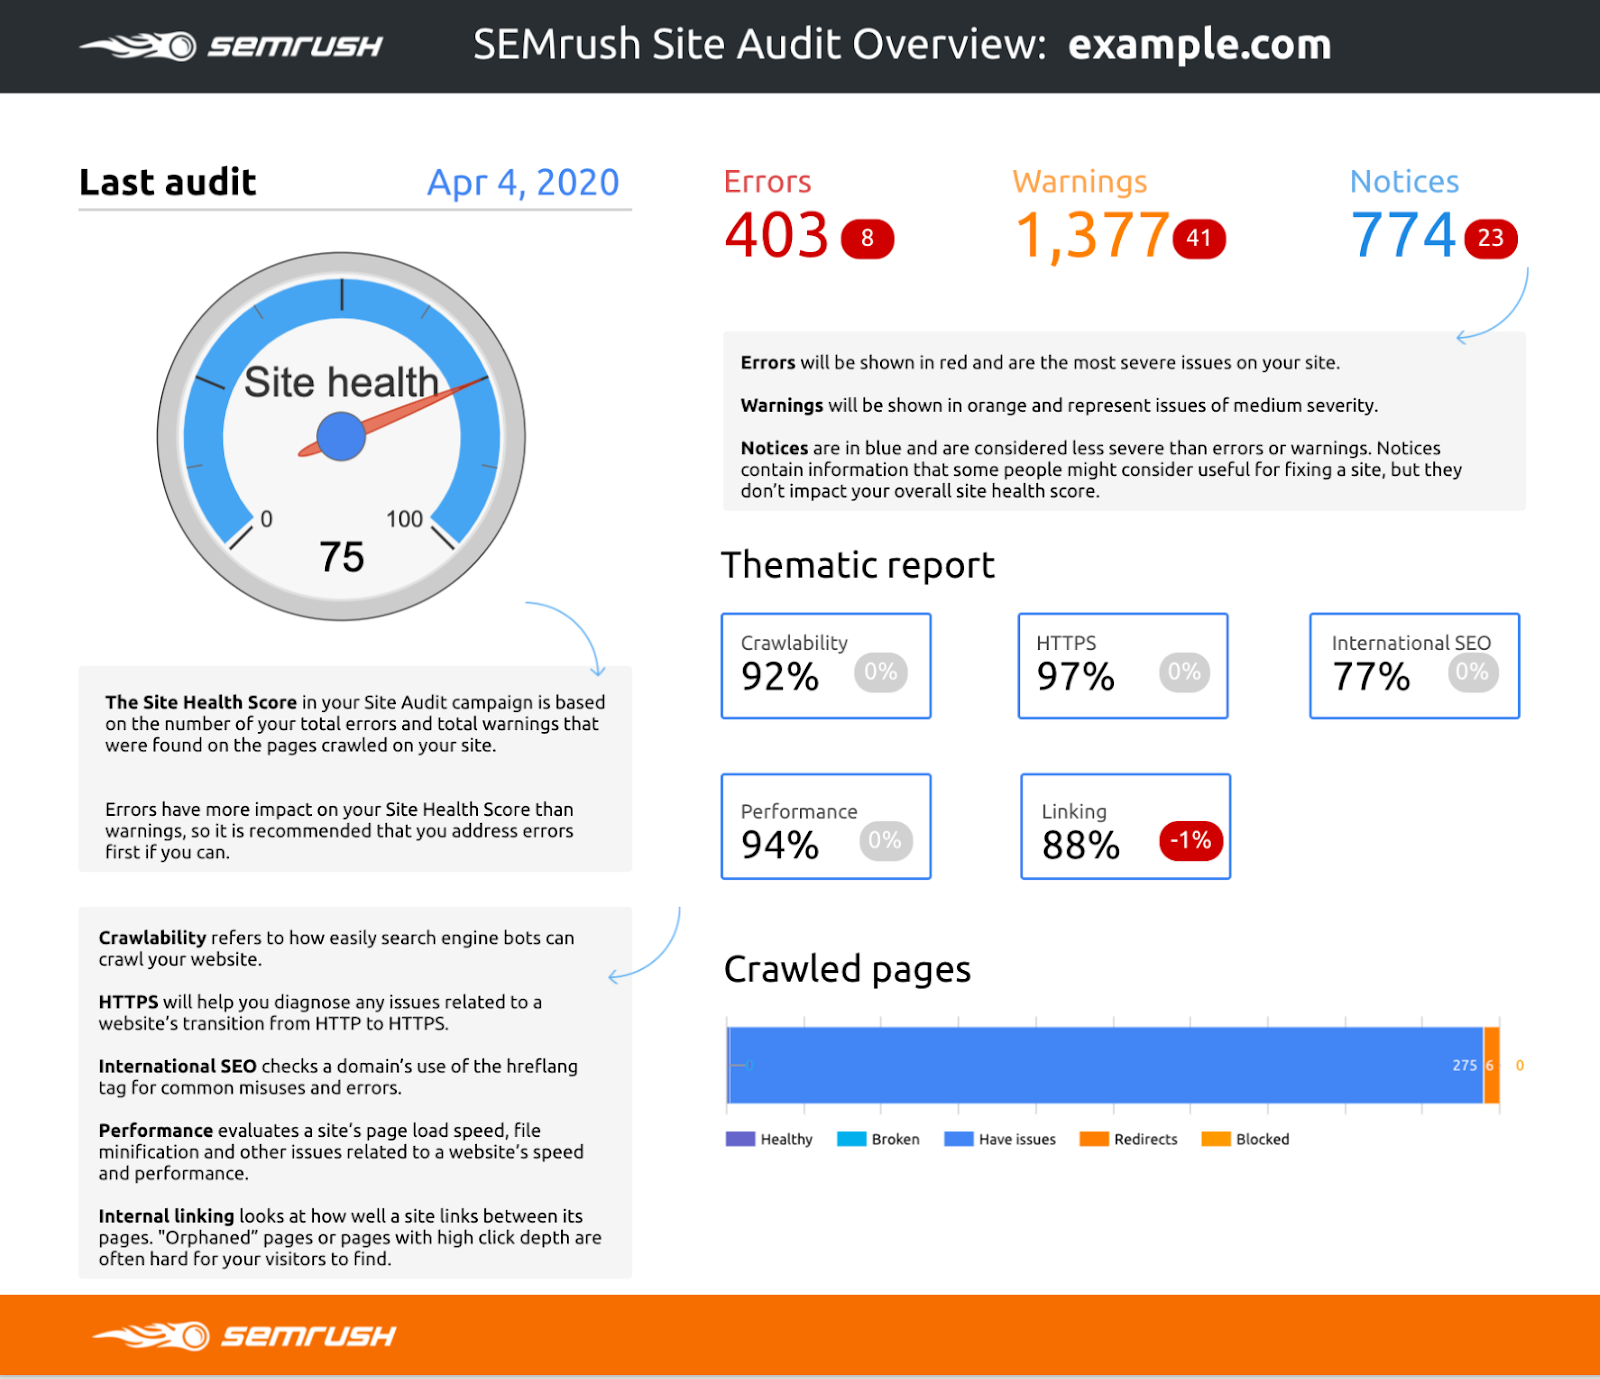
Technical SEO Report
Source: Semrush
The final page of the report provides an overview of a website’s technical health.
Such improvements should be carried out alongside the likes of link building, new content creation and optimization of existing content, since overlooking any or all of these pillars can damage your overall search performance.
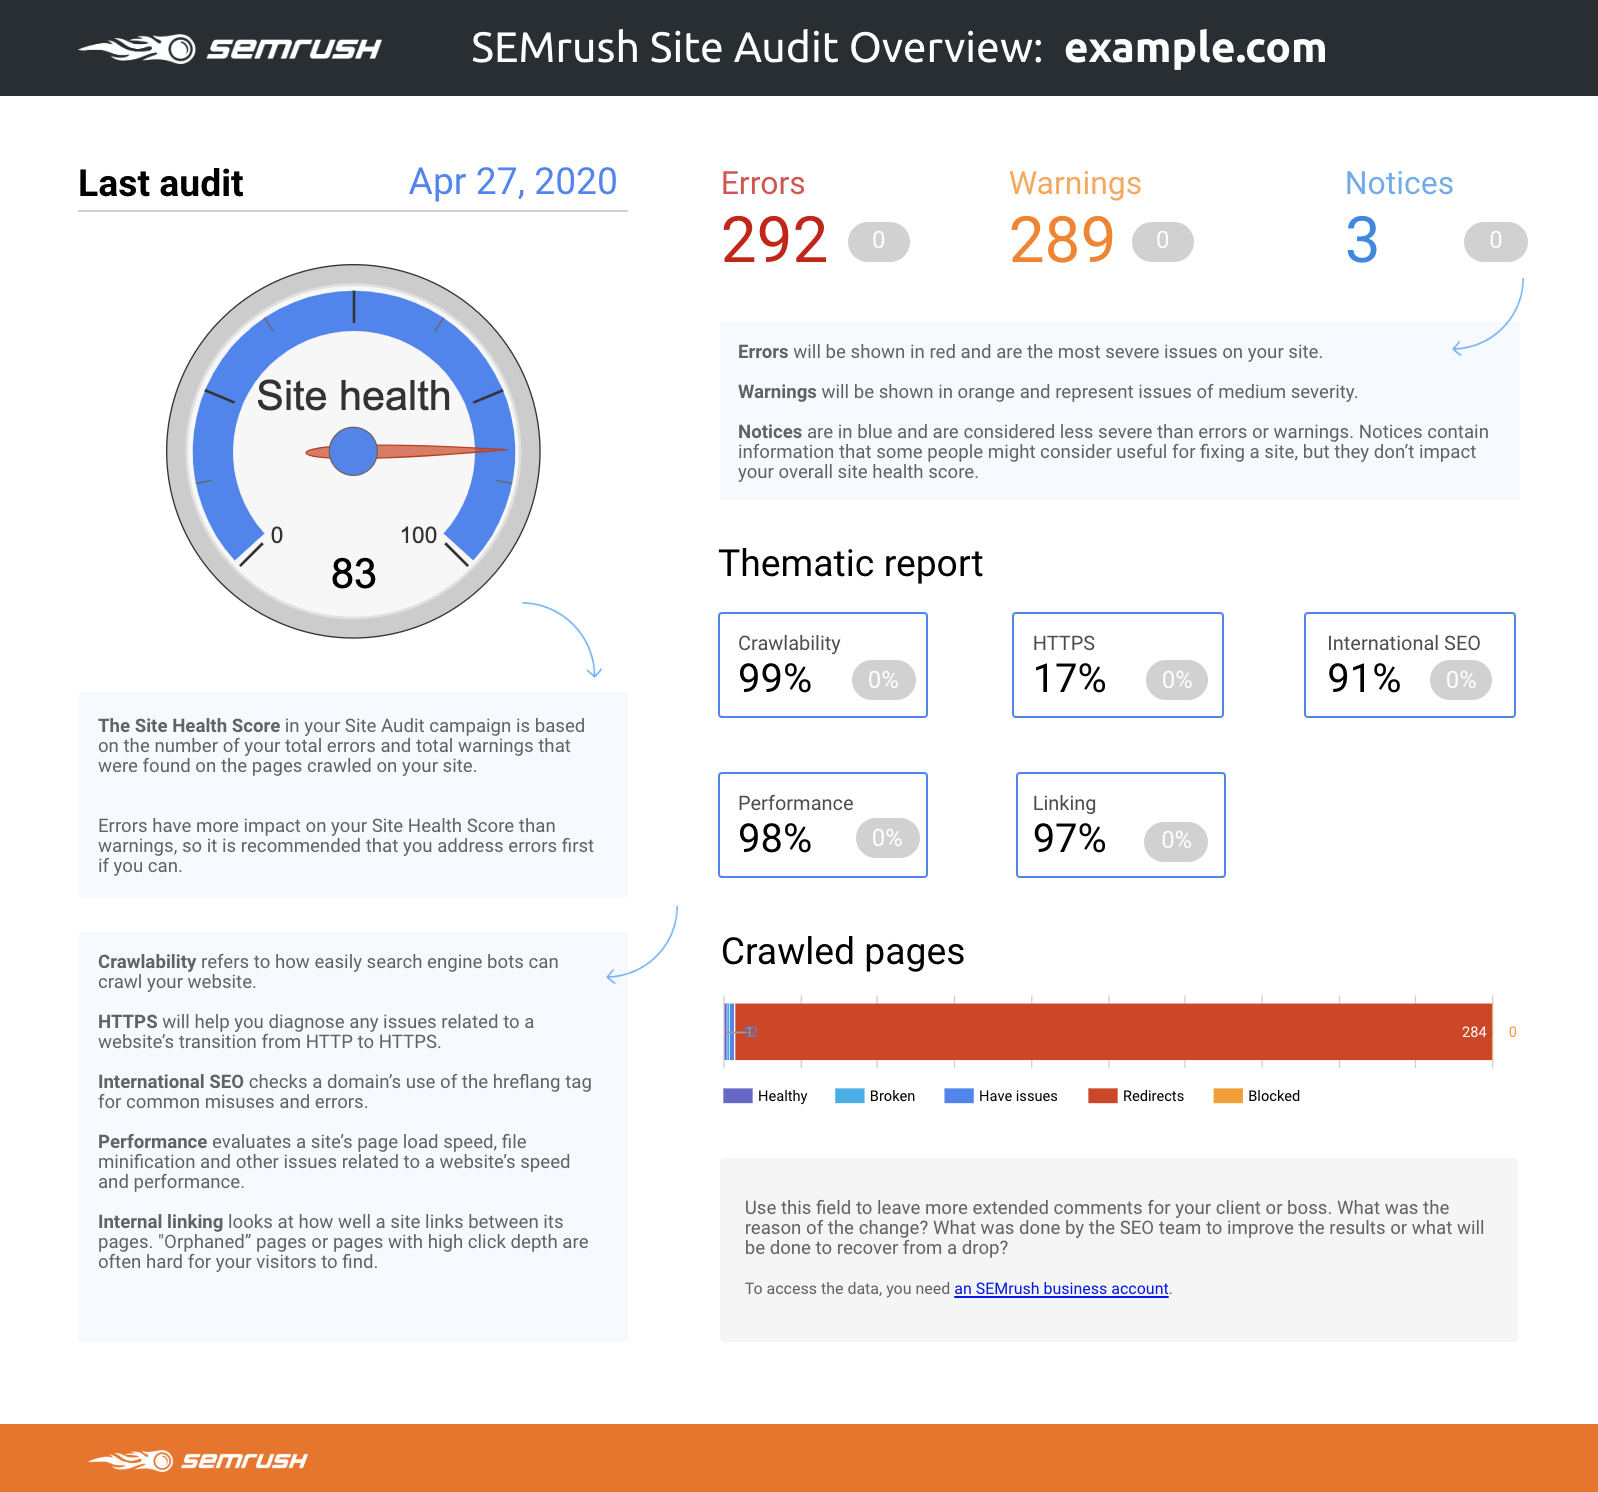
Site health
This is the quickest way to understand where your site stands in terms of technical health. It is the combined metric that takes into account over 130 checks, including everything from broken links to duplicate content.
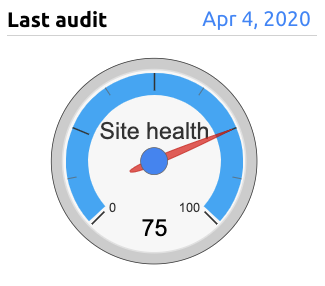
The higher the score, the ‘healthier’ your website is, but remember it’s all relative. If you start with a score of 50 and improvements take you to 75, you are progressing well. If, however, you have been stuck on 75 for several months, you might need to revise your technical SEO strategy.
Errors, Warning, and Notices
All the issues found during the audit are divided and color-coded according to their severity:
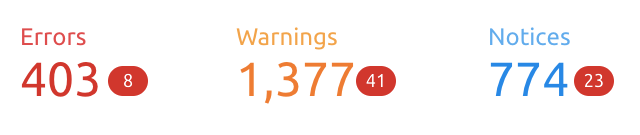
If you see new errors or warnings appearing since your last audit, check for more details under the ‘Issues’ tab in your Site Audit report, along with the recommendations on how to fix them.
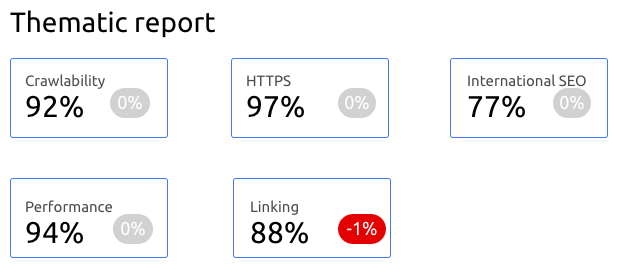
Thematic report
This widget provides a breakdown of issues according to their type:
Crawled pages
This final graph depicts the results for all the audited pages to broadly show you how much needs actioning and how much is healthy.
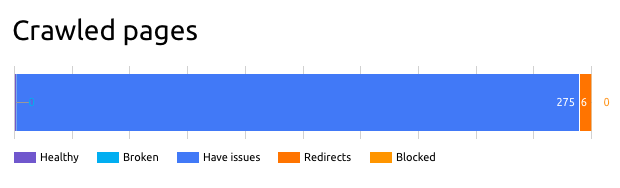
Take note of how many pages are crawled in your audit. You can crawl up to 20,000 pages per project per month with a Guru subscription.
How to Configure the Report for Yourself
Here’s a step-by-step explanation of setting up a Google Data Studio SEO report template for yourself:
Step 1. Add Google Data Studio Connectors
First of all, add all data sources to Google Data Studio to ensure that all data will be pulled to your report when you copy the template.
To add Semrush data to your report, you need a Guru subscription to Semrush. Be sure to authorize your Google account and Semrush account to access data and add it to Google Data Studio.
Use the following links to find the right connectors:
Google Analytics
Google Search Console
Semrush Site Audit
Semrush Domain Analytics
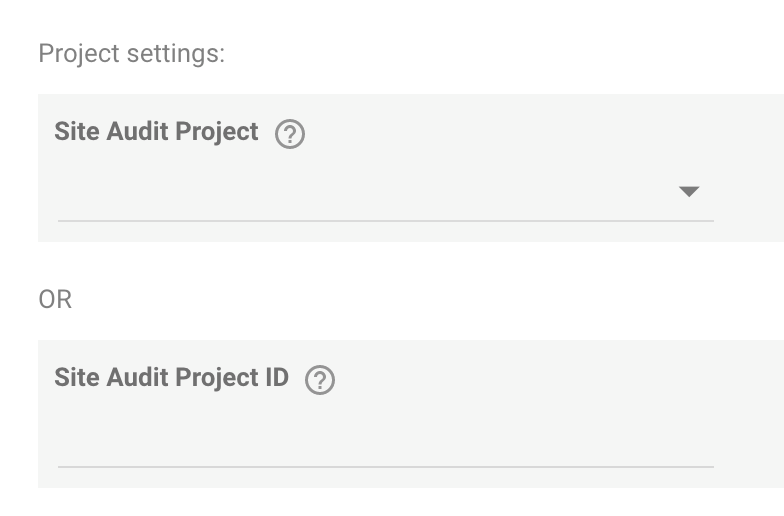
To get data, choose a project that you have created in Semrush. You can do this by selecting the corresponding project by its name or specifying the project’s ID, as follows:
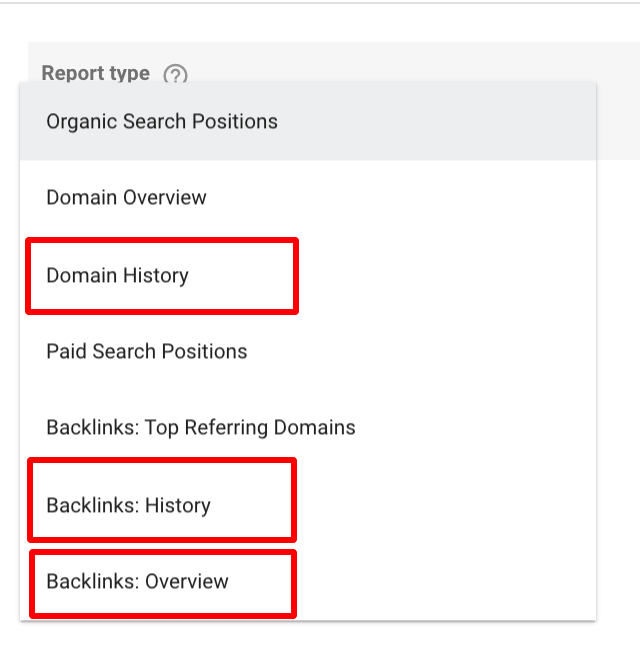
To connect data from Semrush Domain Analytics, specify the Report type. To show the same data as the SEO report, you will need the following:
Domain History
Backlinks: History
Backlinks: Overview
Now, set the parameters. Select a regional database for the Domain History report and a domain you would like to investigate for the three reports mentioned above.
Step 2. Copy the Report and Settings
Next, click the Copy button to copy the template:
You will see the pop-up window where you can select the data sources you need for your report. When copying the template, the Semrush reports will be displayed as Unknown. Since you have already added the right data sources to your account as described in Step 1, all you have to do is simply select the data sources you need in the right-hand side menu New Data Source in the order shown in the screenshot below:
Google Analytics Data Google Search Console Data Backlinks: Overview Backlinks: History Domain History Site Audit Data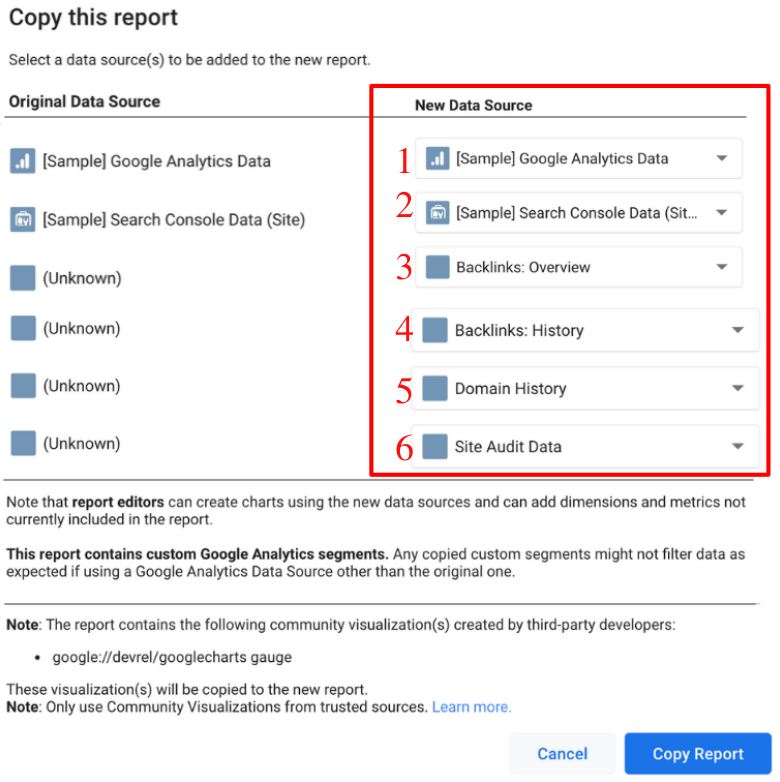
In the bottom-right corner, click Copy Report.
Step 3. Configure Segments and Goals
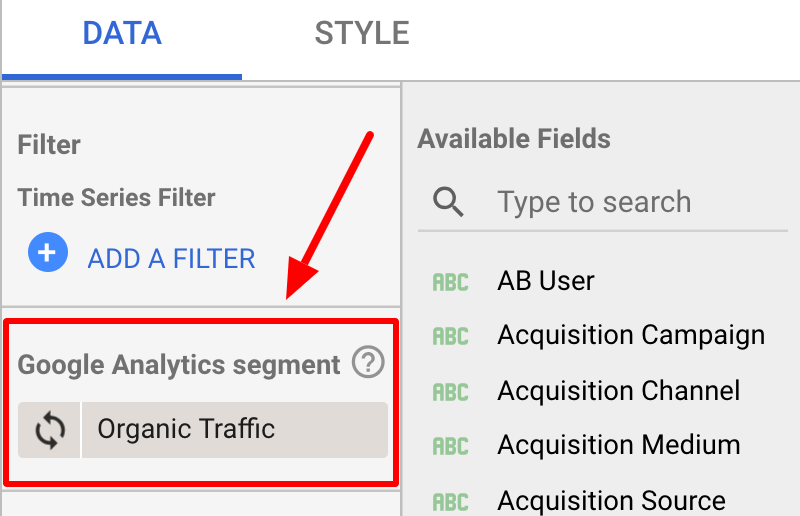
In the report editor, you can switch between the two pages of the SEO report. Data displayed on the first page is pulled from Google Analytics. This part is filtered by the Organic traffic segment.
Please note that we analyze only Organic traffic in the widgets on page one. You can change it in the corresponding field:
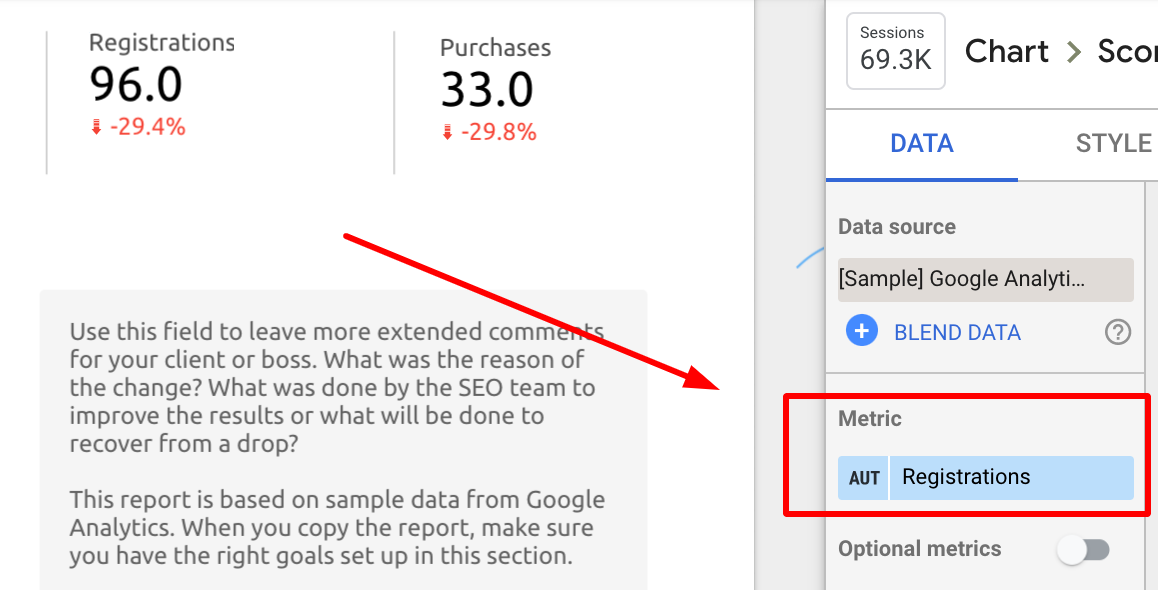
The following part contains information about all goal completions:
You can change how and which goals should be represented in the report in the right-hand side menu:
Step 4. Be Sure to Use the Right Connectors
Data displayed on the second page is pulled from different sources. Below, you can check which Google Data Studio connectors you need to get the corresponding widgets.
Google Search Console:
Semrush Domain Analytics (Domain History Report):
Semrush Domain Analytics (Backlinks: Overview Report):
Semrush Domain Analytics (Backlinks: History Report):
Data displayed on the third page (the Technical SEO Report) are based on data from the Semrush Site Audit reports. To pull this data to Google Data Studio, you need to have created a project in Semrush.
Now that you have a fully customizable SEO report template, you can use it to inform changes to your strategy with your team and your client.
Did we miss anything?
Google Data Studio is one of the most powerful marketing reporting tools. This GDS template is designed to help you speed up the reporting process.
If you think that we missed anything or you would like to see other widgets in the reporting template, let us know in the comments.
Innovative SEO services
SEO is a patience game; no secret there. We`ll work with you to develop a Search strategy focused on producing increased traffic rankings in as early as 3-months.
A proven Allinclusive. SEO services for measuring, executing, and optimizing for Search Engine success. We say what we do and do what we say.
Our company as Semrush Agency Partner has designed a search engine optimization service that is both ethical and result-driven. We use the latest tools, strategies, and trends to help you move up in the search engines for the right keywords to get noticed by the right audience.
Today, you can schedule a Discovery call with us about your company needs.
Source:


