Managing your data visualization is a bit like sorting out your closet: it requires a constant, invisible strategy working in the background to maximize results.
When a t-shirt is tucked away and hidden somewhere in the back corner of your drawer, it’s no use to anyone. Likewise, a set of data that is hard to find or hard to read is practically useless.
We have already introduced our template for Google Data Studio, which can help you quickly set up a report. Still, if you want to go beyond standard reporting with Google Analytics, you need a more in-depth understanding of filters, segments, and dashboards.
This piece will explore how to create an analytics dashboard that can provide immediate and efficient answers to your SEO needs.
What is an Analytics Dashboard? What Do Google Analytics Dashboards Look Like? Why Do You Need an Analytics Dashboard Software? How to Create a Dashboard in Google Analytics What KPIs Do You need in an Analytics Dashboard? How to Set Up Analytics Dashboards (that Work) with Semrush Benefits of an Integrated Analytics Dashboard with SemrushWhat is an Analytics Dashboard?
A data dashboard is a tool that collects and analyzes data, including key performance indicators (KPI), metrics, and other data points that monitor progress over time.
Analytics dashboards help track a marketing campaign or analyze the marketing funnel or your website’s traffic and conversions and evaluate your business’s overall health status.
A dashboard can answer a clear set of questions that you can choose based on your business goals. For example:
What are the top-ranking keywords on the website? What are the traffic sources to the website? Has there been an increase/decrease in searches? Why? Are there any technical issues hurting the website’s visibility? Which search engine do users prefer for navigating the website? Do you need a more mobile-friendly website?You will likely need new (or more) dashboards when your goals change.
What Do Google Analytics Dashboards Look Like?
Simply put, dashboards in Google Analytics are a collection of widgets that allow you to clearly visualize a set of data from a particular property on your account. A Google Analytics’ widget is a mini-report — a specific template with metrics, tables, and charts that allows you to navigate your data efficiently.
Here’s what a basic Google Analytics dashboard looks like:
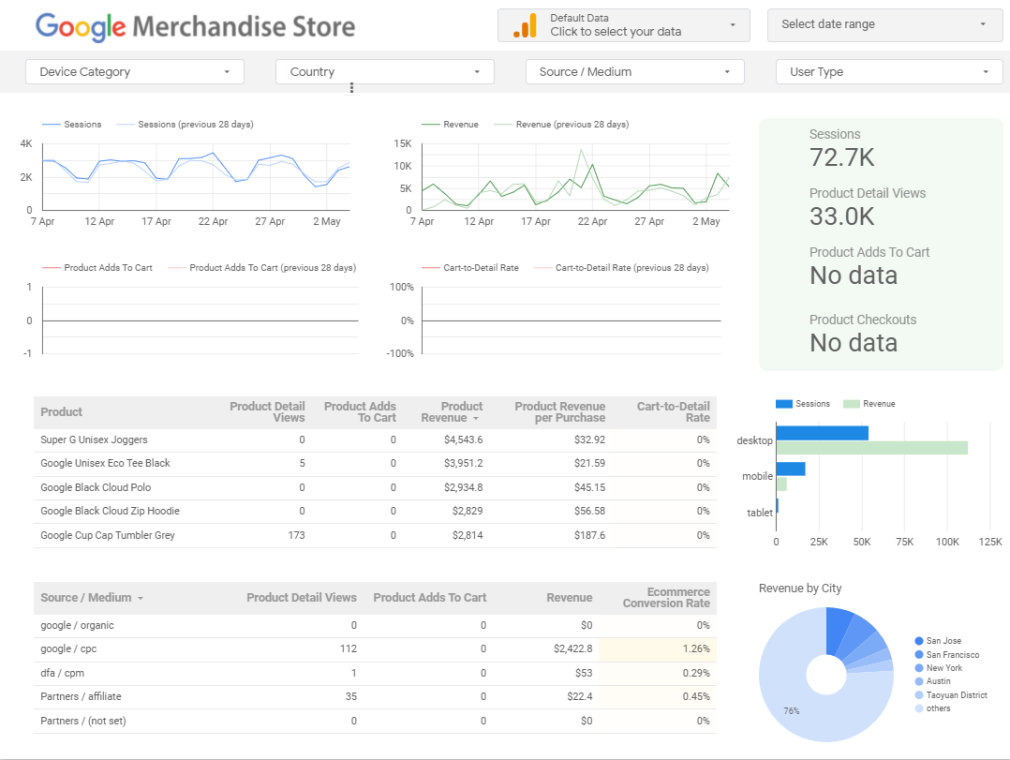
As is apparent from the example above, Google Analytics dashboards create visual shortcuts to the data that you want easy access to, within the multitude of the available information in your Google Analytics account.
Why Do You Need an Analytics Dashboard Software?
The variety of information available in Google Analytics can provide you with valuable data to make informed decisions when optimizing your website, campaign and marketing strategy.
Details about organic traffic can inform you of a variety of things. As a website manager, you are concerned with getting traffic and, more importantly, about how and why it converts to sales. By answering these questions, you will be able to achieve your business goals.
However, digging into Google Analytics reporting to find the data you are looking for can be a time-consuming task that most SEO beginners find overwhelming. We’re here to help.
Our tools offer even more flexibility than using Google Analytics alone, as they can help you collect and combine SEO data with ads performance tracking from your Facebook and Google Ads accounts and more.
You will then be able to create your own dashboards with a user-friendly interface, featuring drag-and-drop widgets from all these connections.
How to Create a Dashboard in Google Analytics
Just as you can have multiple properties linked to the same Google Analytics account, you can also have multiple dashboards. Widgets within the dashboard are also highly customizable. With all these tools at your disposal, it can be challenging to know where to begin. We recommend starting with our beginner’s guide to Google Analytics before moving forward.
Here’s how you create a custom dashboard in Google Analytics:
Log into Google Analytics, expand Customization in the left-side menu and then click on Dashboards. Click on the Create button in the main view.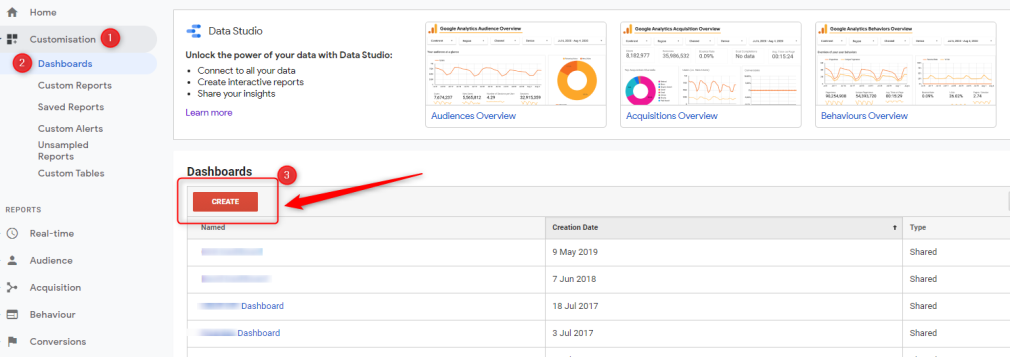
3. Choose Blank Canvas from the pop-up menu, write out your chosen name for the new dashboard and click on Create Dashboard.
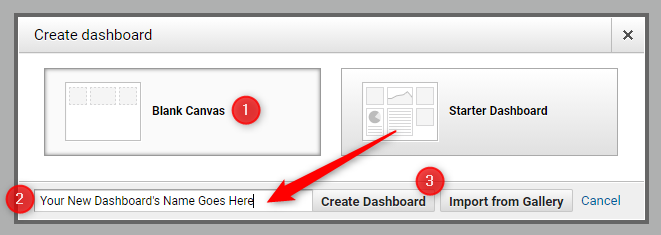
With this blank canvas (literally), you can now start managing and customizing widgets to build your customized dashboard. As we mentioned, every widget is a mini-report that will appear on your dashboard.
4. Click on +Add Widget to add a new widget to the dashboard.
5. Choose your preferred data visualization option (timeline, geomap, table, etc.)
6. Add all the metrics you want displaying in that particular widget.
7. Save the widget and repeat all the steps for a new one until you have a complete dashboard.
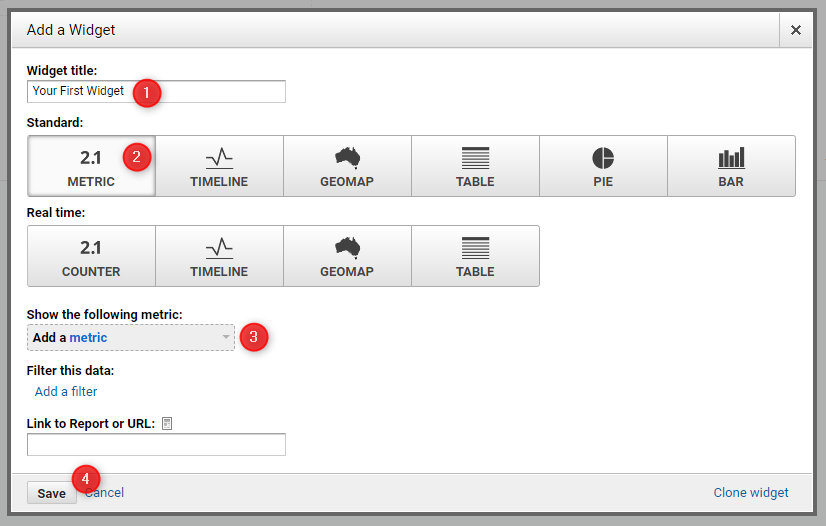
To create an efficient dashboard in Google Analytics from scratch, you will need to know how to navigate the numerous metrics and filters. You might consider this overwhelming as it requires advanced knowledge of reports and widgets.
A more intuitive approach is to use our prebuilt dashboard template and, of course, Google Data Studio connectors.
What KPIs Do You need in an Analytics Dashboard?
There is no set rule on what you need, or don’t need, in your dashboard. Explore your business goals and choose which KPIs can better support you with tracking your website performance.
For reference, here are some possible KPIs matched with relevant business goals:
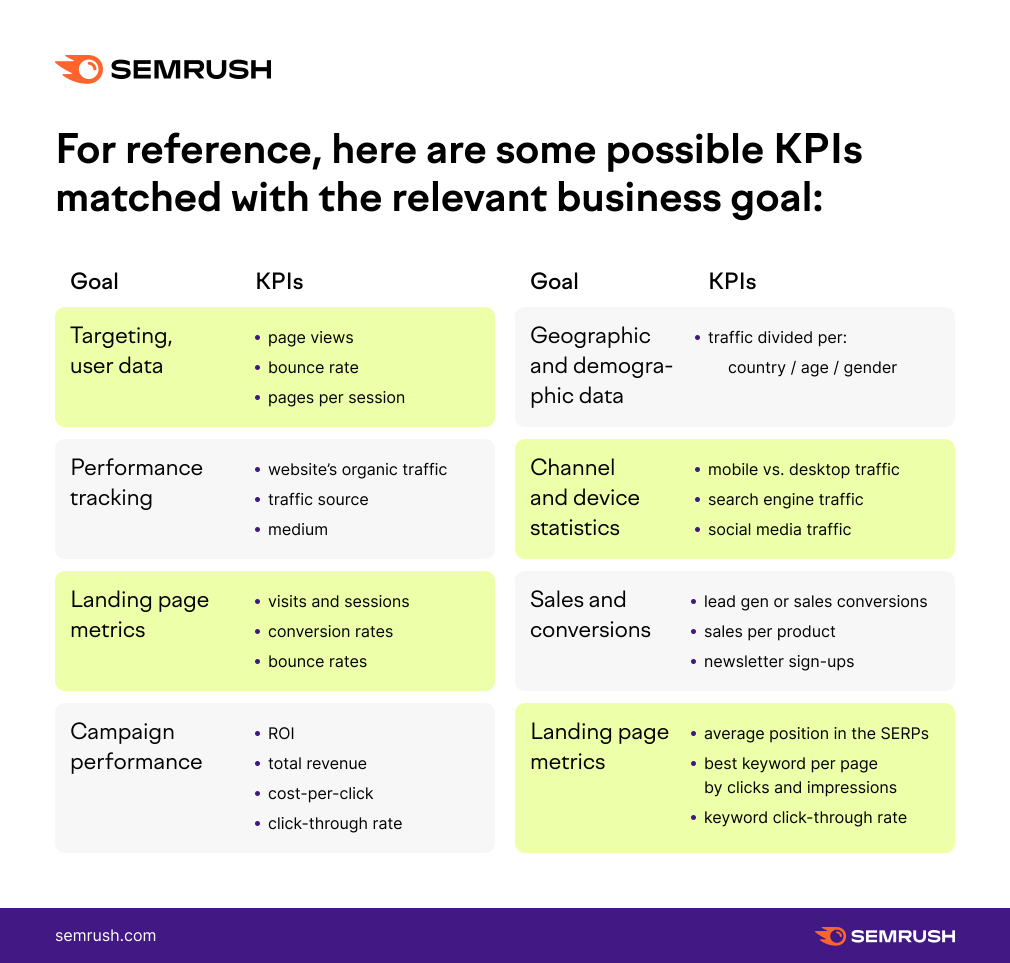
Even though this process can take some time, you should now have plenty of great dashboard ideas. Semrush is your one-stop shop for all the Analytics dashboard features you might need, with easy and straightforward access to your most relevant KPIs. Add Semrush data into your GDS reports and easily create custom dashboards.
Further reading: Essential Marketing KPIs for Agencies and Businesses
How to Set Up Analytics Dashboards (that Work) with Semrush
Performance analysis needs standard and consistent metrics shared across all the platforms you use to track your website. The Semrush tool offers integration with many data points, namely Google Analytics, Search Console, Google Data Studio and more.
When these data sources are connected, the software will automatically pull in data from the various platforms and combine it in a single dashboard.
Via connectors, Semrush will fetch your data from all platforms like Google Sheets, Google Ads, Google Analytics, and so on. Some of the connectors are free and provided by Google; Data Studio partners build others.
The three primary data sources (i.e. connection points) in Semrush are Domain Overview, Position Tracking, and Site Audit.
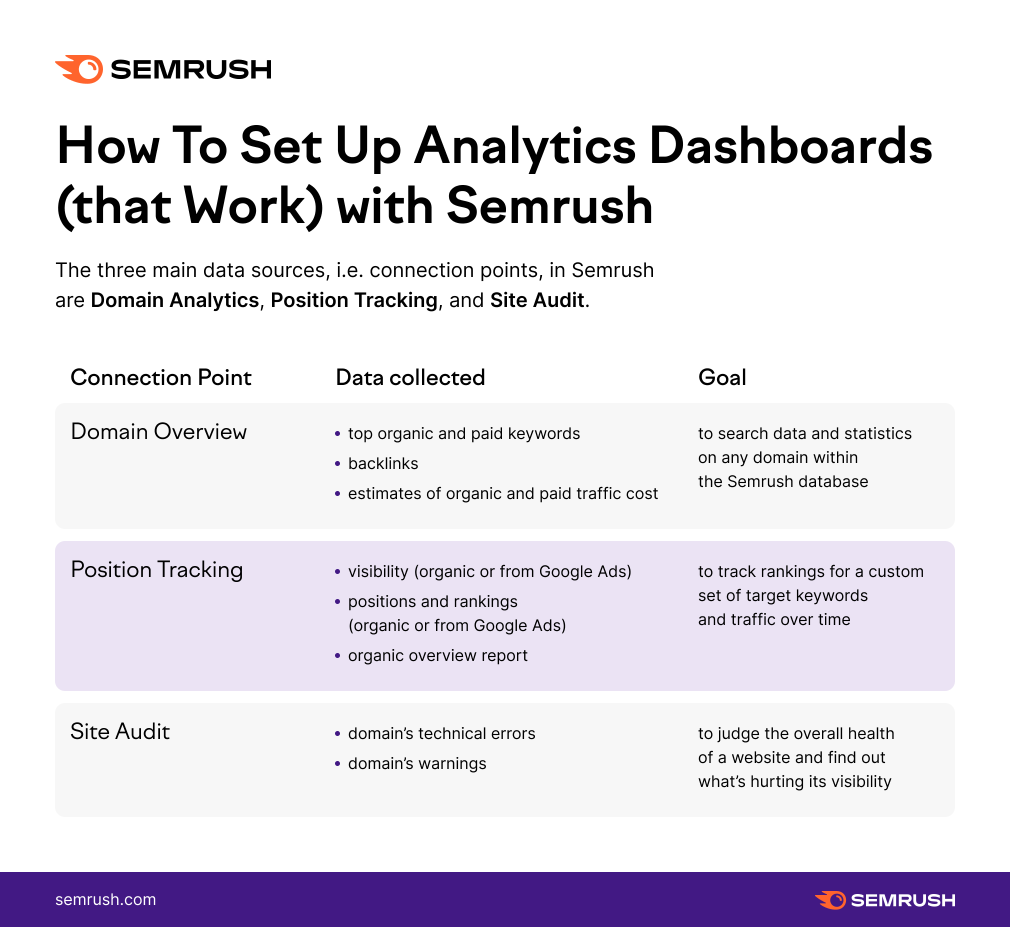
Connect Data Sources to Google Data Studio
To get started constructing your Semrush reports within GDS, you need to authorize the data sources. You can start by configuring the connection to GDS from both your Google and Semrush accounts.
Once the access is authorized, you can start adding data to GDS.

Select a project you already created in Semrush by its name or ID, then specify the report type and set the parameters. The analytics dashboard of your dreams is just a few steps away!
Customize Your Dashboard: Domain Analytics & Position Tracking
Once you’ve authorized both of these sources, you can proceed with setting the parameters of your report. The parameters can change for each connection:
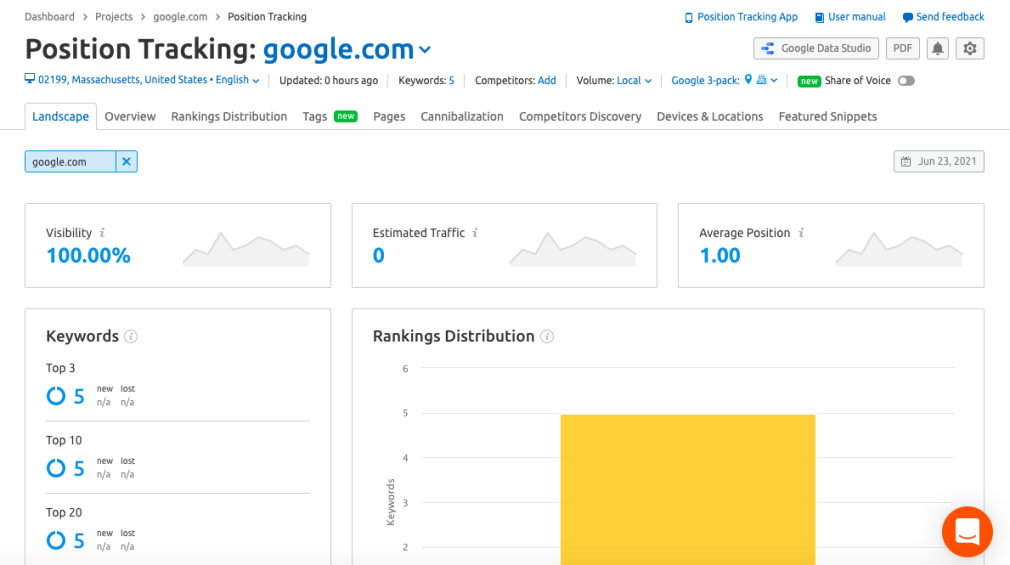
Domain Analytics’ parameters are Report type, Database, Domain, Target type. Position Tracking’s parameters are Report type, Position Tracking, Campaign ID, Domain, Domain type, Business name, Filter by keyword or tags, Display limit.You can find more information in the relevant section of our manual.
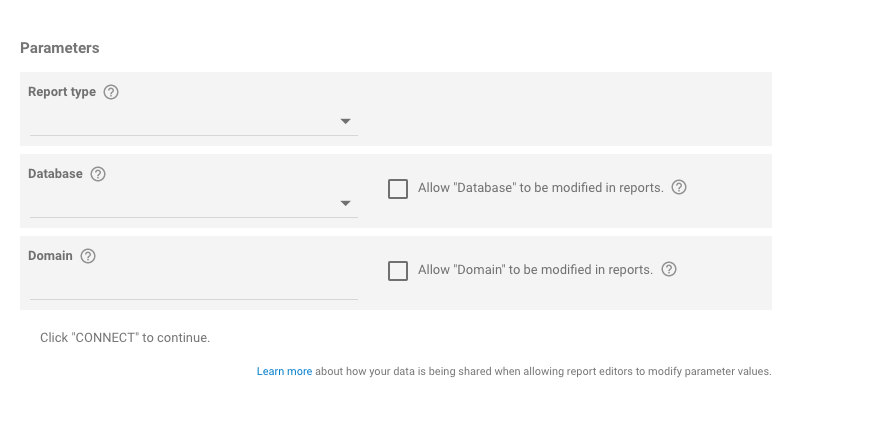
After selecting the parameters and completing all the fields, click Connect to continue. You will then arrive at the next step to customize and re-arrange your columns and truly dive into your analytics dashboard customization.
Select Create Report, and you will be redirected to the Data Studio report builder, where you can manually create the report that best suits your KPIs and business goals. Your configured connection makes Semrush’s data available as any other data source.
Example Domain Analytics Report
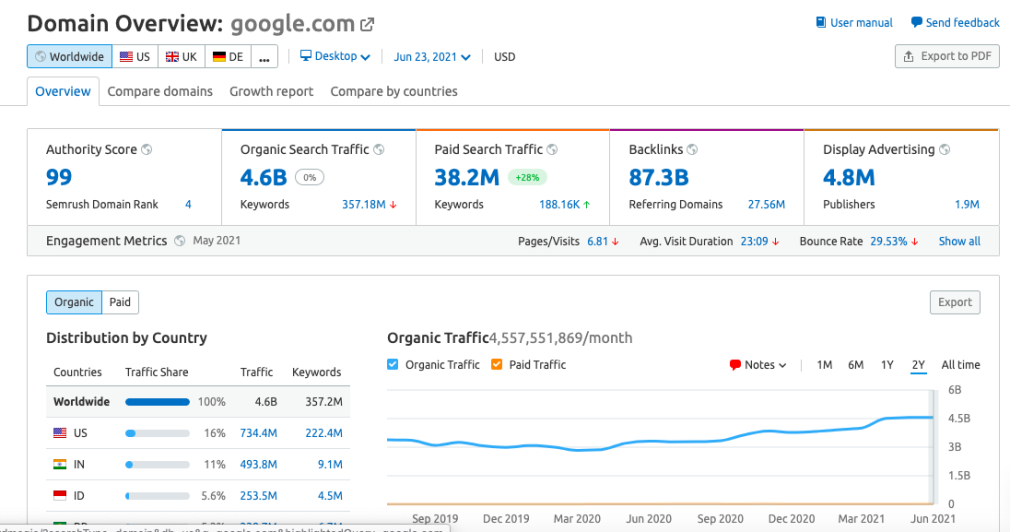
Example Position Tracking Report
Customize Your Dashboard: Site Audit

You can use an analytics dashboard to track many metrics, including the health of your website. Even the best marketing strategy can suffer due to technical issues that actively hurt your visibility. This dashboard will target precisely these issues.
To set up the Site Audit connection, you need to have a Site Audit project in Semrush already. Once you configure and run your Site Audit, you can the issues found on your website, usually divided into 5 groups:
Crawlability Performance Linking (internal and external) International SEO (use of hreflang) HTTPS (security)As per the parameters in the first two connections, once you choose which issues you always want to have at your fingertips in your report, click Create report.
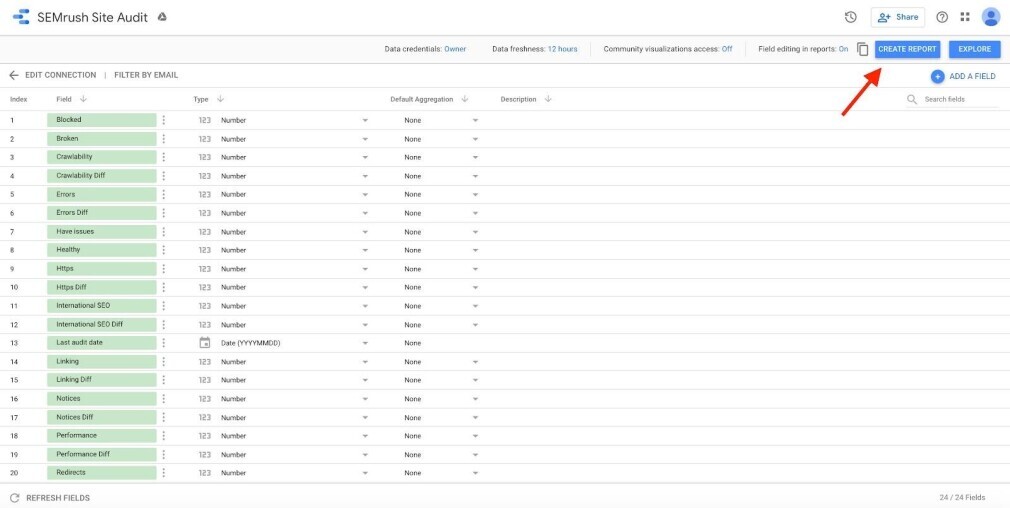
Explore our Site Audit example report
Benefits of an Integrated Analytics Dashboard with Semrush
An analytics dashboard is one of the most powerful tools a marketer or a website owner can have. To sum up the benefits, here’s a short recap of what you can do with Semrush’s data dashboard features:
Monitor multiple KPIs and SEO metrics in one dashboard to optimize your website in real-time. Exploit the interactive data visualization to customize dashboards and reports and adapt to changing KPIs. Easily access and visualize your data dashboard with beginner-friendly tables, maps, line and bar charts. Share your dashboard with colleagues for enhanced teamwork in virtual work environments. Enjoy efficient and automatic reporting, create live reports or PDFs to send out to clients with a straightforward click.The final added value of Semrush’s Analytics dashboard is its variety of data sources.
So, forget big and tedious excel tables, easily connect all your platforms and accounts, and start optimizing today!
Innovative SEO services
SEO is a patience game; no secret there. We`ll work with you to develop a Search strategy focused on producing increased traffic rankings in as early as 3-months.
A proven Allinclusive. SEO services for measuring, executing, and optimizing for Search Engine success. We say what we do and do what we say.
Our company as Semrush Agency Partner has designed a search engine optimization service that is both ethical and result-driven. We use the latest tools, strategies, and trends to help you move up in the search engines for the right keywords to get noticed by the right audience.
Today, you can schedule a Discovery call with us about your company needs.
Source:


