

If your site is slow, you are losing business. It is as simple as that.
In Google’s own words, “ speed equals revenue.”
The speed of your website has a direct impact on SEO and conversion rates. Not taking the time to make improvements can be a costly mistake.
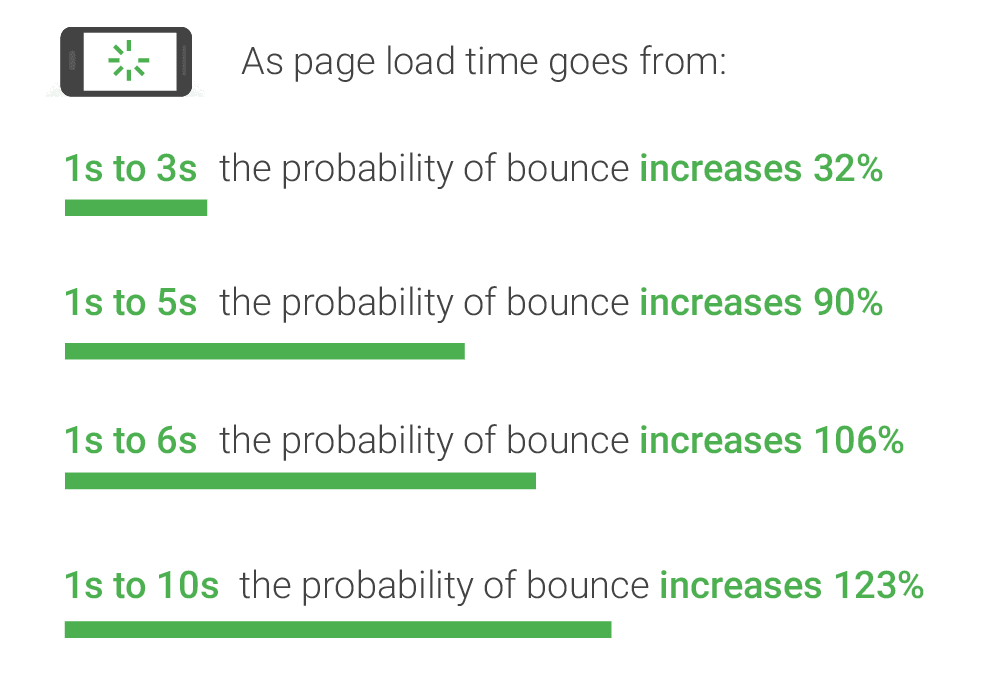
Why? Users are far more likely to bounce from a slow website, and the probability of this happening increases by over 100% if a page load time goes from just 1s to 6s:
There is a real need for speed, and Google’s free PageSpeed Insights tool is a fantastic resource to help you find and fix issues that could be slowing your site down.
Understand how to use the PageSpeed test, how it works, and how to speed up your site using the recommendations. Plus, learn the truth behind a couple of common myths before your competitors do.
Why Speed Matters
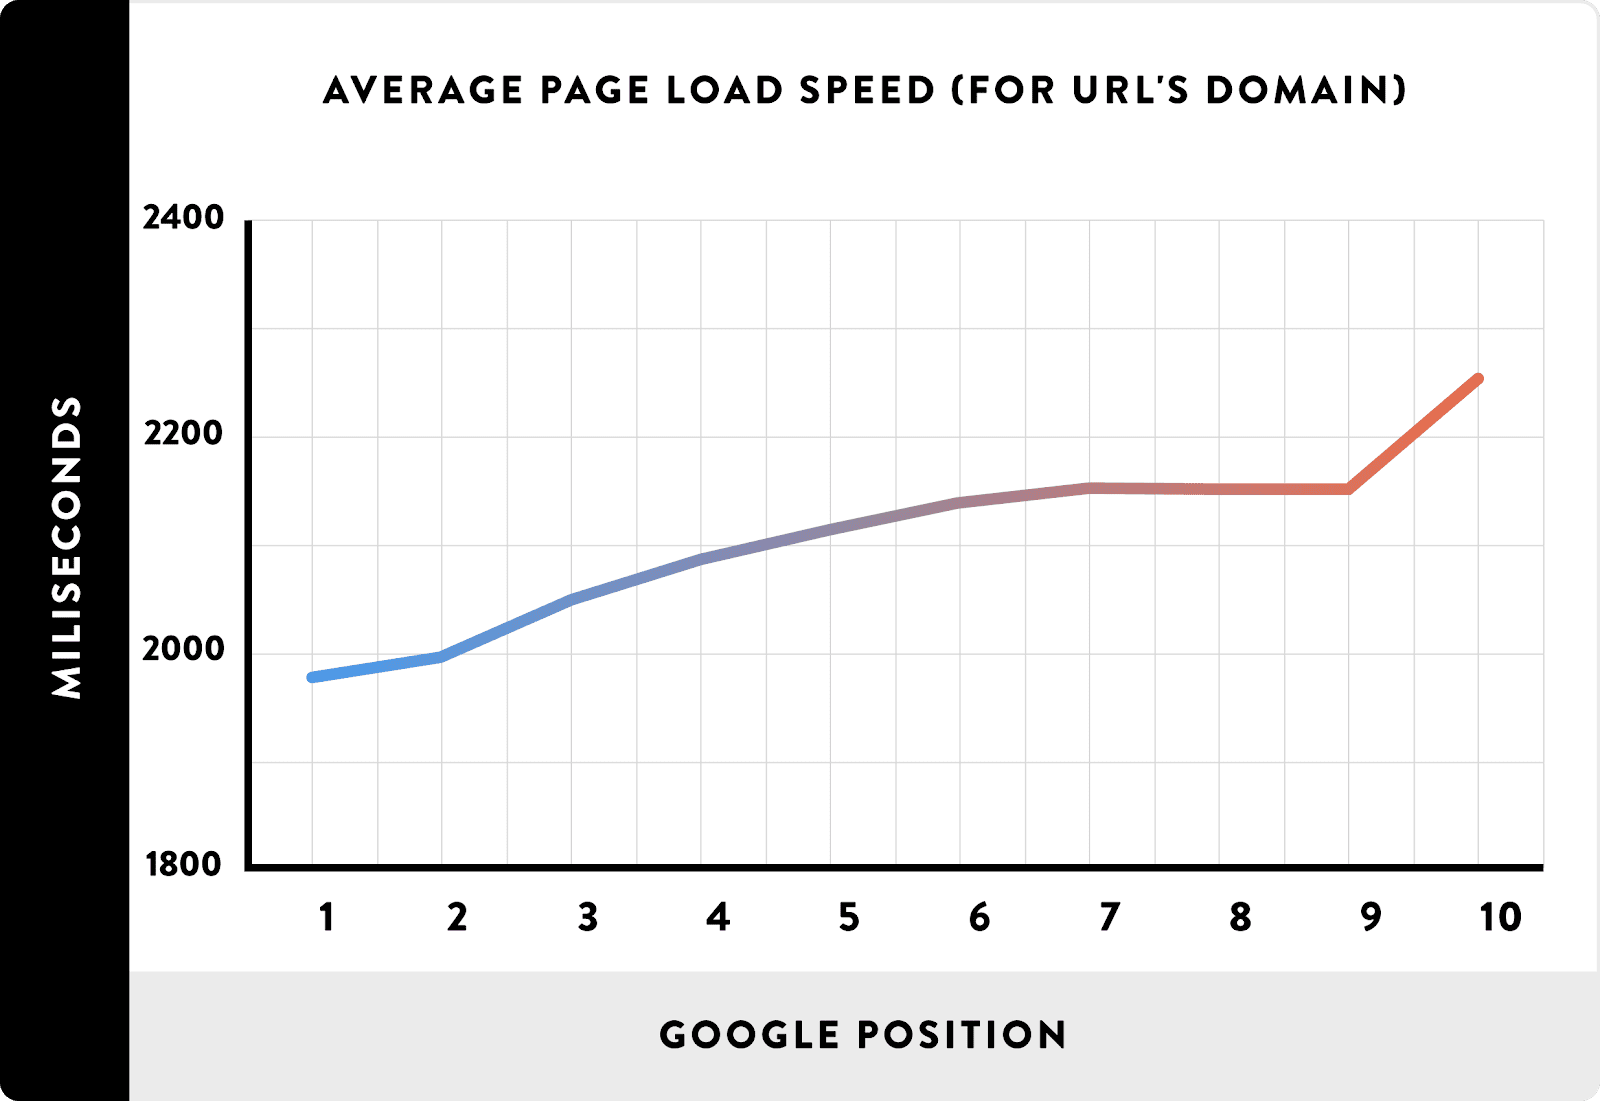
There is an expectation for the web to be fast. As far back as 2010, Google confirmed page speed as a ranking factor. Then, it “was focused on desktop searches,” until a specific mobile PageSpeed update rolled out in July 2018. While speed is one of more than 200 ranking factors, none of us want to unnecessarily lose business. Especially for something usually within our control. In fact, SEO blog Backlinko analyzed 1 million Google search results and found “a strong correlation between site speed and Google rankings.”
 But SEO aside, we have already seen how page bounces increase as the speed of a site slows down. Indeed, a 2019 study by US digital marketing agency Portent showed "conversion rates drop by an average of 4.42% with each additional second of load time (between seconds 0-5)." It also found the first 5 seconds of page load time had the largest effect on conversion rates.
If you’re not already paying attention to speed as a performance metric, now’s the time.
Say Hello to Google’s PageSpeed Insights Tool
PageSpeed Insights is a free tool offered by Google to help you analyze your website’s performance and see suggestions on how to make it better.
In fact, it’s arguably the most popular page speed analysis tool out there, so it’s worth your time.
You’re probably wondering, ‘how can I get a 100/100 score with PageSpeed Insights?’ Slow down. First, you need to know how to use the tool properly and how to implement the suggestions it makes. Otherwise, you might not see those performance gains that can make such a difference to your site. It’s also important to understand what PageSpeed is and what it isn’t.
PageSpeed vs. Load Time
Here’s an interesting one. The Google PageSpeed tool doesn’t even measure the loading time of your site, despite what people assume. To understand why, let’s first address the difference between PageSpeed and page load time.
PageSpeed
PageSpeed is a score given by Google, out of 100, by its PageSpeed Insights tool. PageSpeed Insights, and web page performance tool Lighthouse that powers it, takes raw performance metrics and converts these into a score of between 1 and 100. And although it’ll offer opportunities and diagnostics reports as part of its report, those do not directly contribute towards the performance score. This means that PageSpeed, on its own, is not actually a true indicator of the loading time of a site.
Load Time
So, what is load time, in comparison to PageSpeed?It’s the average time it takes for a page to load for a user. It’s not a calculated score. It’s the actual time a page takes to load, in seconds or milliseconds, between starting and finishing the page load. Of course, load time alone doesn’t give an insight into what’s causing speed issues or how to fix them.
What does this mean for you?
Google PageSpeed Insights can be helpful, but you can't use it in isolation to assess your site's performance. You need to use several indicators to identify and resolve issues.
How Does PageSpeed Insights Work?
The Google PagesSpeed Insights tool is powered by Lighthouse and provides both ‘lab data’ and ‘field data’ for a page.‘Lab data’ is collected in a controlled environment when scanning a page and is a great way to identify performance issues and find solutions for fixing these. ‘Field data’, on the other hand, is collected from real-world performance data when users load your page. Some of the problems and apparent bottlenecks that make it harder for your real visitors to convert can show up here.
In short, the tool shows you a performance score out of 100. However, the performance metric results used to calculate this are not weighted equally. Instead, things like ‘first contentful paint’ (the first time something a user can see shows up) have a larger effect.
3x - first contentful paint.
1x - first meaningful paint.
2x - first CPU idle.
5x - time to interactive.
4x - speed index.
0x - estimated input latency.
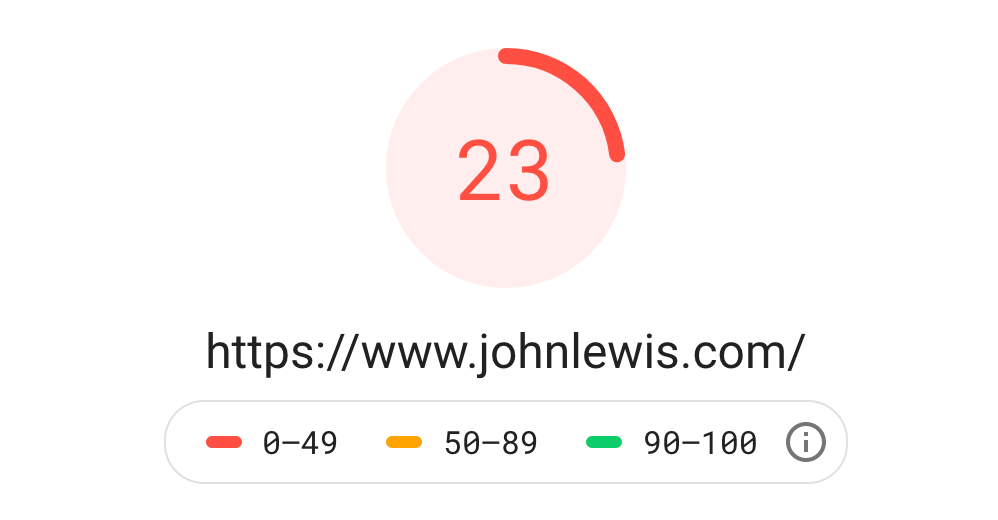
But you won’t see any of that. You will see a reported performance score and a color that depends on which score bucket it falls into. It is reported as:
Red (poor score): 0-49
Orange (average): 50-89
Green (good): 90-100
So, knowing a little more about PageSpeed Insights, what it is, and how its scores are calculated, where do you start?
How to use PageSpeed Insights
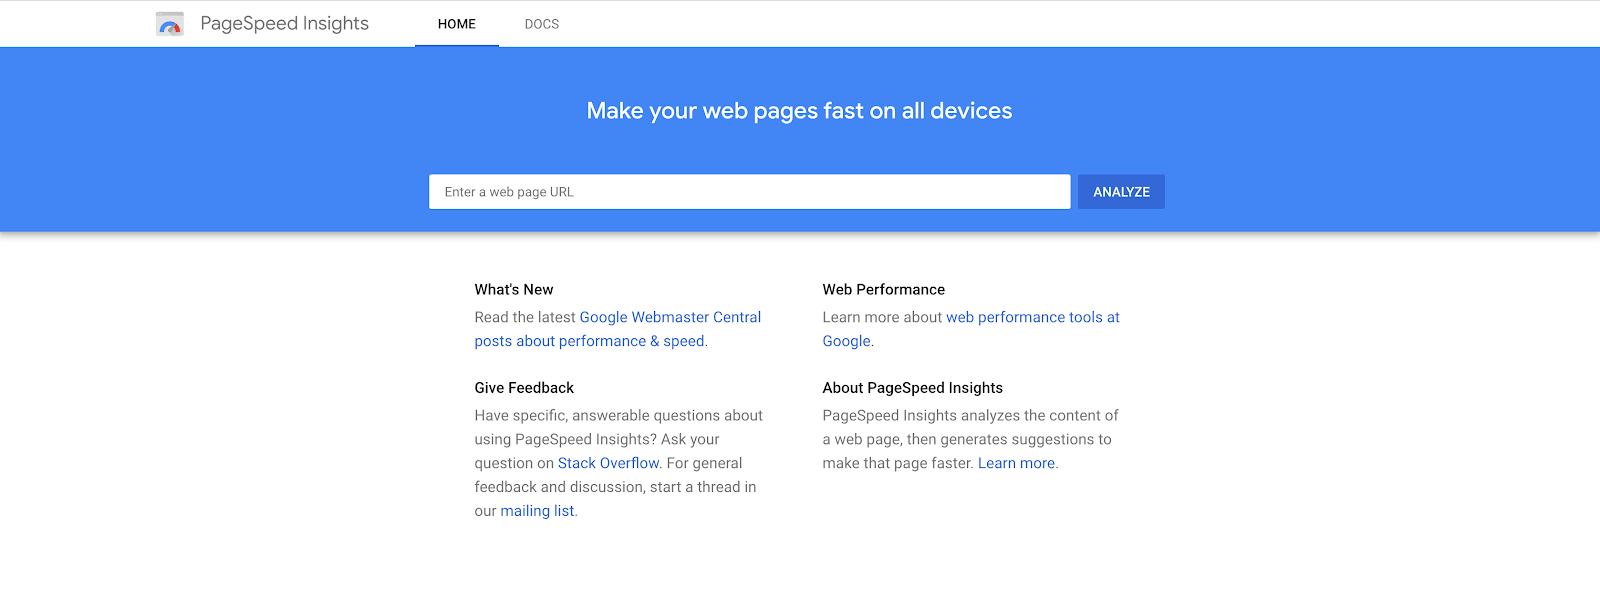
1. Go to the PageSpeed Insights tool:
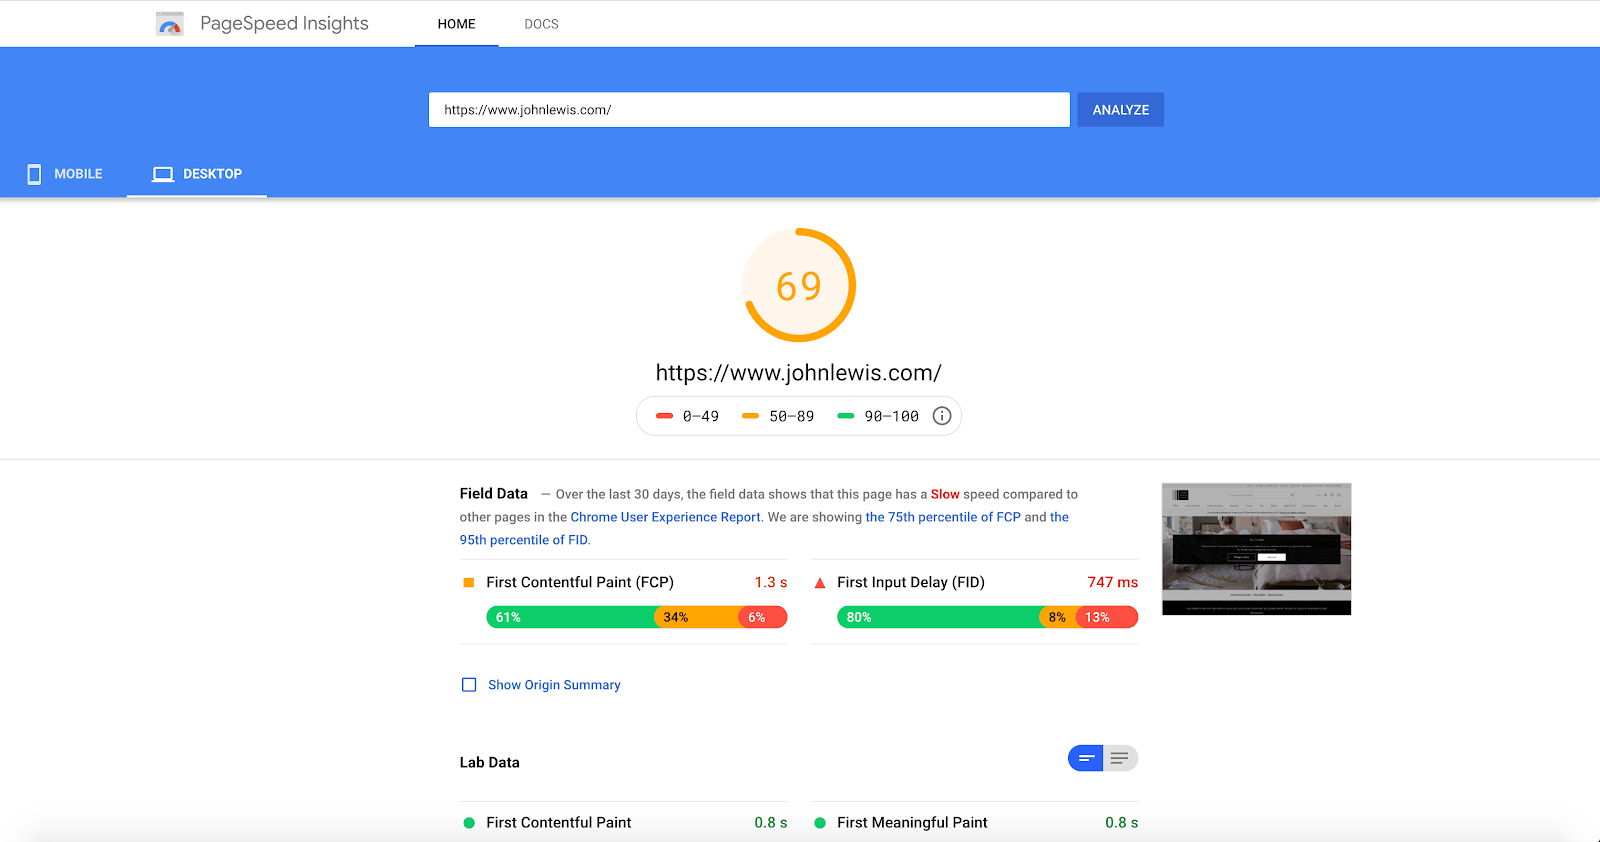
2. Enter the URL of a web page. It doesn’t have to be the root domain/homepage. After the tool calculates the scores and recommendations, you will see the following:
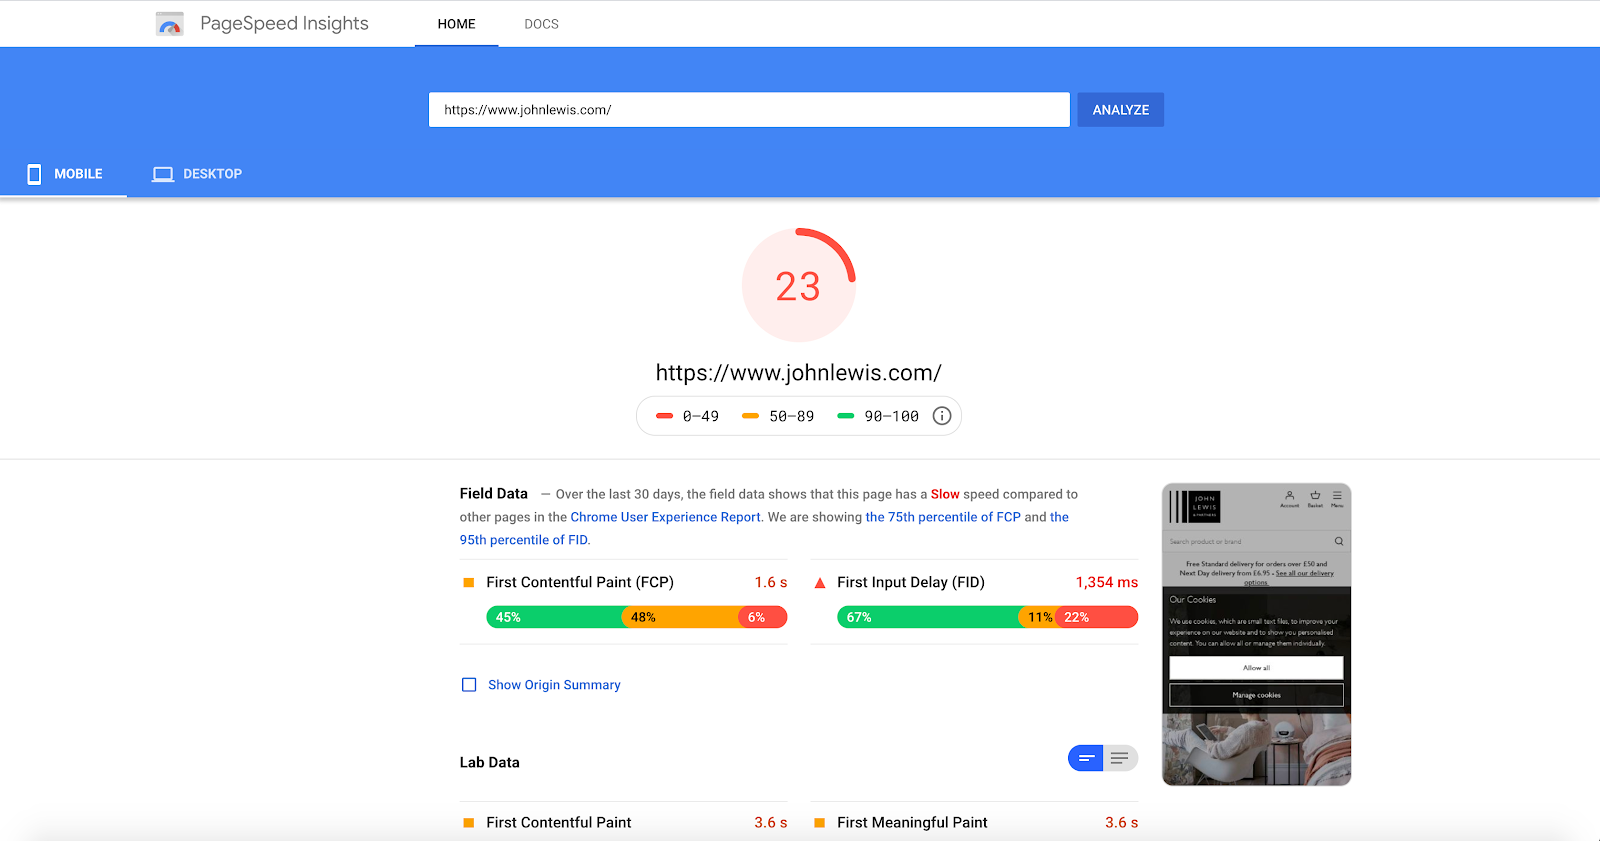
3. Notice you are served performance scores for mobile, as default. You can switch to desktop with the tab at the top left of the page:
To truly understand how to use PageSpeed Insights, you need to know what everything you see means and how to interpret it.
Speed Score
 As explained above, the speed score is a color-coded representation of lots of performance metrics from Lighthouse calculated together. It is a great, quick, but rough speed metric.
On its own, it is not a deep measure of performance, for reasons we discussed earlier. The worse your site’s load time across measured performance metrics, the higher your speed score will be. Be sure to compare your speed score for both mobile and desktop.
Field Data
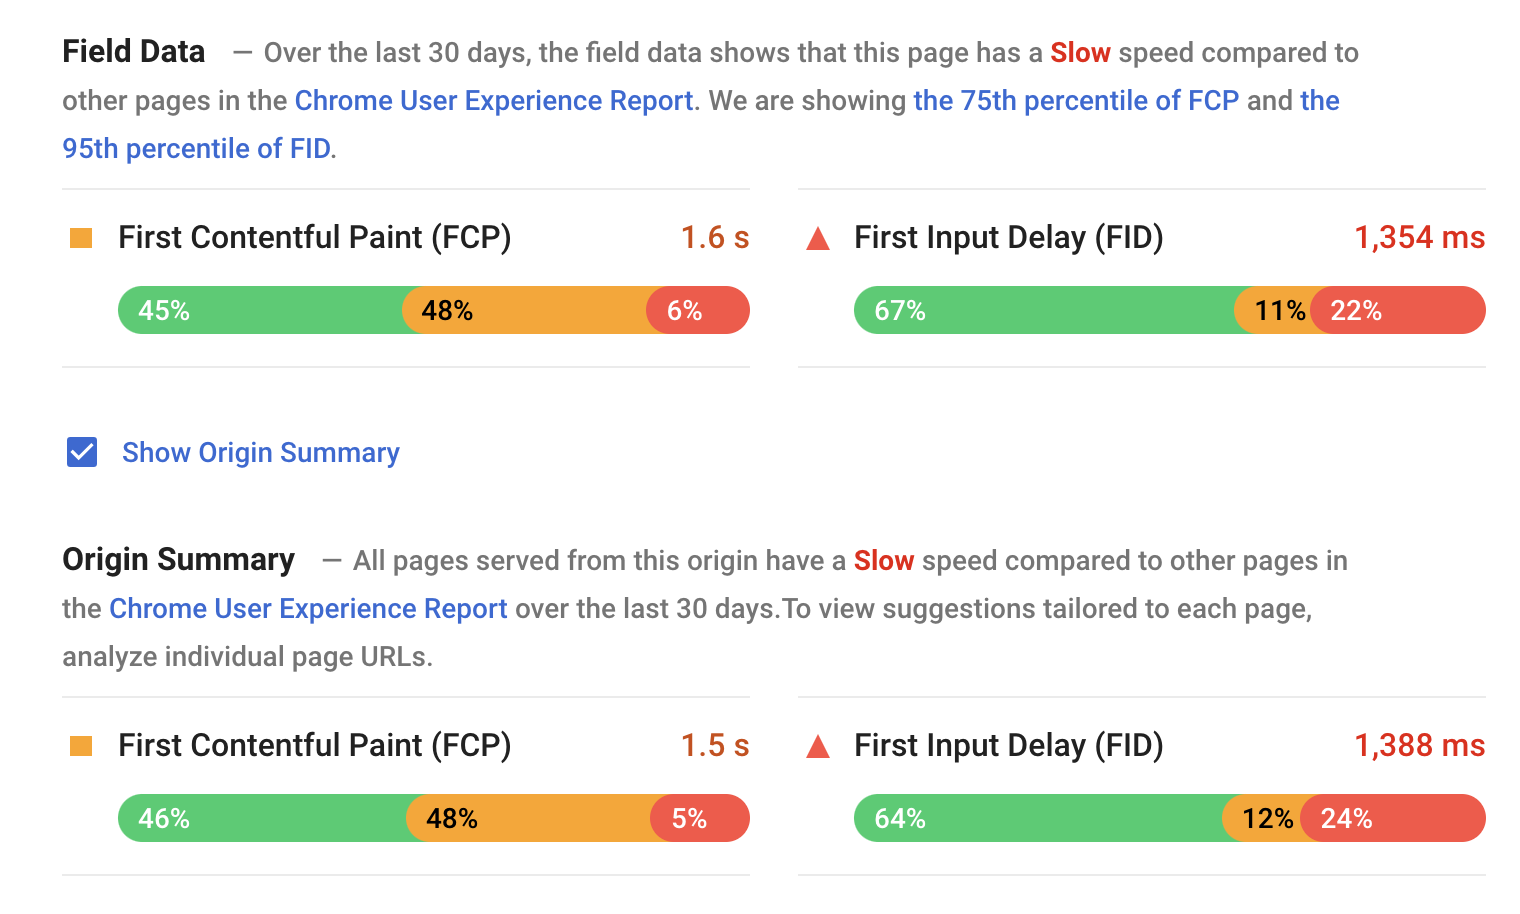
'Field data’ reports how the page has performed over the last 30 days when compared to others in the Chrome User Experience Report - which is a pool of performance metrics gathered from some users of Google's Chrome browser.
If available, you will also be able to view a summary for the origin, as well as the specific URL you are testing. Essentially, this allows you to see a comparison between a specific page and all pages from the origin.
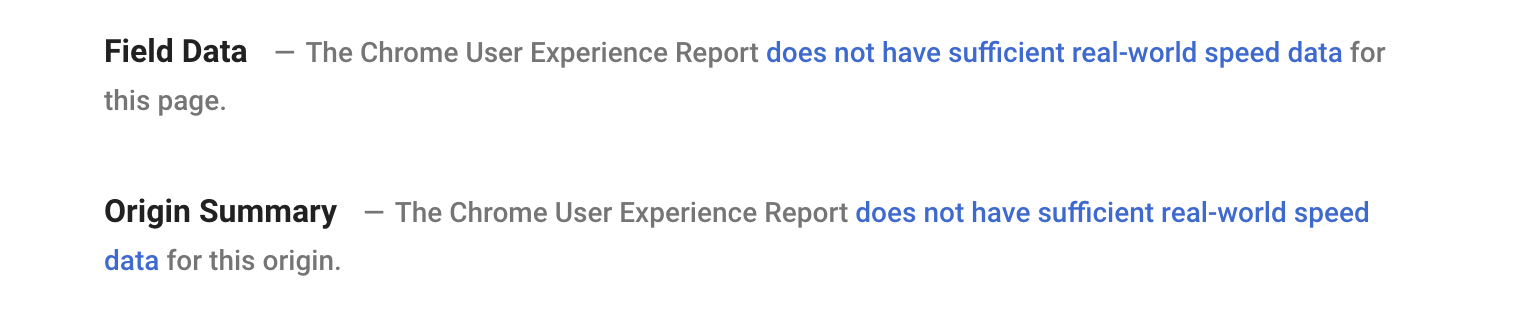
It is important to know that field data is aggregated from actual users on Chrome. But there might not be enough data for the URL you entered. If that is the case, you will only be able to view ‘lab data’.
First Contentful Paint (FCP)
This measures the time expended from navigation to the page to the time when the first bit of content is rendered from the DOM. It is the first milestone to show that a page is starting to load. FCP reports the speed of getting to this point.
First Input Delay (FID)
This is a key metric for measuring load responsiveness, given that it quantifies how quickly the page responds to a user’s input, such as a mouse click.
A low FID suggests a page is usable sooner. Whereas, since FCP measures how quickly a page starts to load, it gives an indication as to a user's first impression when actually interacting with a page.
Lab Data
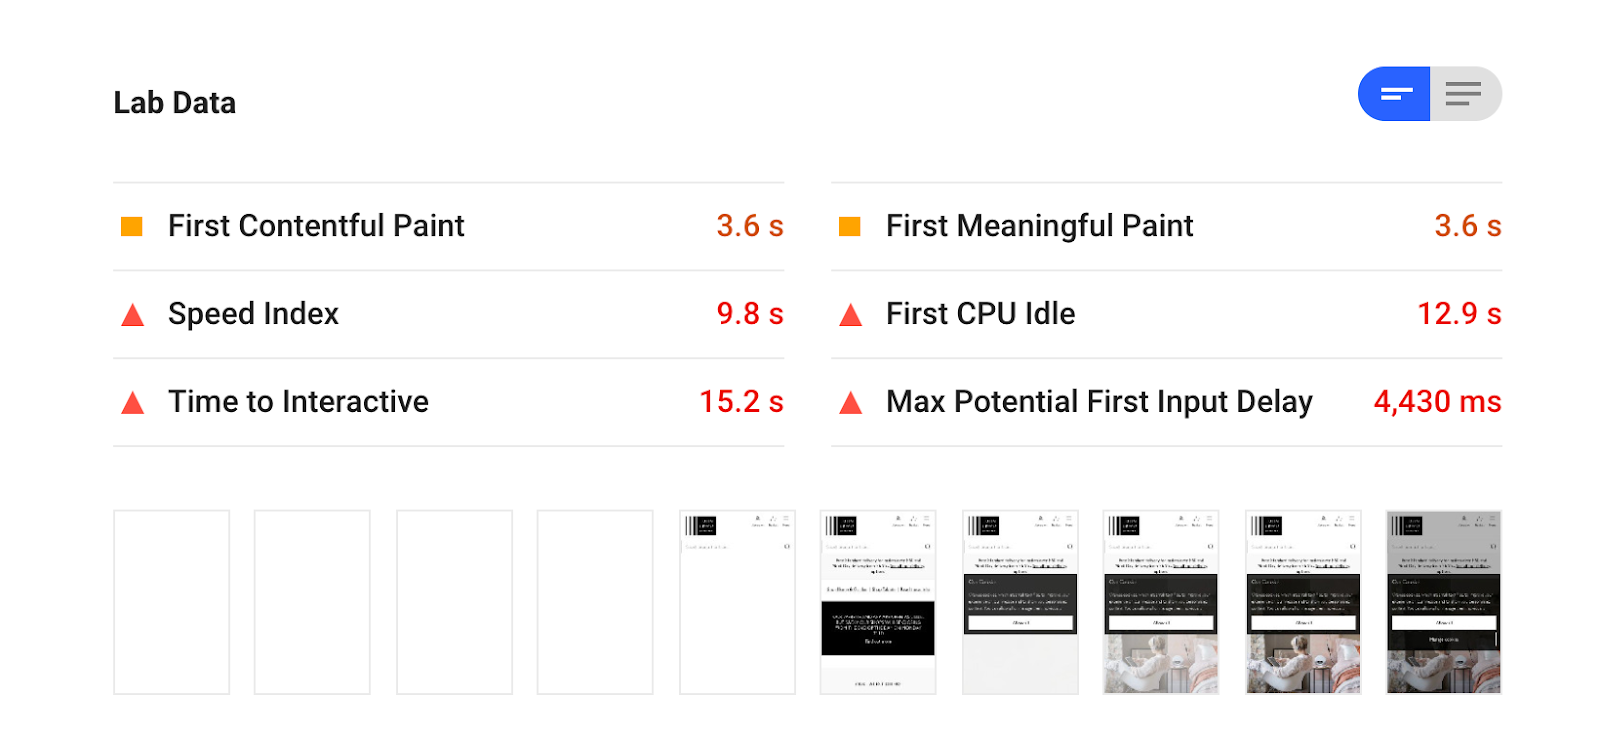
‘Lab data’, in comparison to ‘field data’, is based on the Lighthouse analysis of the page and an emulated device and connection. While this doesn’t show real-world data, it is still useful for understanding where issues occur. Again, PageSpeed Insights uses its familiar traffic light coloring system here to indicate performance: displaying a circle for green scores, a square for orange, and a triangle for red.
First Contentful Paint (FCP)
While FCP is shown in the ‘field data’ report, it is based on an emulated analysis from Lighthouse, rather than real-world data.
First Meaningful Paint
The lower the first meaningful paint score for your site or webpage, the faster the page displays the content on it. In simple terms, this shows when a page's main content was displayed on the screen and is a great way to determine a user's loading experience.
Speed index
The speed index metric shows how quickly the content of a page becomes visible, with lower scores indicating better performance.
First CPU idle
This reports on when most, but perhaps not all, elements of a page are interactive and when the page is able to respond to most user inputs without excessive delay.
Time to Interactive (TTI)
TTI measures how quickly a page becomes interactive. Optimizing visibility over interactivity can be frustrating for users. Hence the importance of fully understanding and measuring when a page displaying useful content has responded within 50 milliseconds.
Max Potential First Input Delay
Remember FID on the ‘field data’ report? For ‘lab data’, this is reported as max potential first input delay and shows the duration of the longest task after FCP that could be experienced by users.
Opportunities
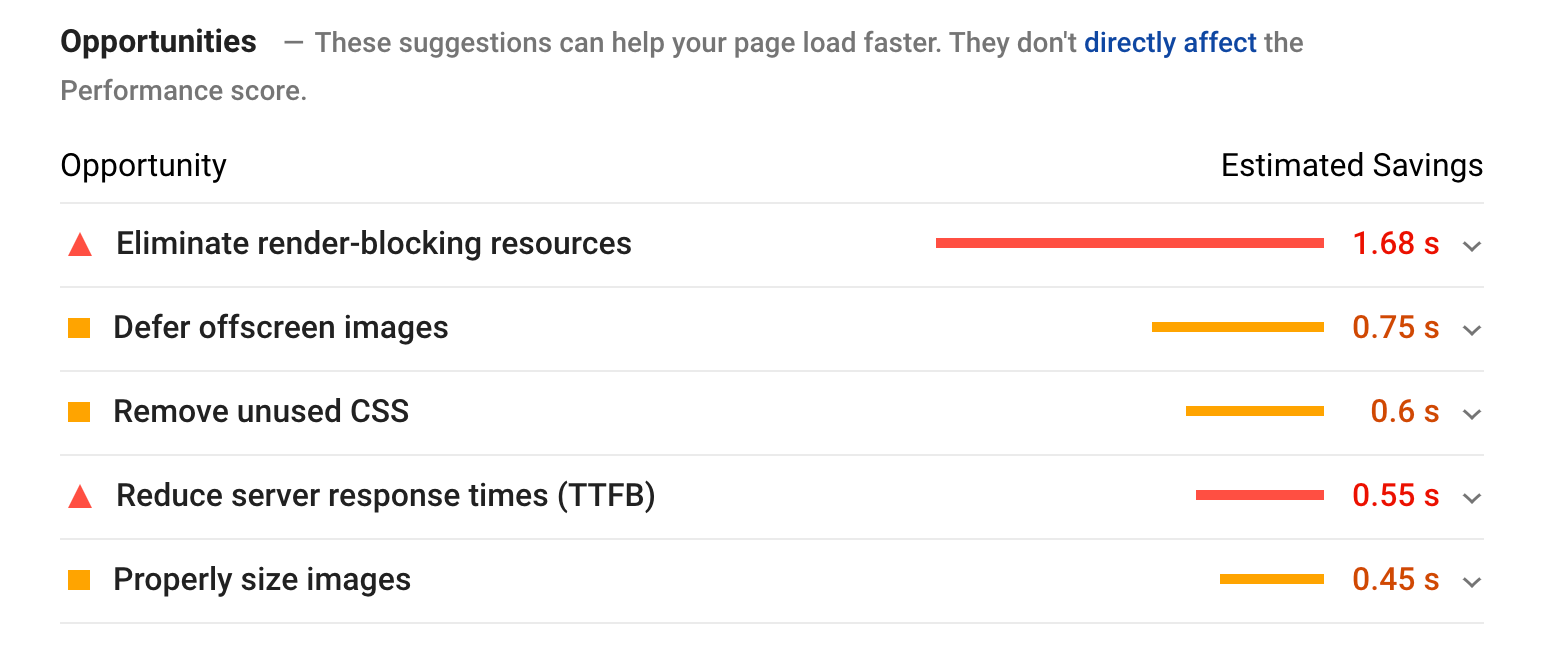
It is in the opportunities section where you will gain an insight into what to focus on to improve your page loading time and PageSpeed score, alongside an estimate of the reduction in load time that could be seen.
Diagnostics
Diagnostics, on the other hand, shows recommendations on best practices that should be considered but don’t necessarily improve load times.
Passed Audits
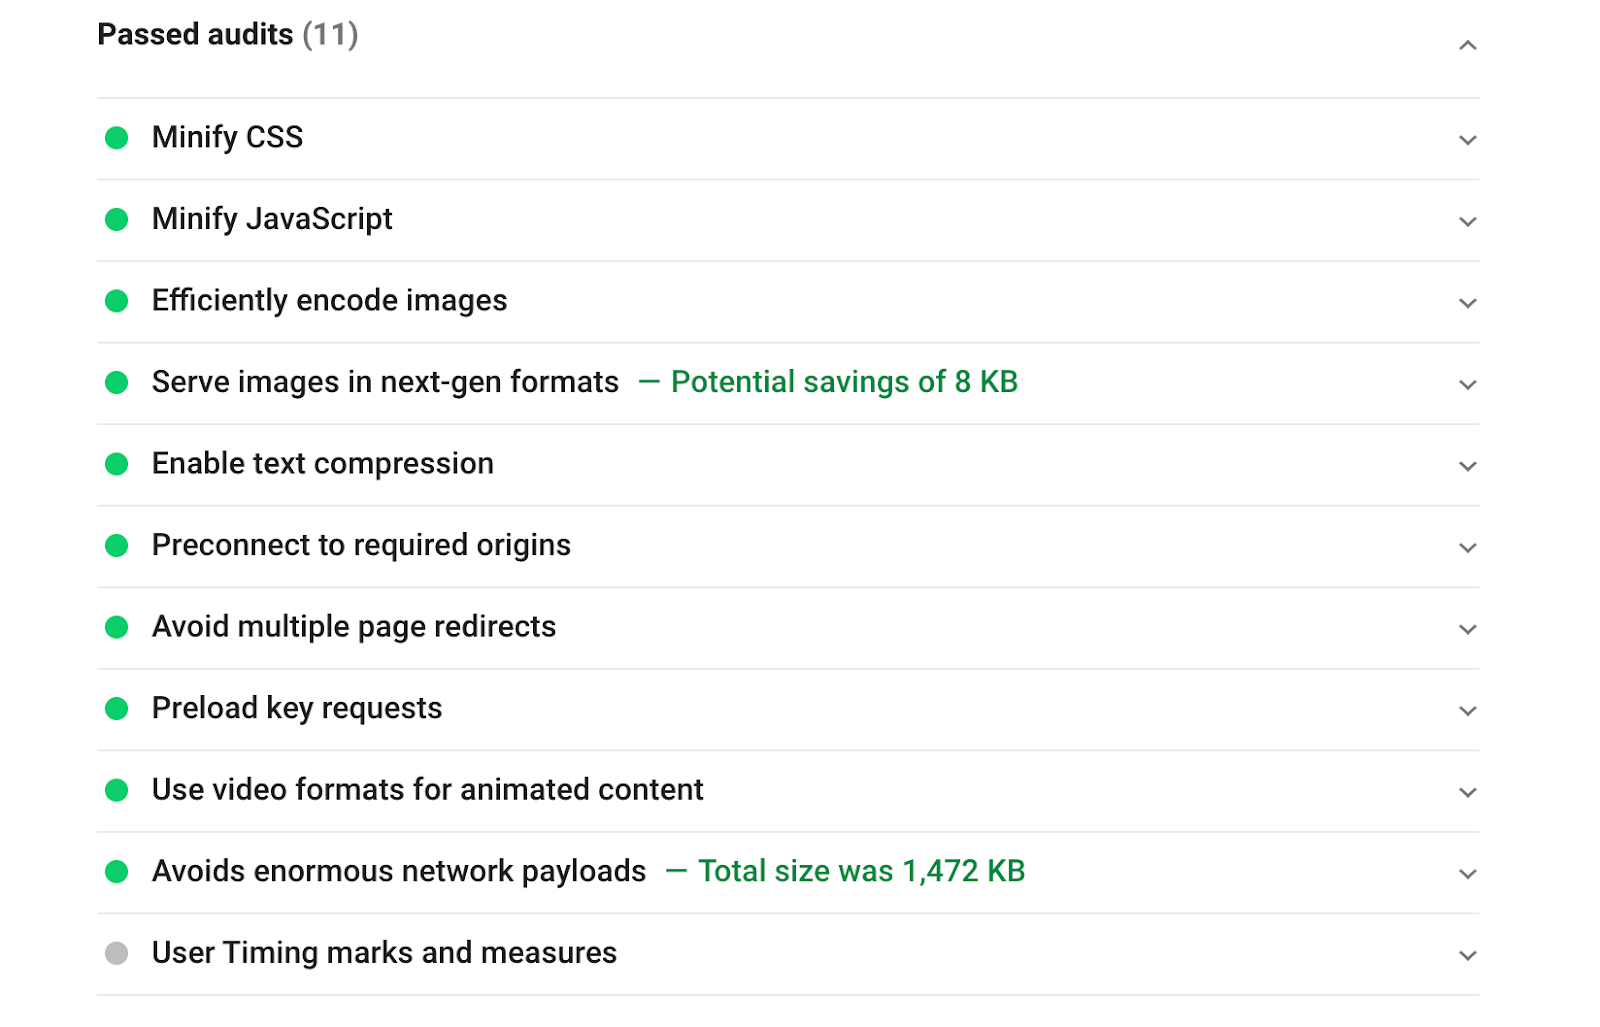
Passed audits are what it sounds like.
What Is a Good PageSpeed Score?
Even if you aren’t achieving 100/100, you can still have a fast-loading site. Remember, PageSpeed, on its own, isn’t a direct indicator of load time.
The likelihood is that you may never reach a perfect score, despite making drastic improvements that positively impact the load time of your site. Focus your efforts and resources where they make the most sense. As stated by WordPress hosting platform Kinsta, “getting a 100/100 in Google PageSpeed Insights isn’t actually that important." It is often cited as a common myth that you need to score 100/100 for your site to perform well.
Be mindful that the real indicator of performance for your site is its loading time, not a PageSpeed Insights score. That said, we see that Google itself breaks down that a poor score is between 0 and 49, an average one between 50 and 89, and a good score is 90+. Aim high, for sure, but don’t obsess over getting a score of 100. It is also important to understand how the sites you are directly competing against on the SERPs stack up, to some extent. If you have got a faster load time and a better PageSpeed score, yet still only score, say, 92/100, there is a good chance your efforts could be better allocated elsewhere.
How to Improve Your PageSpeed Insights Score
Try the recommended actions (or best practices) and starting points below; they are the most commonly seen issues and have the biggest impact upon improvements.
Optimize Images
Image optimization is perhaps one of the most common reasons why a web page has a slow load time and often the best place to start making improvements, as the increases on both load time and PageSpeed can be significant. Especially when there is a number of people responsible for uploading content or adding products, it is hard to maintain strict standards for images, and problems can quickly mount up.
Images take a lot of resources to download, and they are often not properly optimized. The two main areas where you can make improvements by optimizing images are:
The disk size of an image.
Displayed size vs. the actual image size in pixels.
Deferring offscreen image loading.
Use a content delivery network (CDN).
Using next-gen images.
Optimizing Image Size
A 1MB image will take longer to download than a 100KB image. To tackle this, work to compress images without losing quality. You can use tools such as TinyPNG to achieve this, or take a look at Google’s recommendation, ImageMagick.
Size Images at Their Display Size
Another common issue is images unnecessarily much larger than they need to be. Imagine your page displays an image of 250 by 250 px. If the original image is actually 1000 by 1000 px, yet it is styled to display smaller with CSS, you can make your load time quicker. As it stands, the browser would need to download the original (larger) image to display at the smaller size.
Use a Content Delivery Network (CDN)
Be sure to upload images that are sized correctly; otherwise, you will, without a doubt, run into speed issues. WordPress handles this automatically by creating multiple versions of an image when uploaded, but if you are using another CMS, you may need to manually resize images.
Using a CDN essentially spreads the server load across a number of different locations and uses that closest to the user to serve the assets. The closer the data, the quicker the load time. Sound good? Check the must-know SEO practices for CDNs before you try it.
Defer Offscreen Images
You could also look at deferring offscreen images, meaning that they're downloaded only as a user scrolls. It does risk not all images will be visible when required. However, it is often a compromise worth making to improve load times. You can find a number of WordPress plugins that can help, or Google has its own advice about offscreen images.
Use Next-gen Image Formats
Lastly, consider using next-gen image formats such as WebP. It has been demonstrated that WebP images can result in an 85.87% decrease in average image size compared to JPG and a 42.8% decrease against PNG.
They are not supported by all major browsers, but some applications can handle WebP.
Improving Server Response Time
The reality is that making improvements to your server’s response time isn’t something which most have the ability to do, given that the two real areas of impact are either reducing the load or improving the hardware. Improving server response time really comes down to making sure your site is hosted on a great server. Publisher TechRepublic has a cheat sheet for choosing the best web host.
If you see recommendations that relate to either the server response time or TTFB (time to first byte), have a chat with your hosting provider or consider hosting solutions better suited to your site.
Minification
When writing code, it is common for this to be done so in a way that uses spaces to keep it easy to read. Simply, minification removes whitespace and comments to optimize CSS and JS files and can be done using a simple copy-paste tool such as Minify.
Browser Caching
If you are using WordPress as your CMS (which an estimated 35% of the web does), it couldn’t be easier to use browser caching, with popular free plugins including W3 Total Cache and WP Super Cache.
Caching works by creating and quickly serving a static version of your site to users, as opposed to a page being dynamically generated every time it is accessed.
If you are not using WordPress, it is still possible to set up browser caching manually.
Clear Up Redirects
Over time, multiple redirects can build up and result in a slowed page load speed, as browsers are forced to make additional HTTP requests, adding to the load time. PageSpeed Insights will highlight these issues.
Using SEMrush Site Audit as an Alternative to PageSpeed Insights
The SEMrush Site Audit is a fantastic way to test your speeds.
Like PageSpeed Insights, the Site Audit tool can help to recommend improvements on a site’s loading speed and other performance issues.
Plus, it will scan for more than 130 technical and SEO mistakes, providing charts, instructions, and directions on everything from crawlability to content issues. You will be able to view a full thematic report that gives you an insight into performance issues and opportunities, showcasing everything you need to make improvements in one single report.
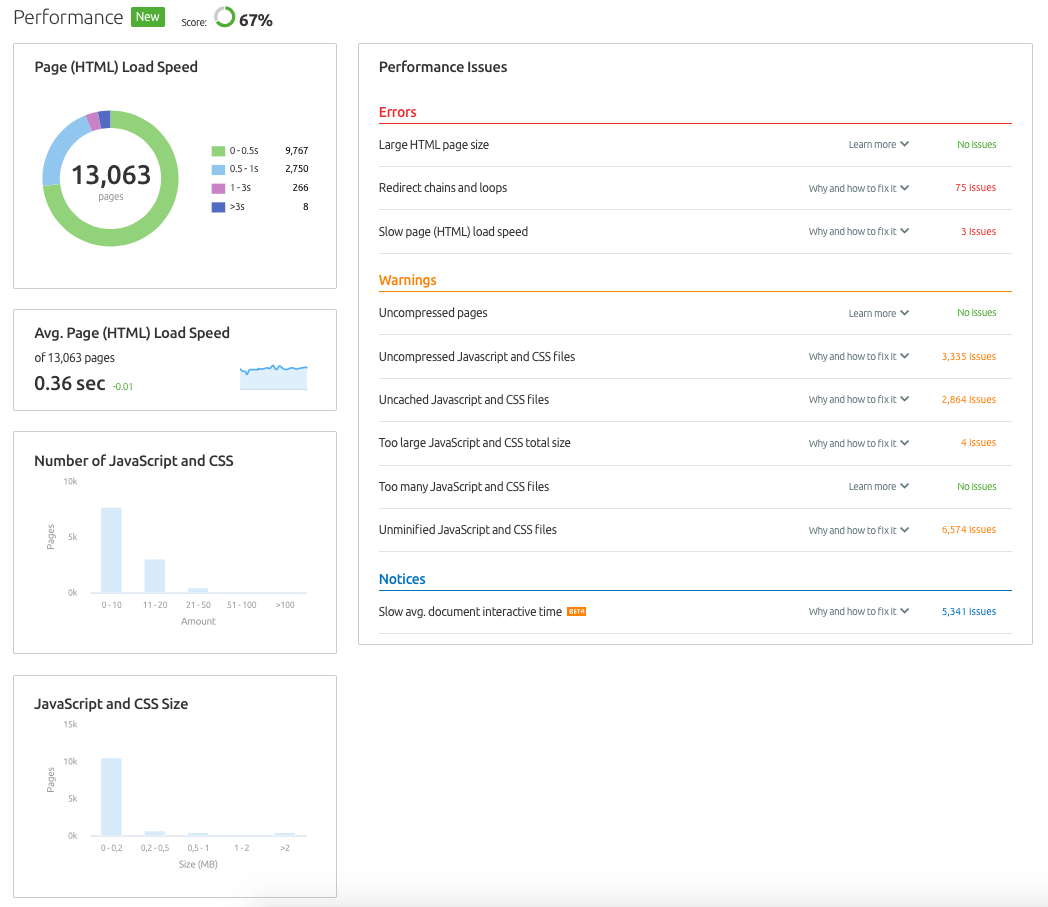
The Performance report is here to help you to make actionable improvements to your site’s performance and load time. It is a quick way to see the bigger picture and get a visual analysis of your data and metrics, covering:
Page load speed.
Average page load speed.
Number of JavaScript and CSS files.
JavaScript and CSS file sizes.
Additionally, the report highlights errors, warnings, and notices. All prioritized to help you fix the issues. You will find information on what to do to see improvements on the 'Why and how to fix it' section, with flagged issues including:
Large HTML page size issues.
Redirect chains and loops.
Slow page load speeds.
Uncompressed pages.
Uncompressed Javascript and CSS files.
Uncached Javascript and CSS files.
Too large JavaScript and CSS total size.
Too many JavaScript and CSS files.
Unminified JavaScript and CSS files.
Slow average document interactive time.
Why not give it a try? Alongside Google PageSpeed Insights, our Site Audit tool can help you prioritize and action fixes to drive forward improvements, reduce your site’s load time, and have a chance at converting your visitors better.
When Will You Start to Improve Your Site’s Speed?
There is no ignoring the importance of having a site that loads quickly, and hopefully, you are a little clearer on what Google’s PageSpeed insights tool is, what it is not, and how it works, as well as how to approach improving your site’s speed.
It is often hard knowing where to start, but by taking the time to understand where you can have the biggest impact, you can start to work with your developers to put in place a prioritized plan of action and turn things around. A page speed test can impacting not only your site’s SEO performance but also convert users at a higher rate.
Innovative SEO services
SEO is a patience game; no secret there. We`ll work with you to develop a Search strategy focused on producing increased traffic rankings in as early as 3-months.
A proven Allinclusive. SEO services for measuring, executing, and optimizing for Search Engine success. We say what we do and do what we say.
Our company as Semrush Agency Partner has designed a search engine optimization service that is both ethical and result-driven. We use the latest tools, strategies, and trends to help you move up in the search engines for the right keywords to get noticed by the right audience.
Today, you can schedule a Discovery call with us about your company needs.
Source:


