State of Fashion
It is not the end of window shopping and lines to the fitting room yet, but we are well on the way towards it. In 2018, fashion ecommerce accounted for roughly 20.4% of the total fashion retail sales in the United States. Every year, the category grows by 14.2% and is forecast to generate $112.6B of revenue in the US in 2019. At this rate, apparel, footwear, and accessories online stores seem to have no margin for error in their marketing strategies.
What We Have Done
To help marketers and business owners save time on research activities and concentrate on their strategic goals, we have collected a lot of critical data that can assist them with future marketing decisions. Our high-level research of the current digital landscape and traffic dynamics of the fashion ecommerce industry includes digital marketing trends, consumer behavior, and patterns in the use of technologies. All statistics were analyzed to provide you not just with raw data but interpreted insights.
In our recently published ebook, we studied fashion ecommerce websites both worldwide and specifically in the US. In this article, we will focus exclusively on the US market, providing you with the latest stats and more detailed analysis of what is happening to online fashion retailers countrywide. If you choose to use our findings in your work or quote some of the statistics for the US, please refer to the current article as it has the updated figures.
Table of Contents
Who We Researched What Tools We Used Why Website Traffic Matters for Ecommerce US Fashion Ecommerce Websites: Traffic Overview and Trends Ranking: Top 10 Fashion Ecommerce Websites in the US Devices Breakdown Geographical Markets Traffic Sources in Detail Most Engaging Fashion Ecommerce Websites in the US Macy's: Top Multibrand Fashion Ecommerce in the US Victoria's Secret: Top Monobrand Fashion Ecommerce in the US How to Use These Findings Template: 10 Insights to Get from Your Competitors' TrafficWho We Researched
The Semrush Data Science team developed its own website categorization service, which allowed the analysis of any domain on the Internet. With this website categorization, we made a list of websites that fall into the category of fashion ecommerce, including both fashion aggregators (those that accumulate offers of various retailers, for example, asos.com) and brand websites (those that sell their own particular brand of clothes, for instance, hm.com).
We did not make any distinction between sportswear and formal dresses online stores; we were neither interested in classifying ecommerces by their price range. We limited our list to the US as the set location and filtered out the top 130 fashion ecommerce websites that were most successful in generating traffic. All of the trends and specific rankings were put together from these 130 sites.
The Tools We Used
We researched these websites with the use of Semrush Traffic Analytics — a tool specially made for analyzing any company’s traffic individually and comparing it with competitors’ traffic. Its features revealed the following:
The overall amount of traffic for each website monthly and yearly.
Dynamics of traffic growth for specific domains, as well as trends and benchmarks for the industry.
A breakdown of generated desktop and mobile traffic.
Shares of regional traffic by country.
The most typical traffic sources.
Devices distribution stats.
Visits to specific subdomains.
All of the insights related to these metrics.
We also referred to Semrush Organic Research to add the share of branded and non-branded traffic to our dataset to provide you with more profound insight.
Except for the website owner, no one has access to the domain’s internal stats. Therefore, all of the metrics in the research were estimated with the Semrush algorithms. All of the figures presented in infographics are rounded.
Why Website Traffic Matters for Ecommerce
The reason may sound obvious — in an online-based business, any conversion starts with a visit to the website. There are, however, some aspects of a domain’s online performance which are often overlooked.
Provided you don’t rely solely on the number of visits, traffic-related metrics help you reveal a company’s position in the market, their marketing strategy, and their possible partnerships. Armed with this information, you can then make conclusions on what direction to choose for your campaign.
With access to overall Traffic Volume, as well as the percentage of visits to the payment service as a Destination Site from the researched webpage or to the same-purpose Subdomains, you can get a rough idea of an ecommerce’s conversion.
Therefore, if you aim to get insights from competitive intelligence and to optimize your marketing strategy, traffic analysis is essential.
Fashion Ecommerce in the US: First Glance
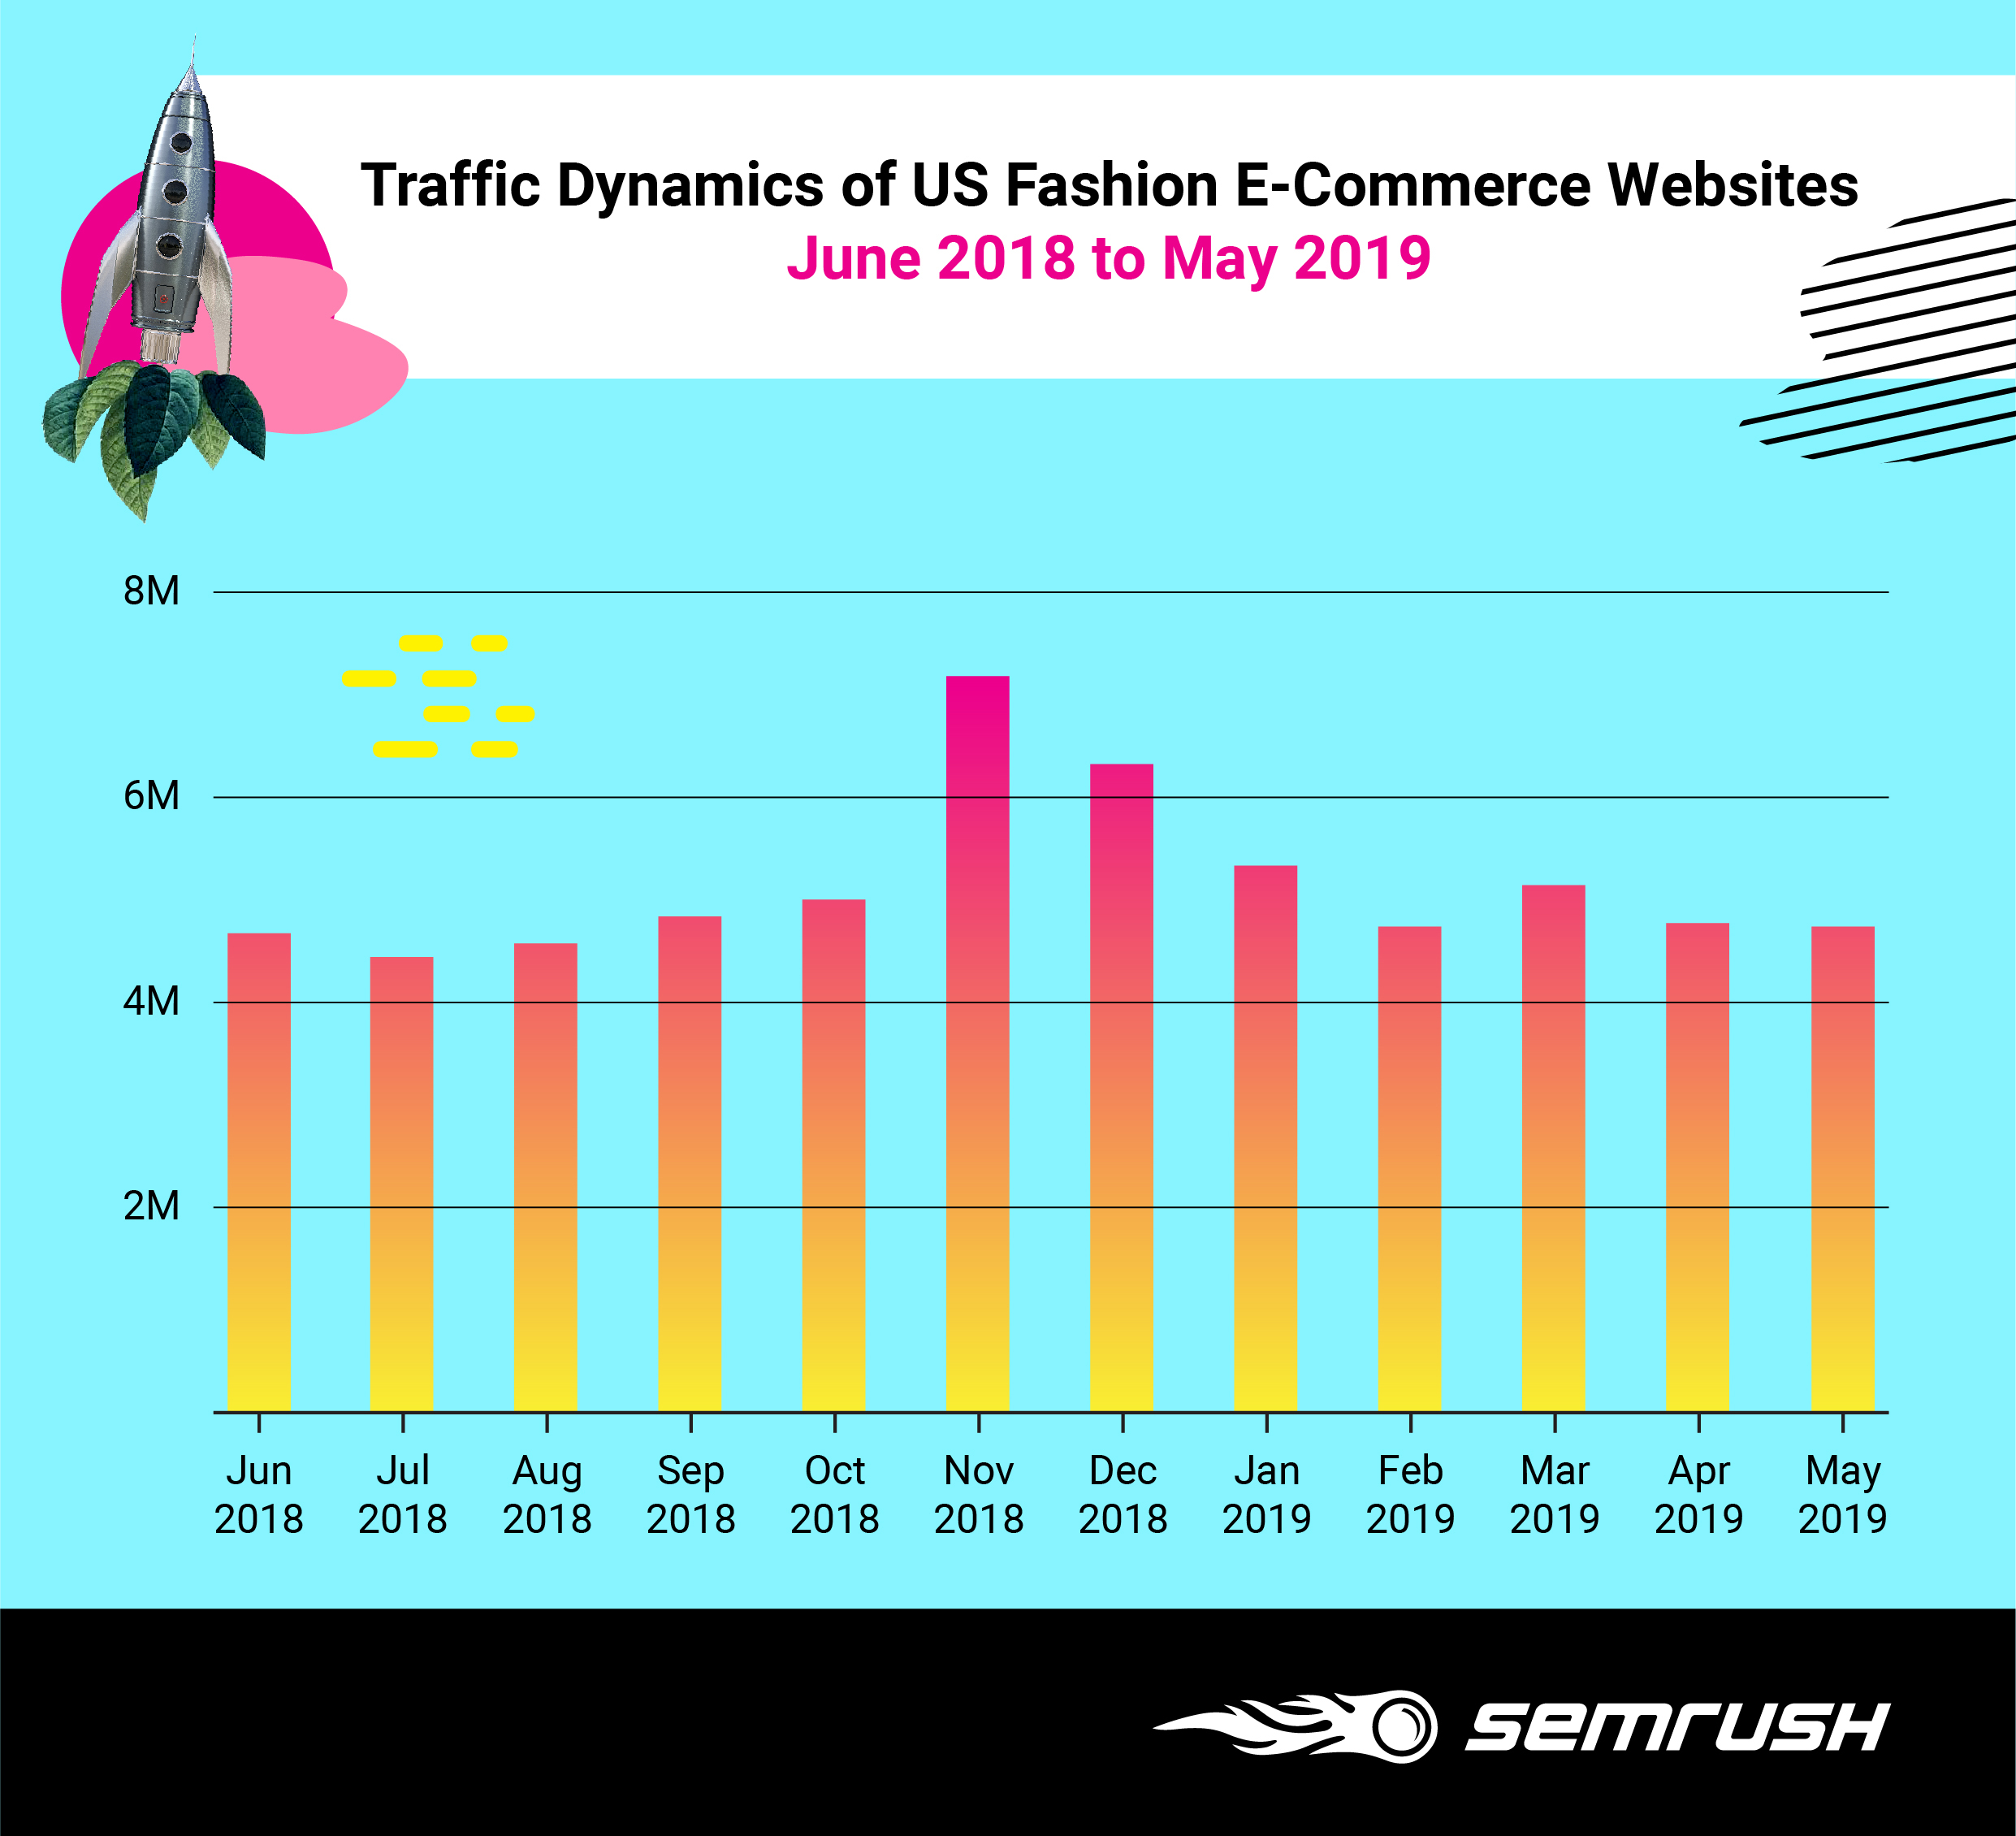
We first derived the average amount of traffic generated by 130 US fashion ecommerce websites monthly in June 2018–May 2019 to see the seasonal peaks typical for the whole industry in the region. The most visible increase of traffic was in November and is also the most evident one — Black Friday did its job for fashion e-tailers, as well as some early Christmas shopping. The change of seasons helped online stores in September, as well as drew some extra visitors in March.
Branded vs. Non-Branded
Apart from the overall Traffic Volume of the researched websites, we also studied their branded/non-branded traffic breakdown, shares of Traffic Sources, and key user engagement metrics.
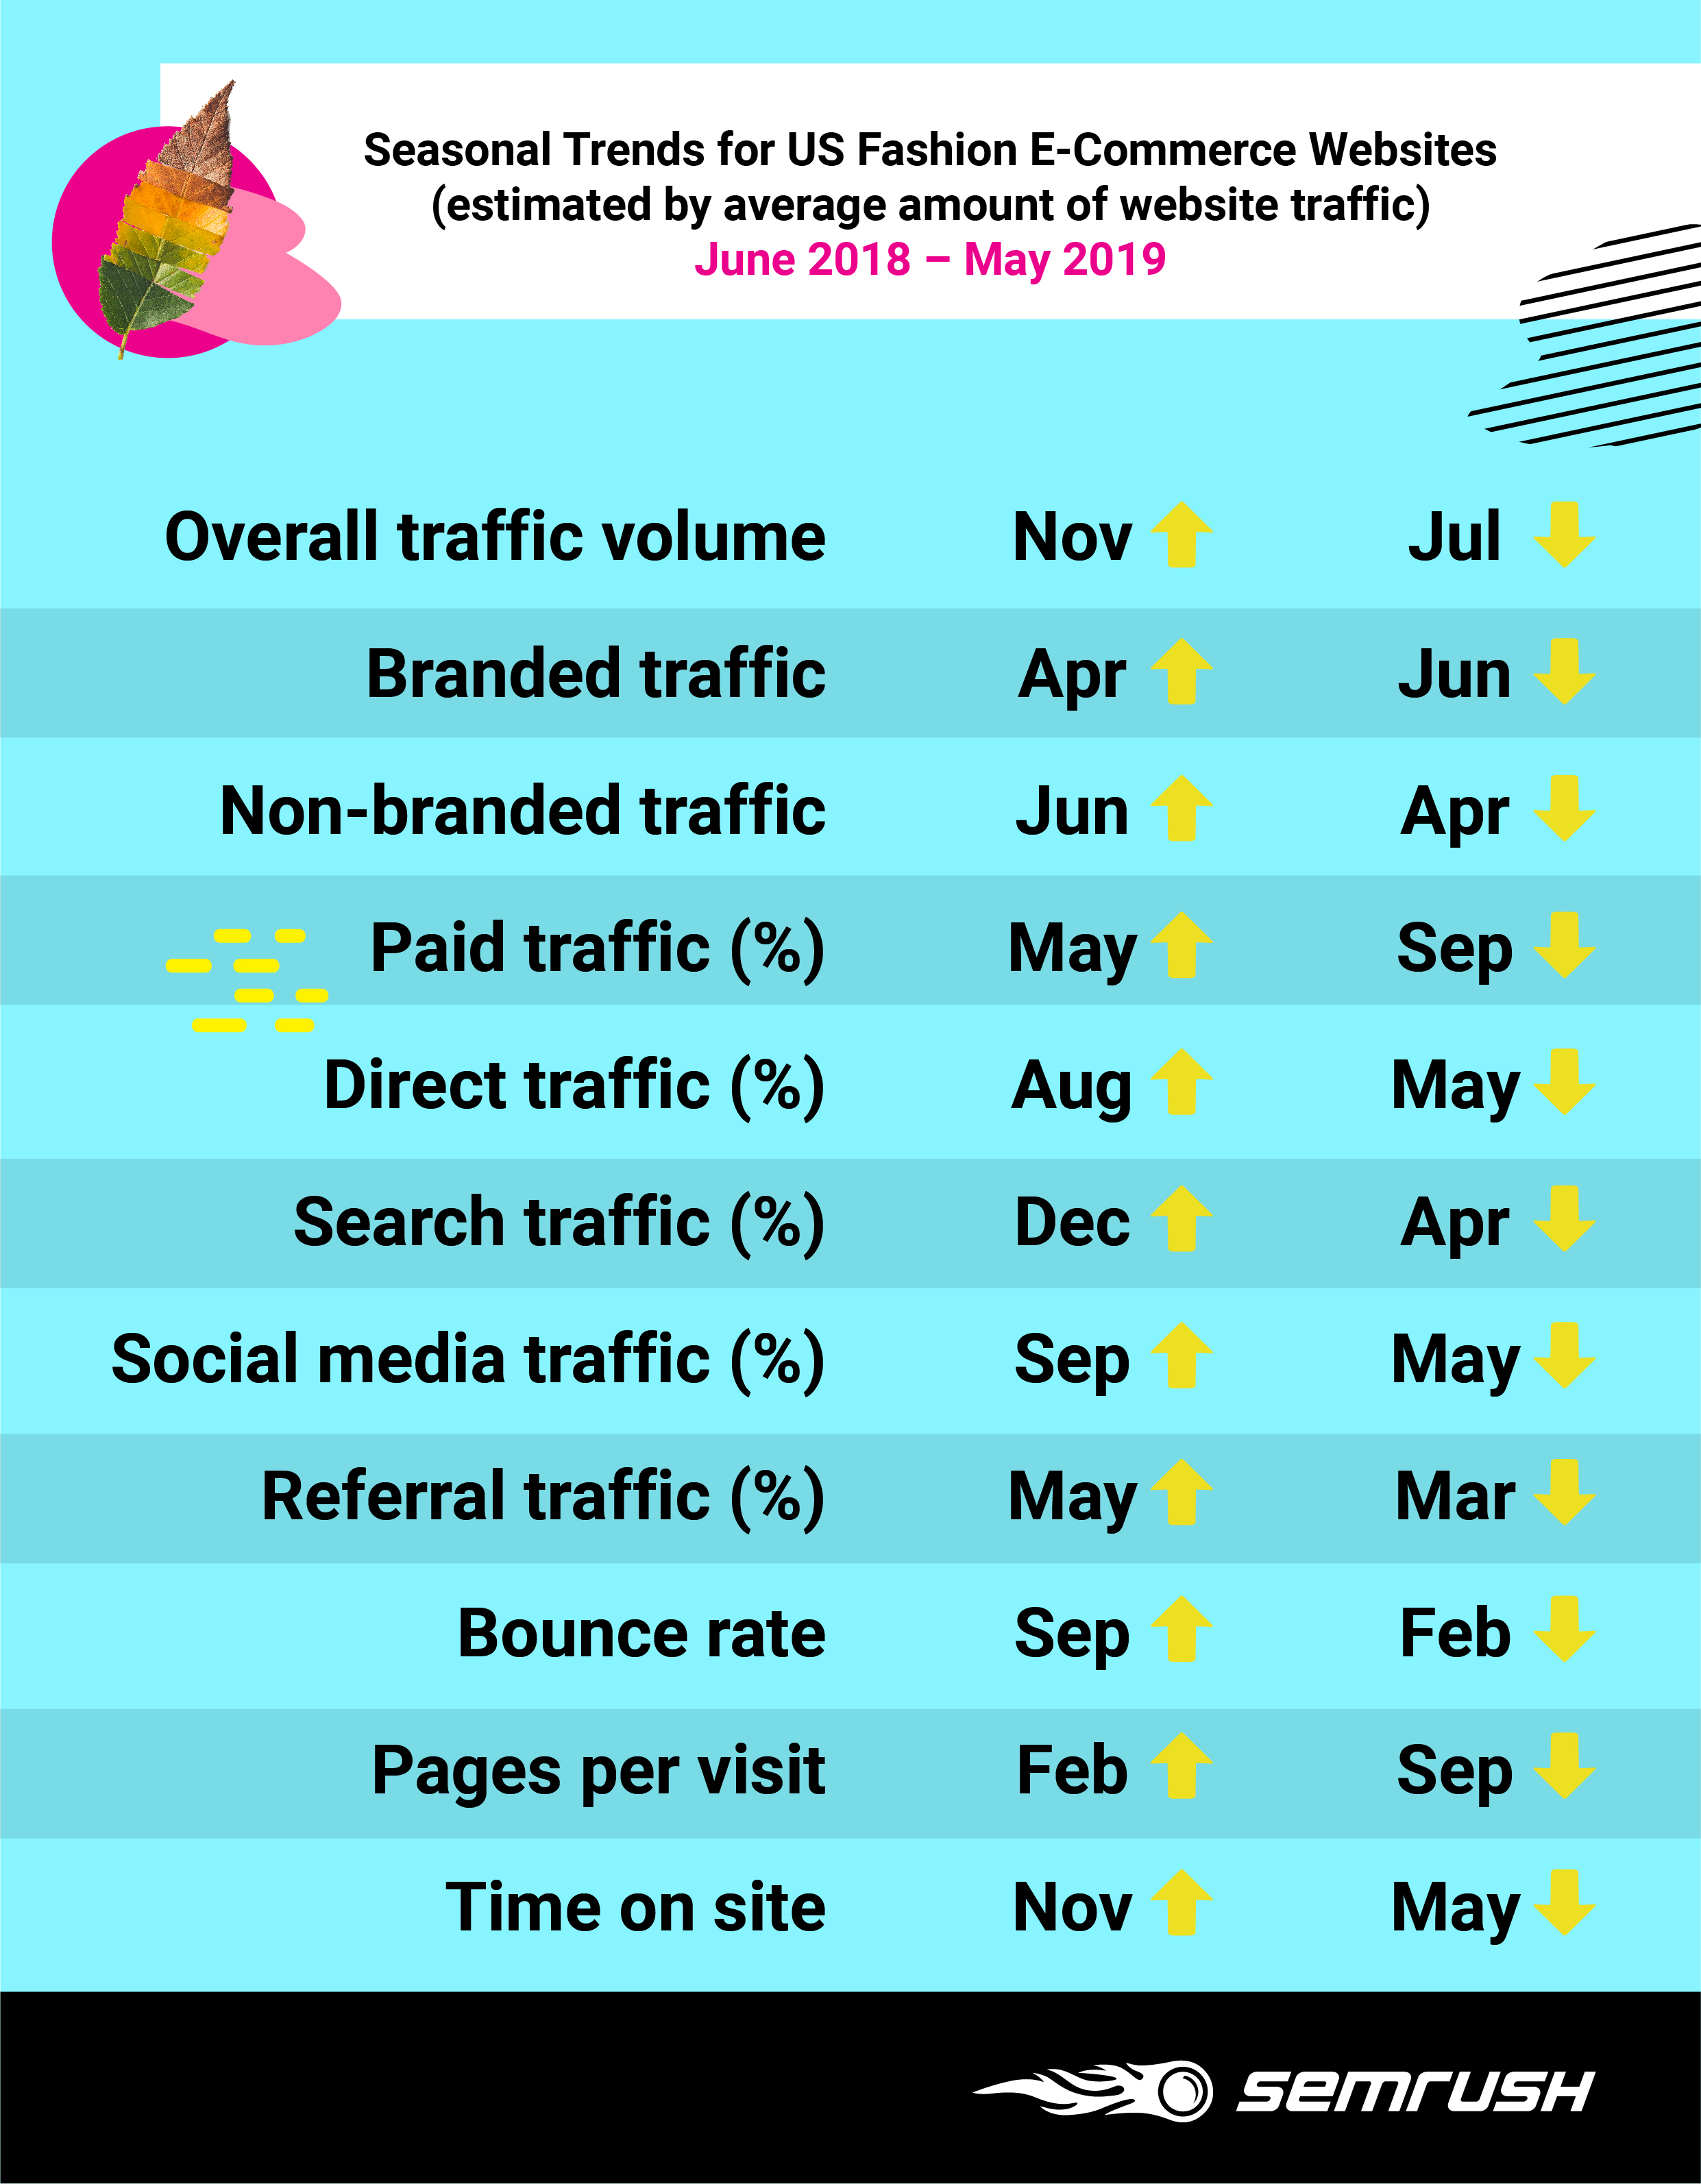
Our research revealed that users are not focused on specific brands in June — whether it is because of the starting summer sales or the urgency to find something to pack for vacation, non-branded queries prevail in the organic search. April appears to be the high season for the most determined customers looking for specific brands online. In general, however, April is not the most “searched” month, as this share of traffic source indicates.
Traffic Sources
The share of a particular traffic source in a specified period of time can reveal fashion e-digital marketing strategies. May happened to be the month when advertisers either invested the biggest sums in paid media and subsequently received the highest level of reach or optimized their campaigns in a way that resulted in the highest CTR.
At first glance, you won’t be able to tell what caused the rise or decline in the level of traffic. In a case like this, we would advise you to continue competitor analysis with Advertising Research. If you need to learn which social media and referring websites drove the majority of traffic to your competitors’ domains, refer to the corresponding tabs in the Traffic Sources report.
User engagement metrics (bounce rate, number of pages per visit, and average time on site) reveal the quality of the attracted traffic. In November, customers spent a record of 10 minutes and 12 seconds on each site, visiting on average more than 7 pages per session. Furthermore, the bounce rate did not exceed the average.
February may look off-season by the amount of traffic, but its quality is extremely high with the lowest bounce rate and the largest number of pages per visit in the analyzed period.
That Is What You Are Here For: Top 10 Fashion E-Tailers in the US
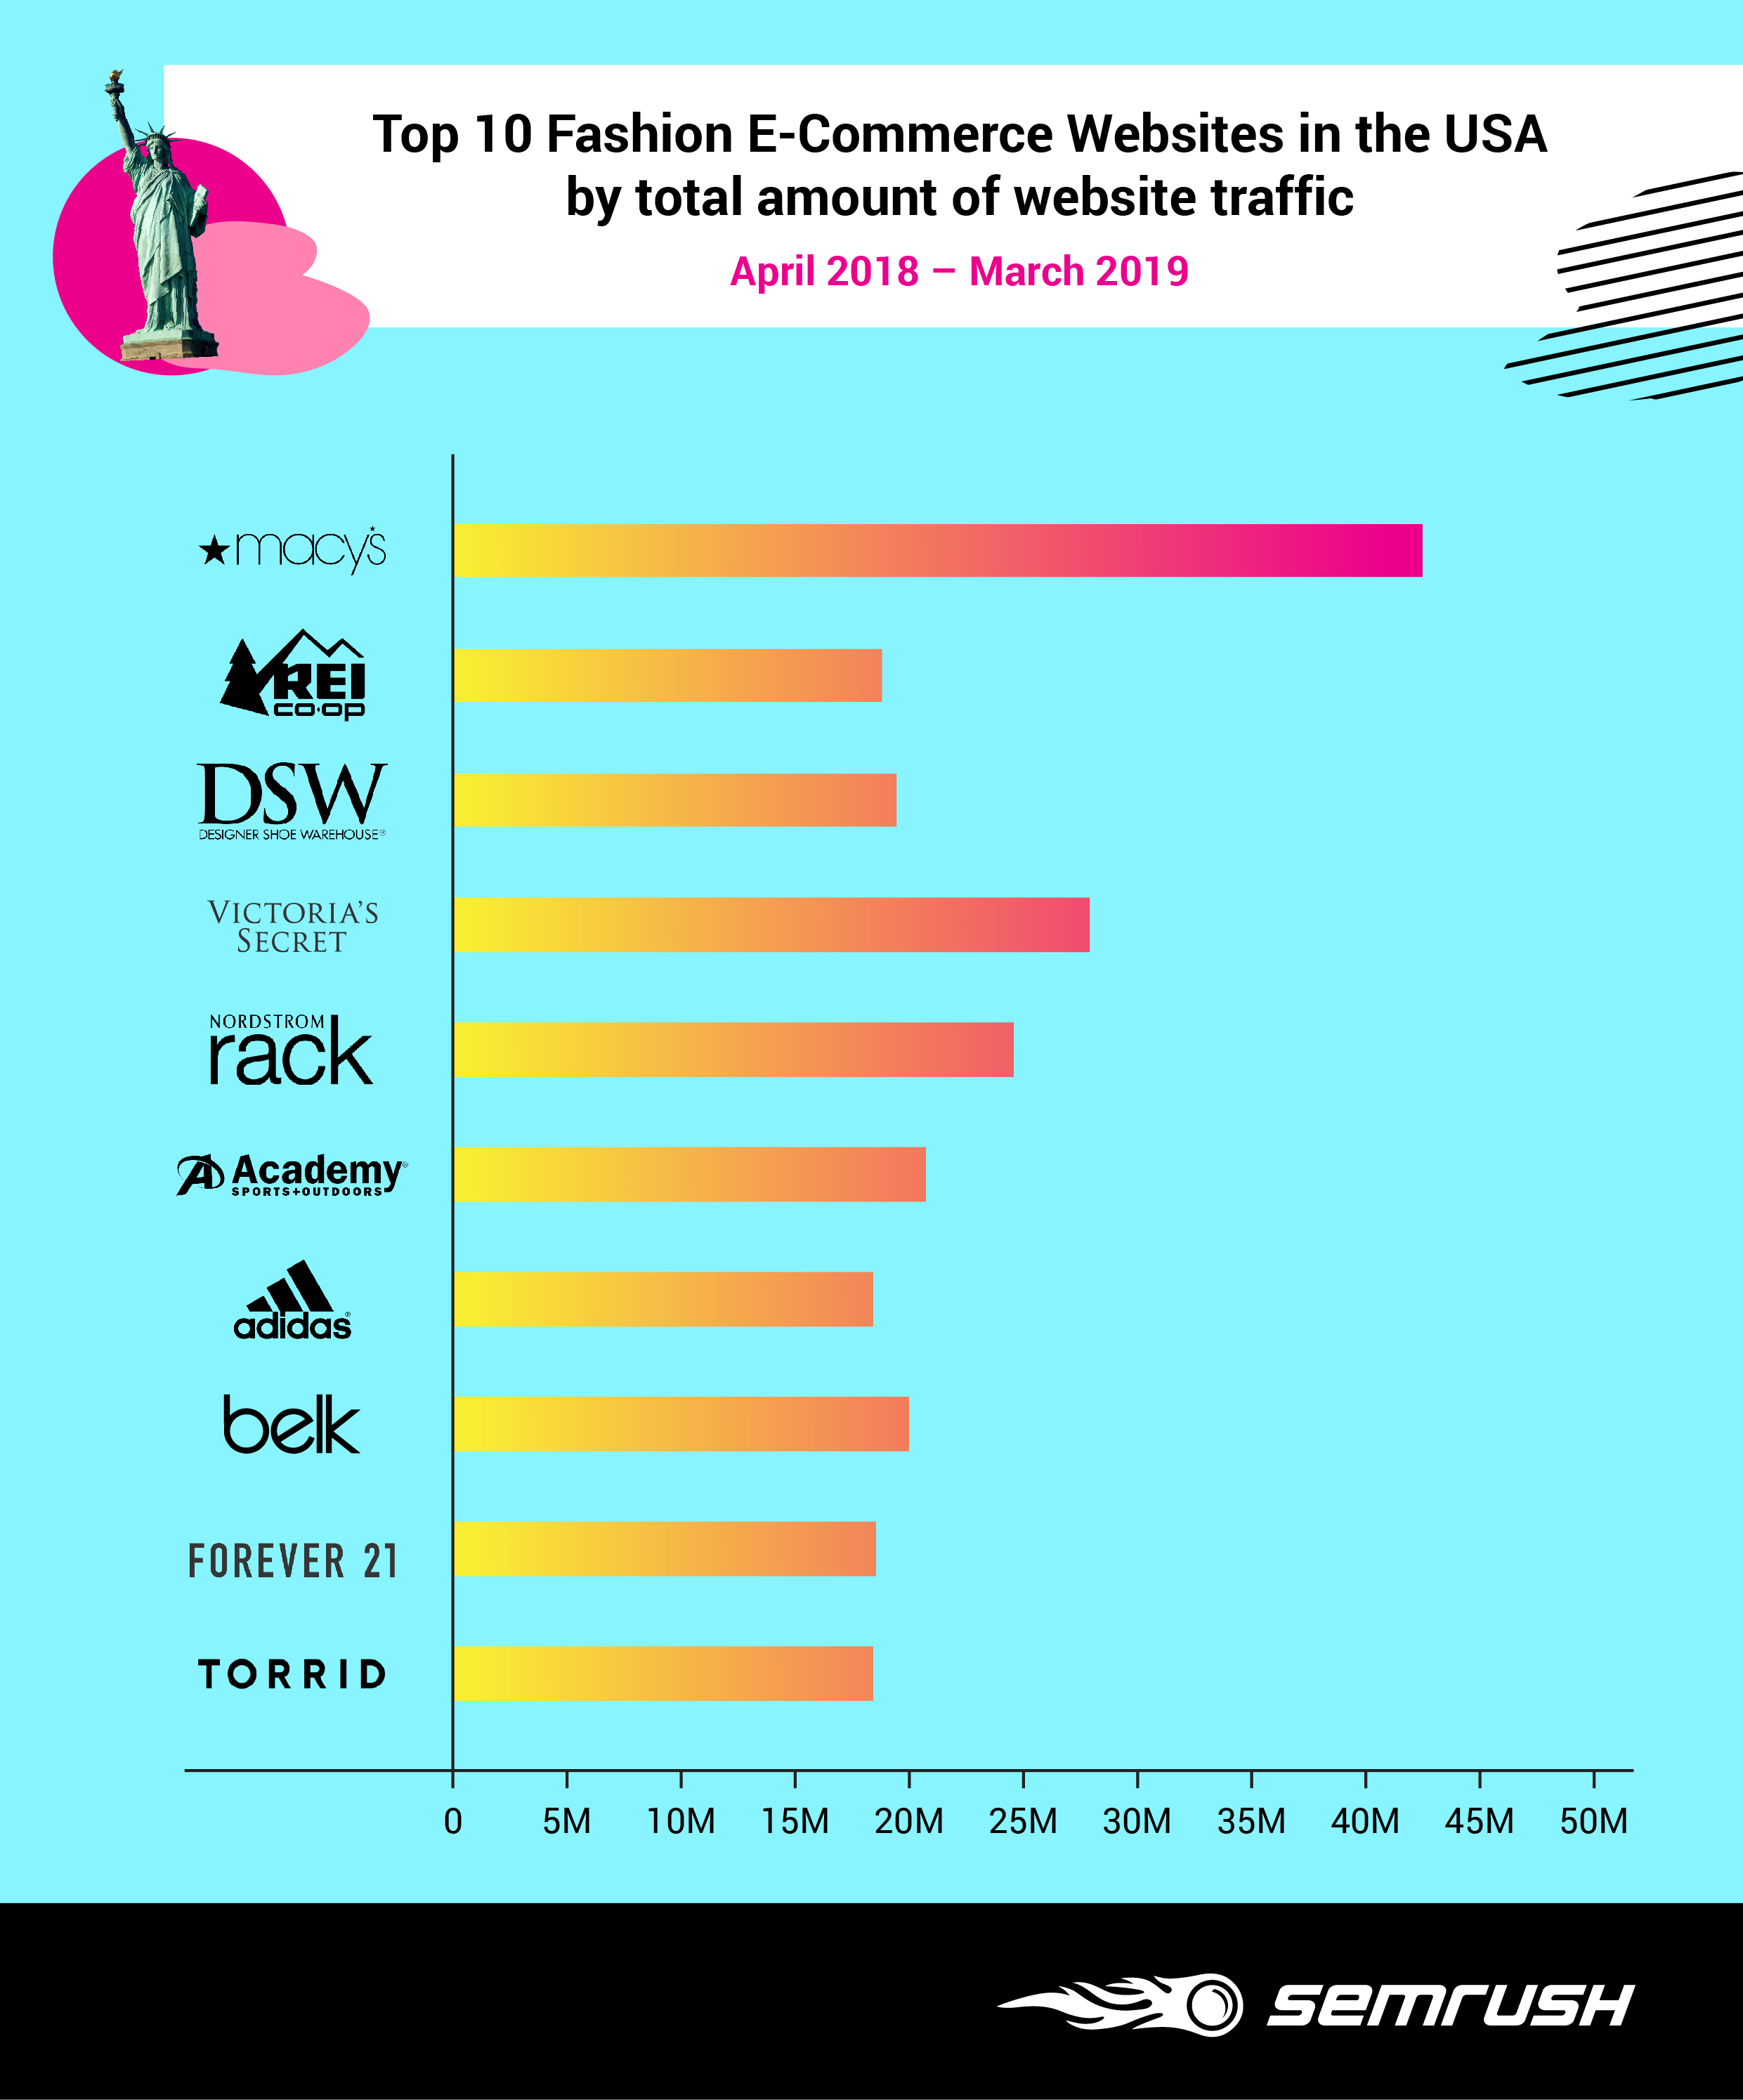
As we mentioned above, these are fashion ecommerce websites that received the largest amount of traffic in the US. The figures presented in the infographics are rounded and are sums of estimated monthly traffic received by each domain from June 2018–May 2019.
Continue reading to learn if being mobile-friendly is still crucial, what traffic sources fashion ecommerce websites relied on and how they handled user engagement on their pages — or go straight to the Macy's and Victoria’s Secret’s marketing strategies review.
Mobile First, Desktop Second
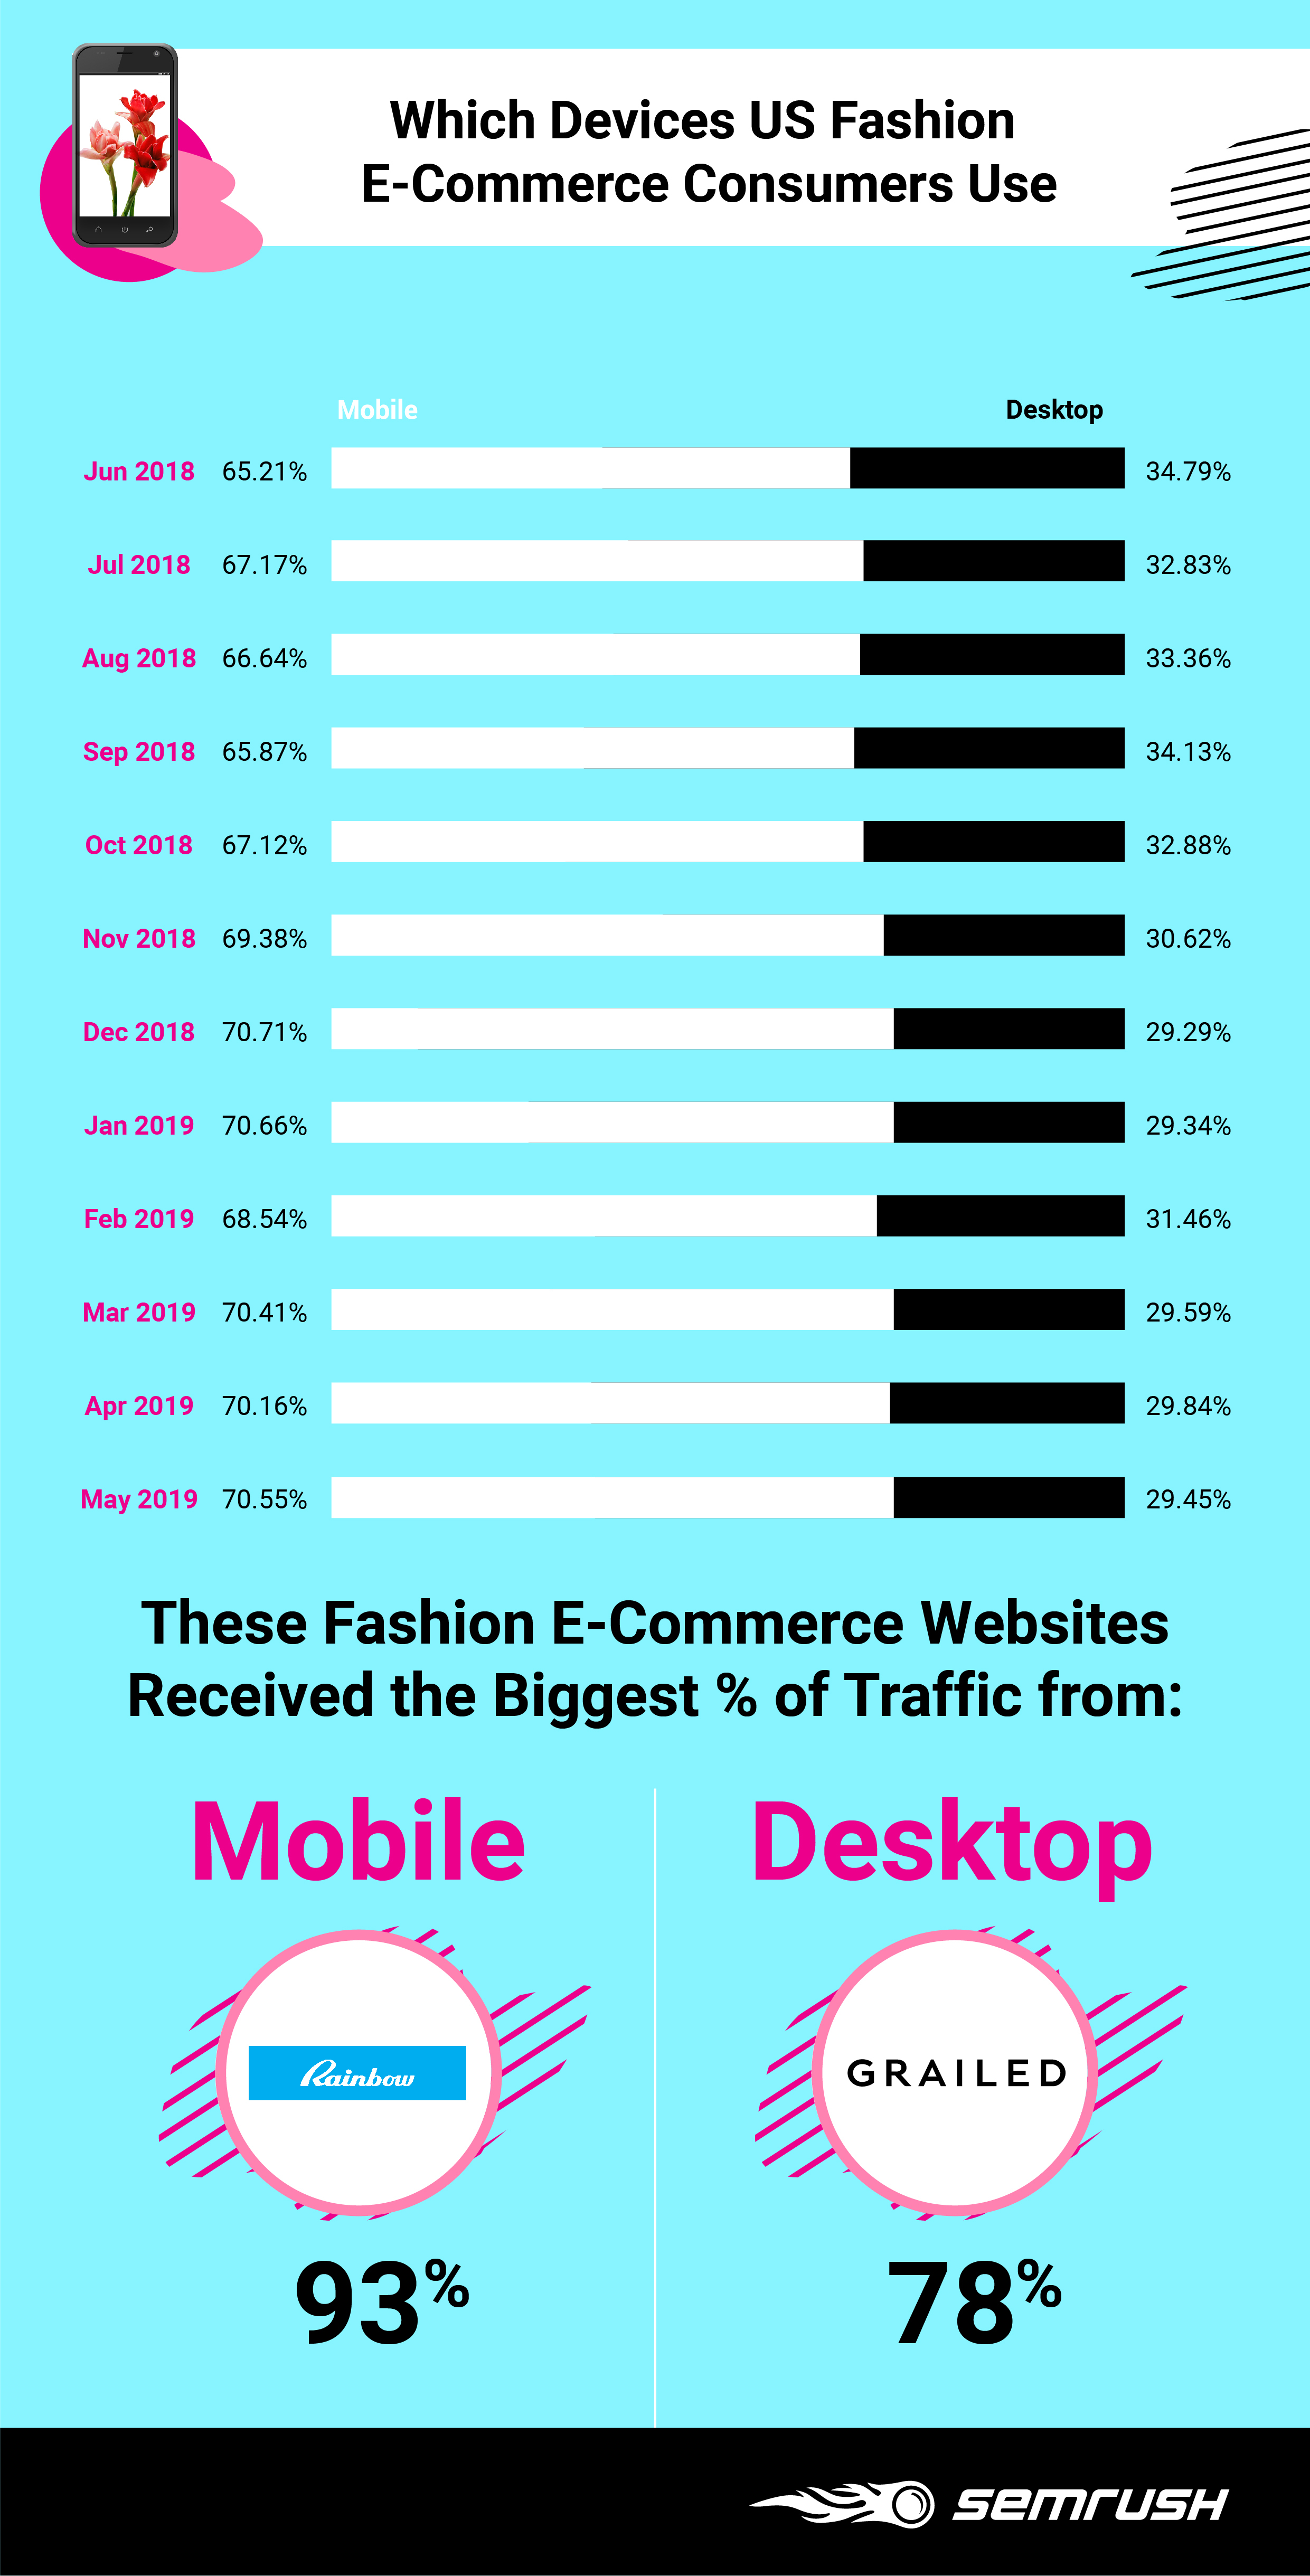
Fashion ecommerce websites are no exception to Google’s “Mobile First” principle. On average, 68.54% of the analyzed websites’ yearly traffic came from mobile devices. The figure goes up to 93% for companies like Rainbow Shops whose apparel is targeted at teens and a young women’s audience.
US fashion e-tailers should not consider mobile as secondary in their marketing strategies. However, ignoring desktop users means cutting off a vast audience whose customer journey may be much longer than a one-click purchase at the very first website visit from a stationary device.
In certain cases, where we observed desktop preference over mobile (i.e., look at the volume of desktop traffic that grailed.com received) the reason may lie in a brand’s positioning and targeting to a particular audience. Instances like this should also be a clear sign for you as a marketer to dig deeper into the company’s online strategy — it must have been the choice of media platforms that led to such an atypical breakdown.
Geographical Markets: It Is Not All About the US
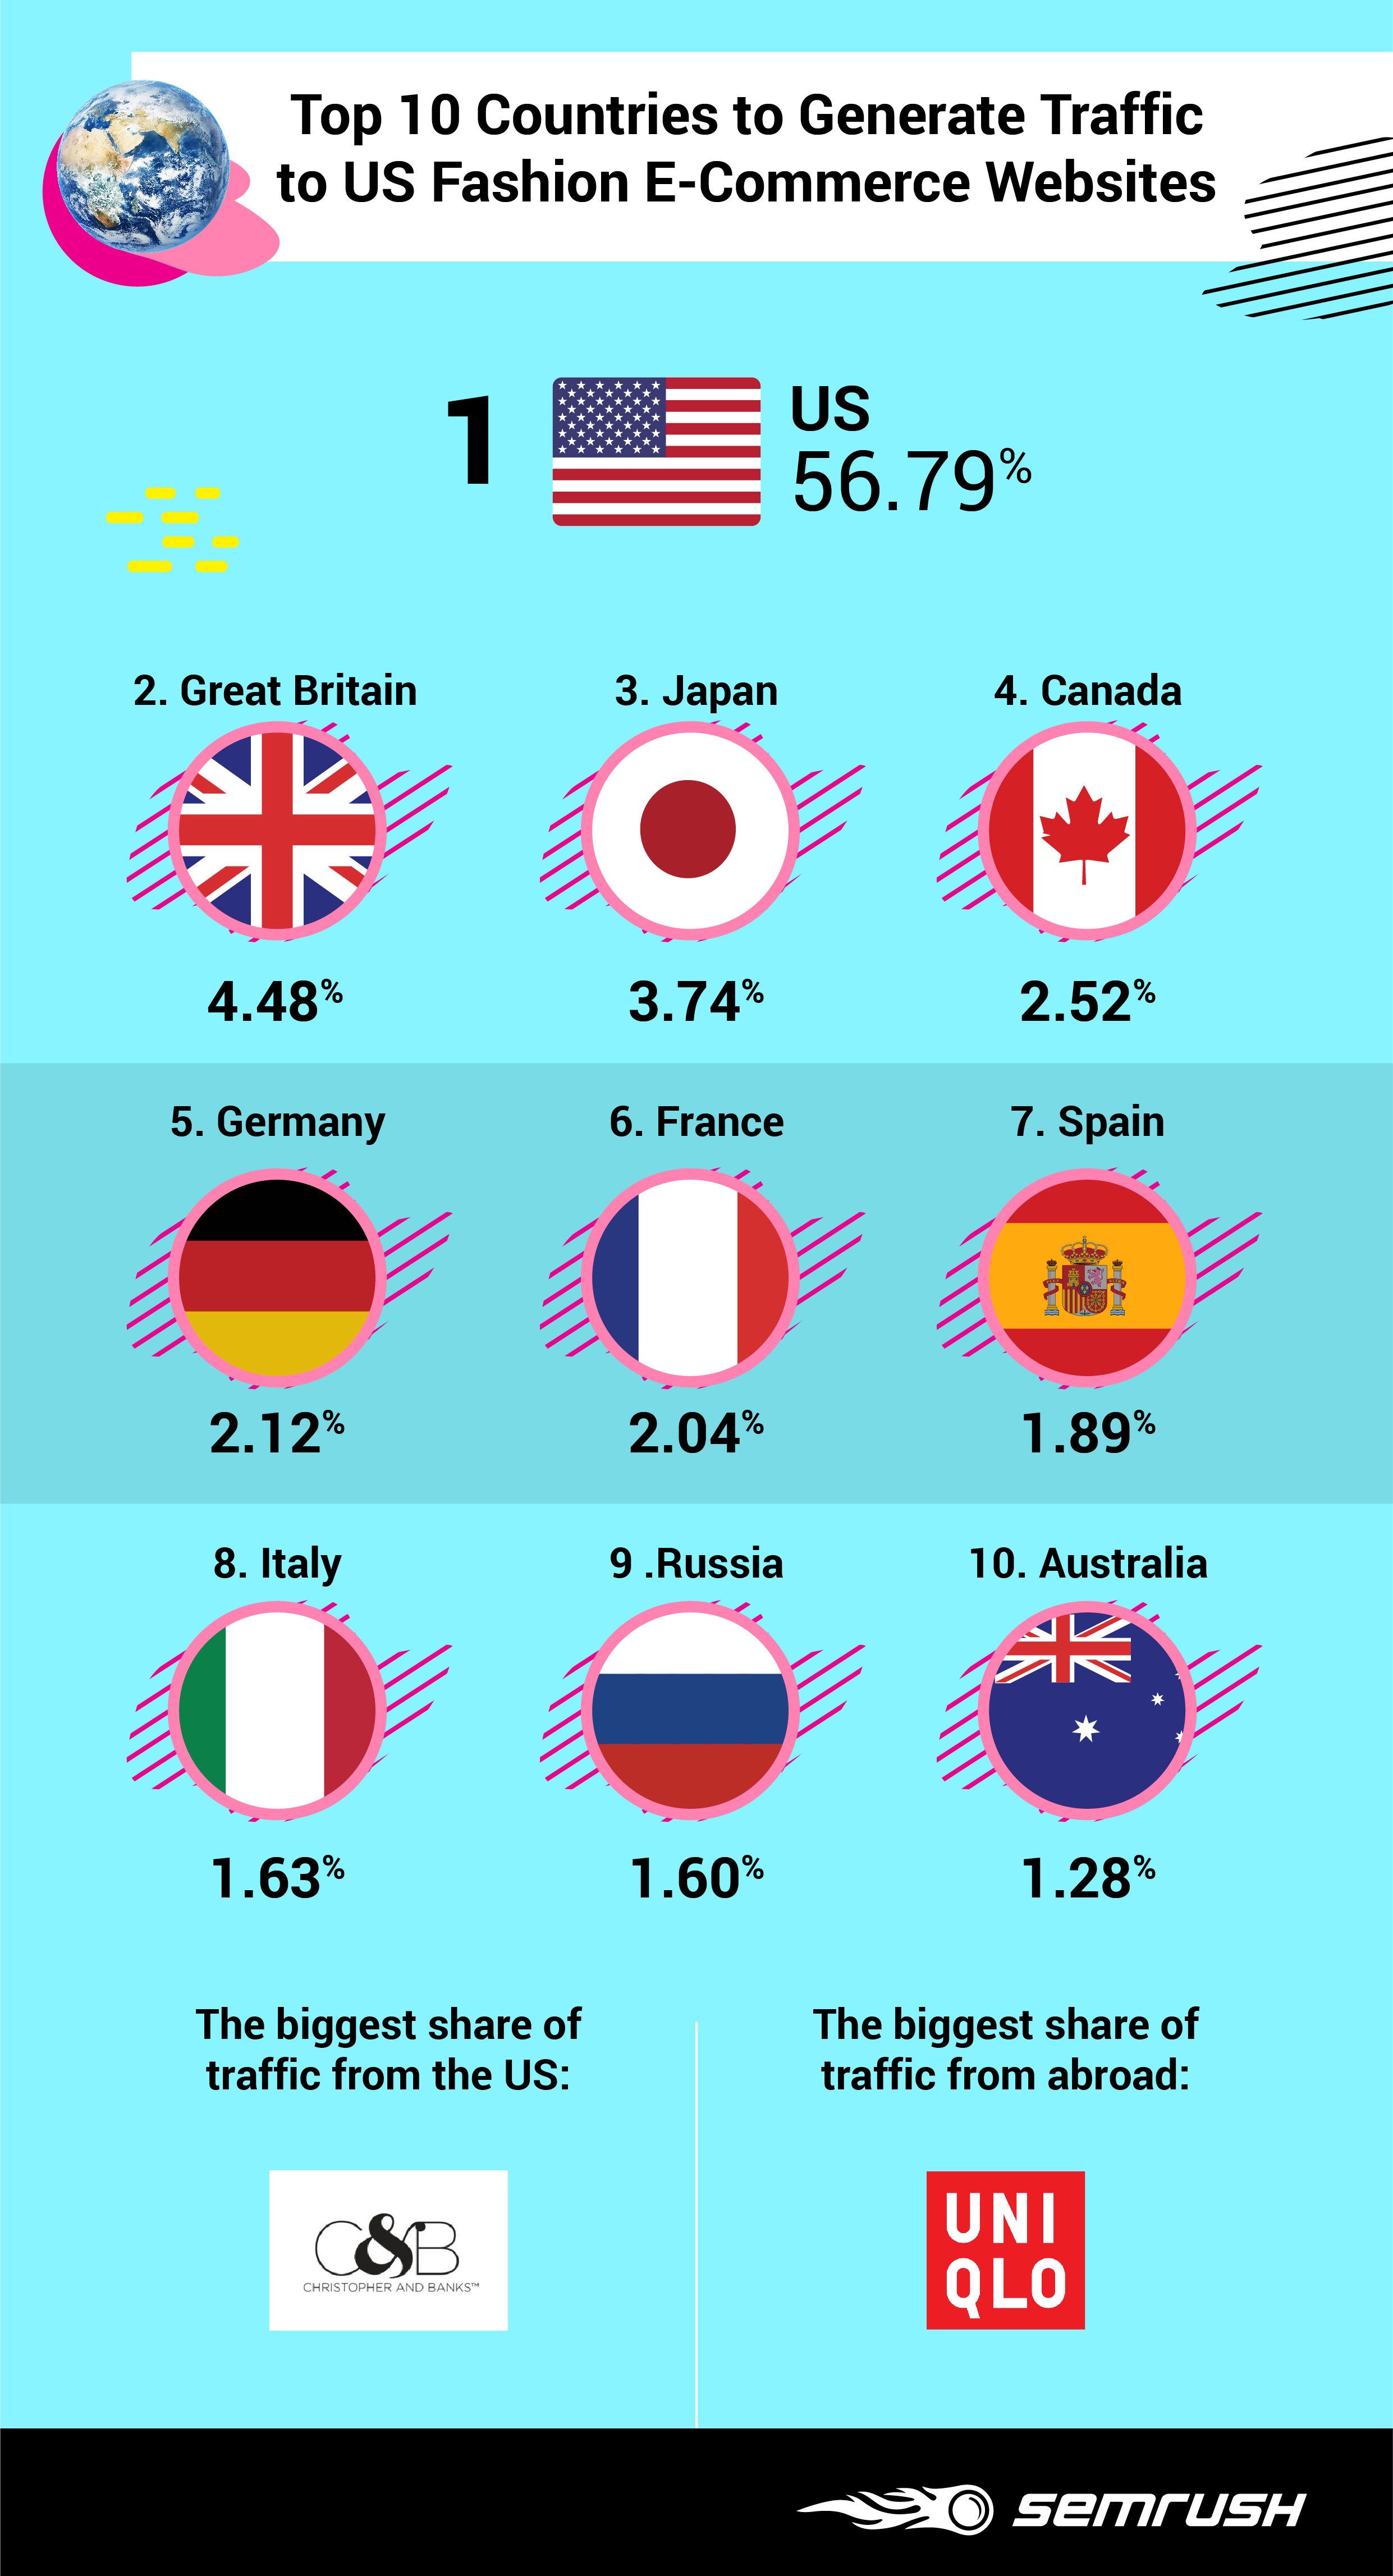
Roughly speaking, shoppers account for 57% of traffic generated by fashion retailers in the US. The individual share of any other country’s is relatively small compared to that and yet it can’t be ignored. For marketing teams, it means adapting their websites and optimizing strategies to feed the needs of their biggest markets outside of the US. Or, if their customers mainly base within the country, it means directing the localization budget to more urgent costs.
Sources of Traffic
In a competitive environment, as the one fashion ecommerce websites deal with, knowledge of traffic sources is critical to optimizing ones marketing efforts. Below you will see interpreted data on each marketing channel. If you are curious about how leaders in each traffic source made a breakthrough, continue your research with the Semrush Traffic Analytics tool. Hacking their marketing tactics will provide you with some optimization ideas for your campaigns.
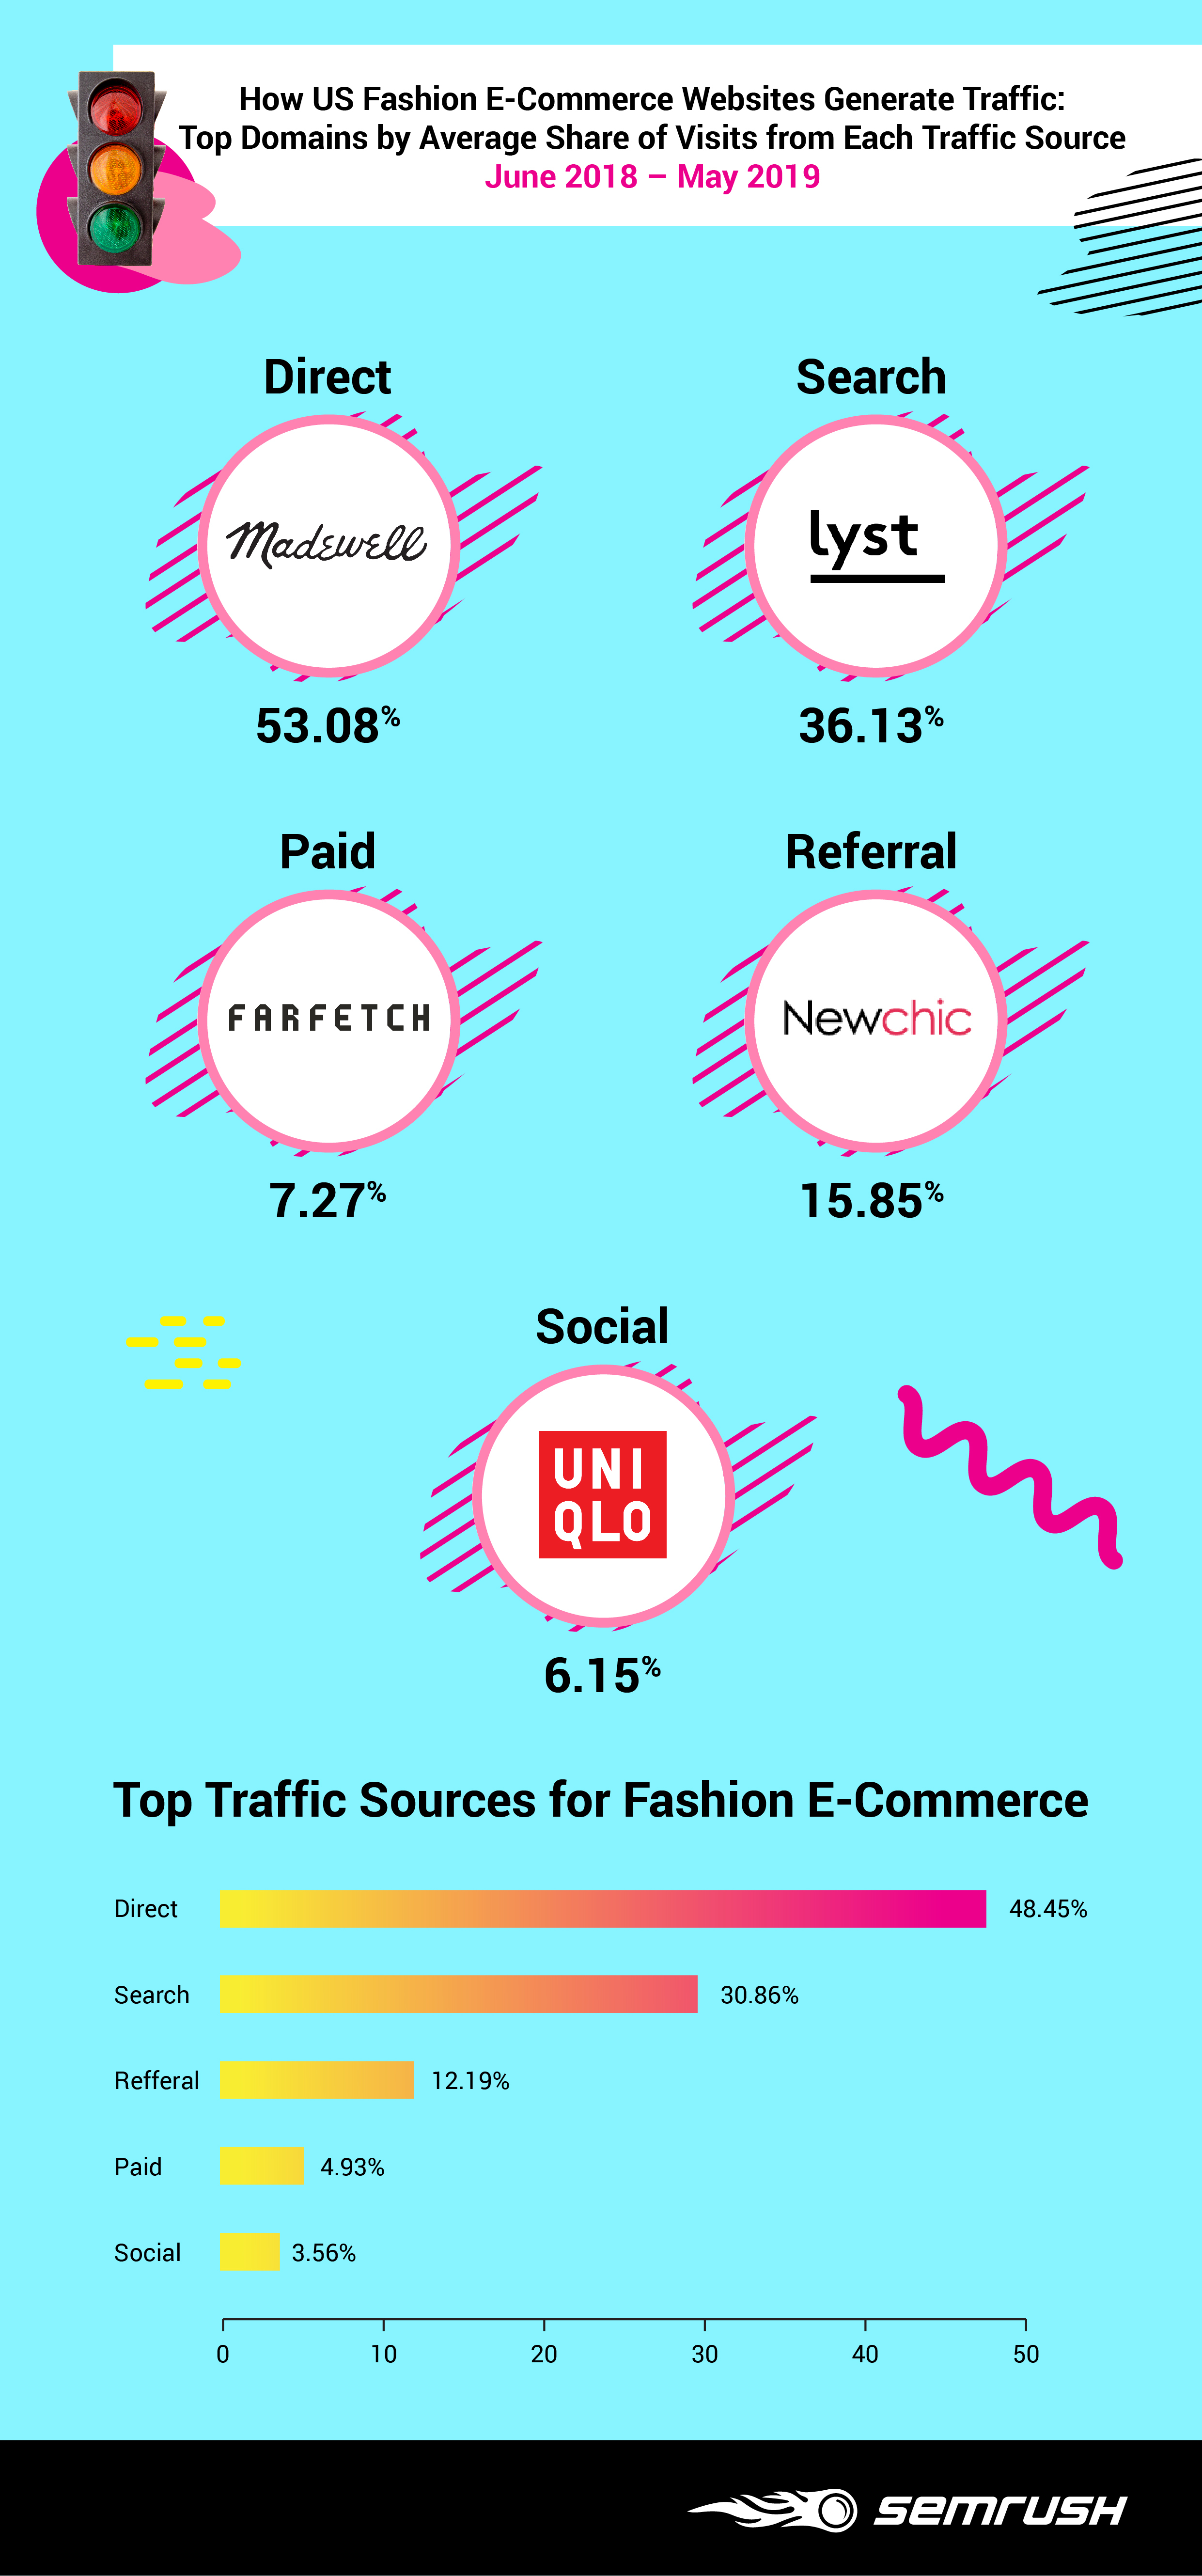
In the US, online fashion stores generated almost a half (48.45%) of their traffic with direct visits, meaning that users knew precisely what domain to type in the search bar. If you would like to know if these were first-time or returning visitors, compare the numbers of Visits and Unique Visits for a particular website. You will obtain actual information for each specific case. In general, a high level of unique direct traffic can stand for strong brand awareness, while recurring direct visits speaks to either customer loyalty or the length of the customer journey.
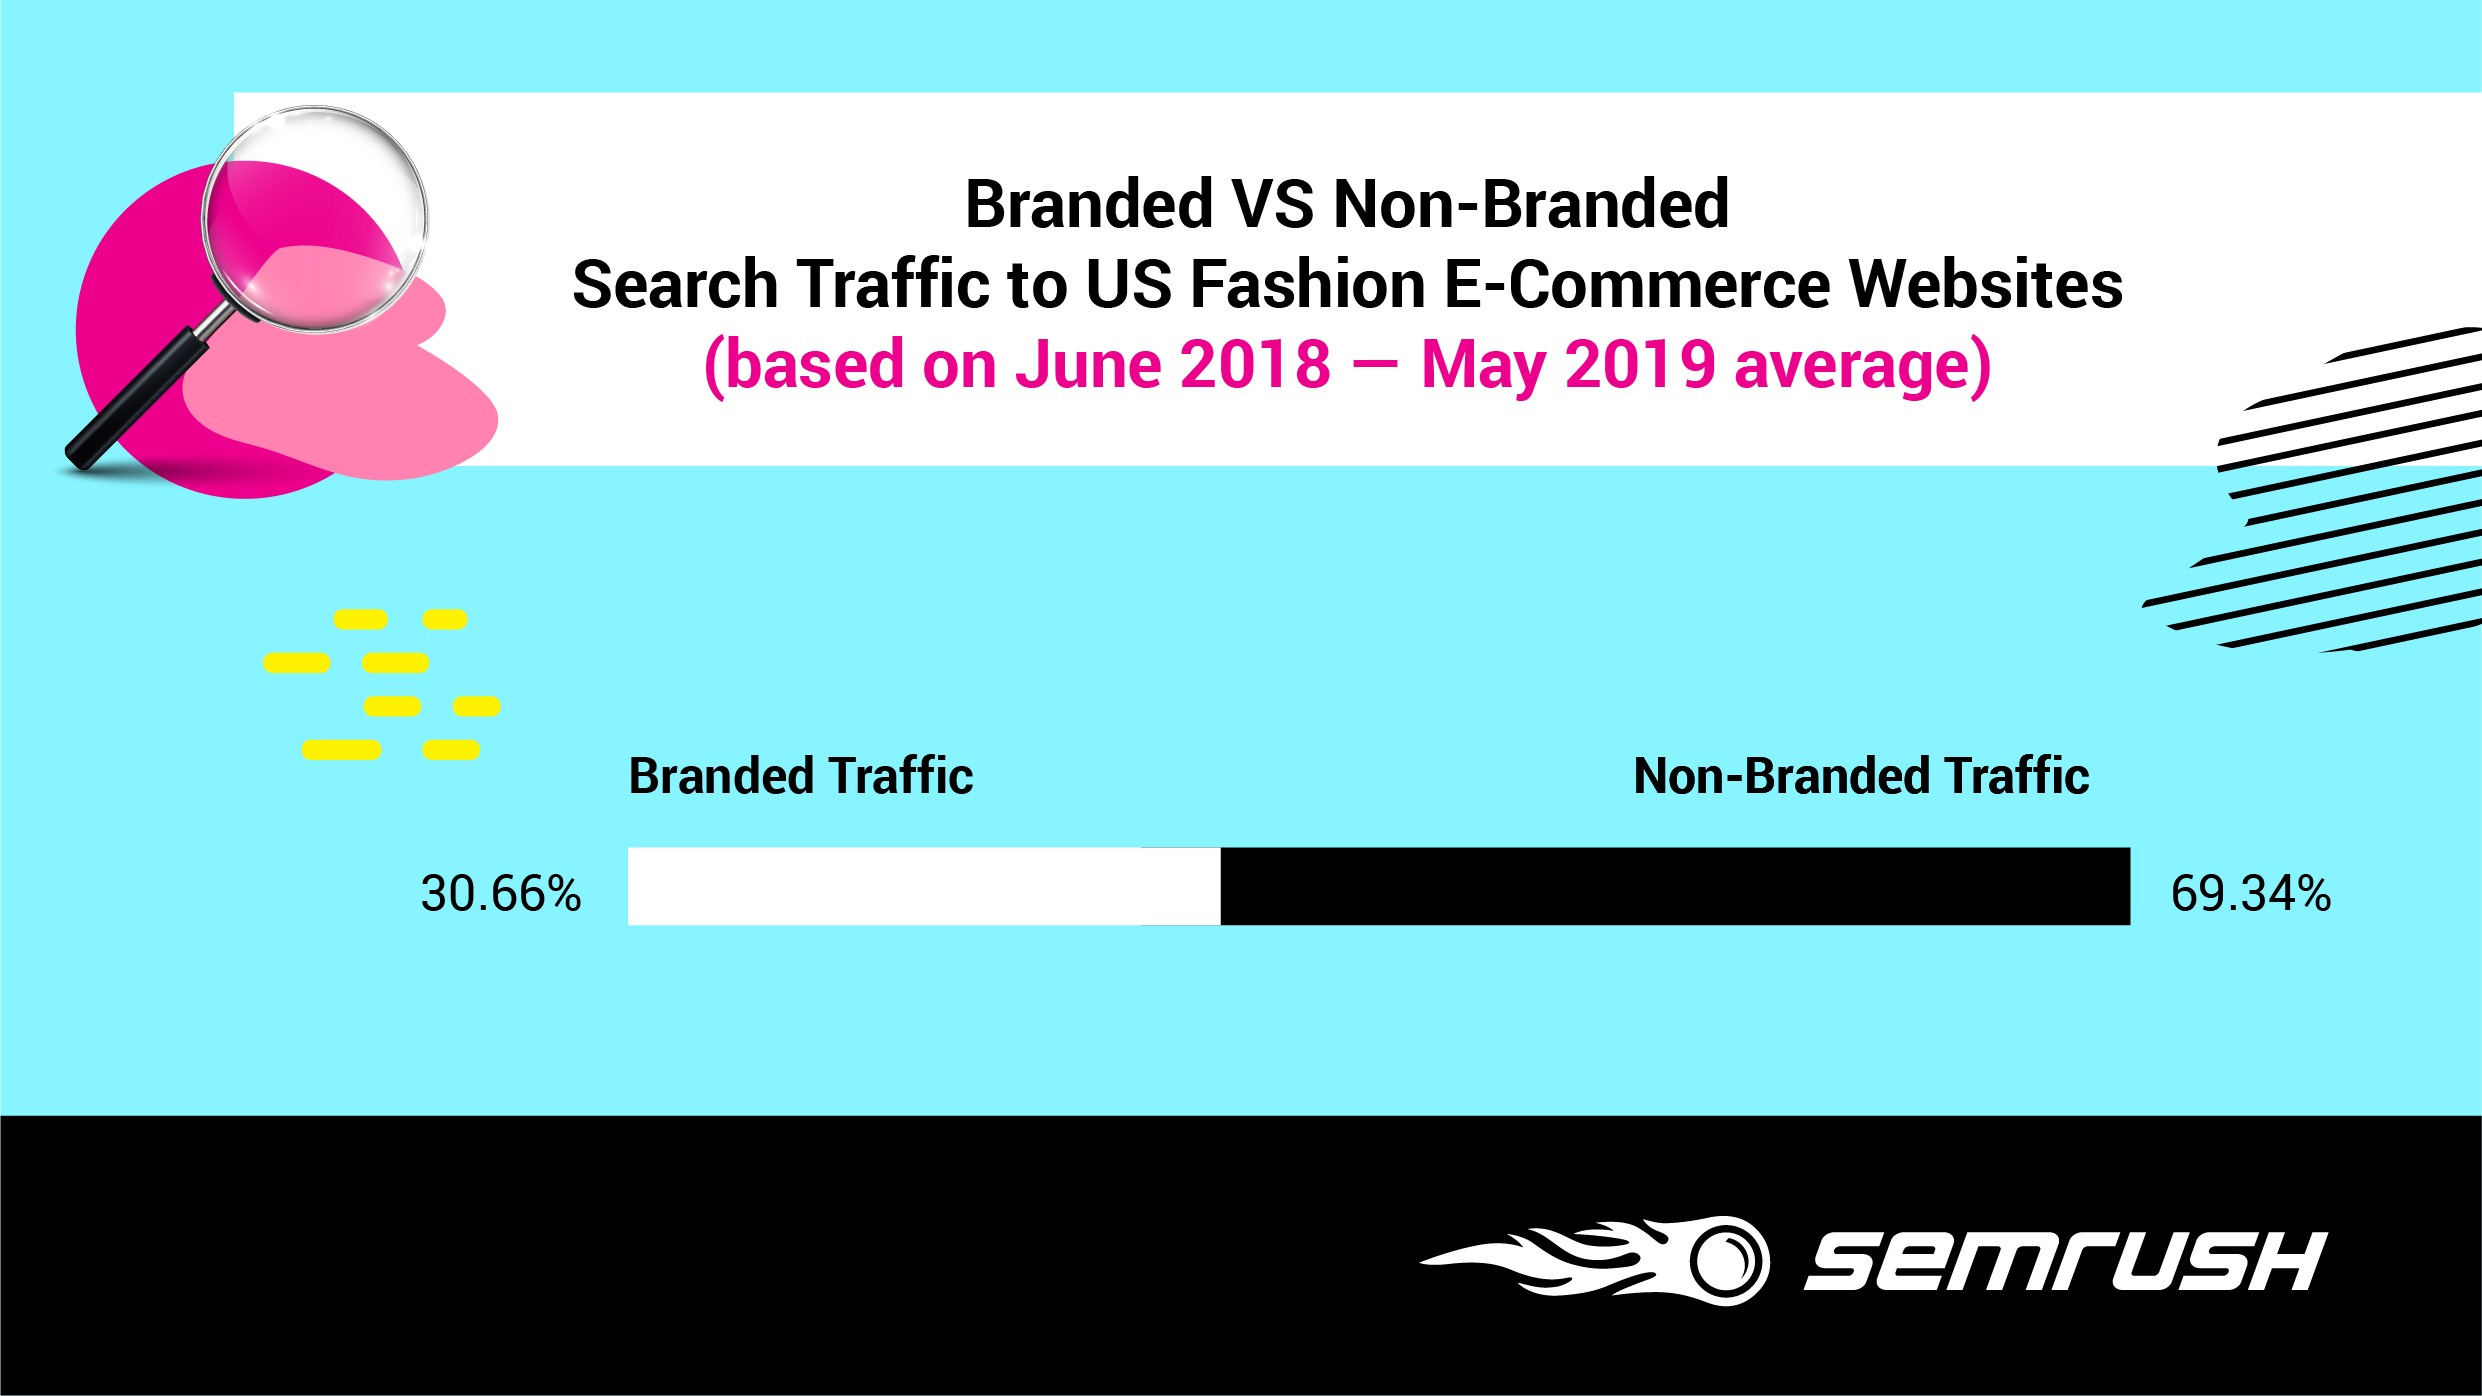
Search traffic ranks second in the list of traffic sources; this metric includes branded and non-branded queries. The predominance of branded organic traffic is another indicator of brand awareness, while success with non-branded visits can be read as a sign of a competent SEO strategy. Given the current digital landscape in the US, fashion brands and aggregators count on maximum search results with a blend of branded tactics — referring to the company’s essential items as well as non-branded options.
Referral traffic analysis reveals which external websites (referring domains) provide backlinks to the studied domains. We went further in our research to provide you with comprehensible categories of sites that drove the biggest amount of traffic to fashion e-tailers.
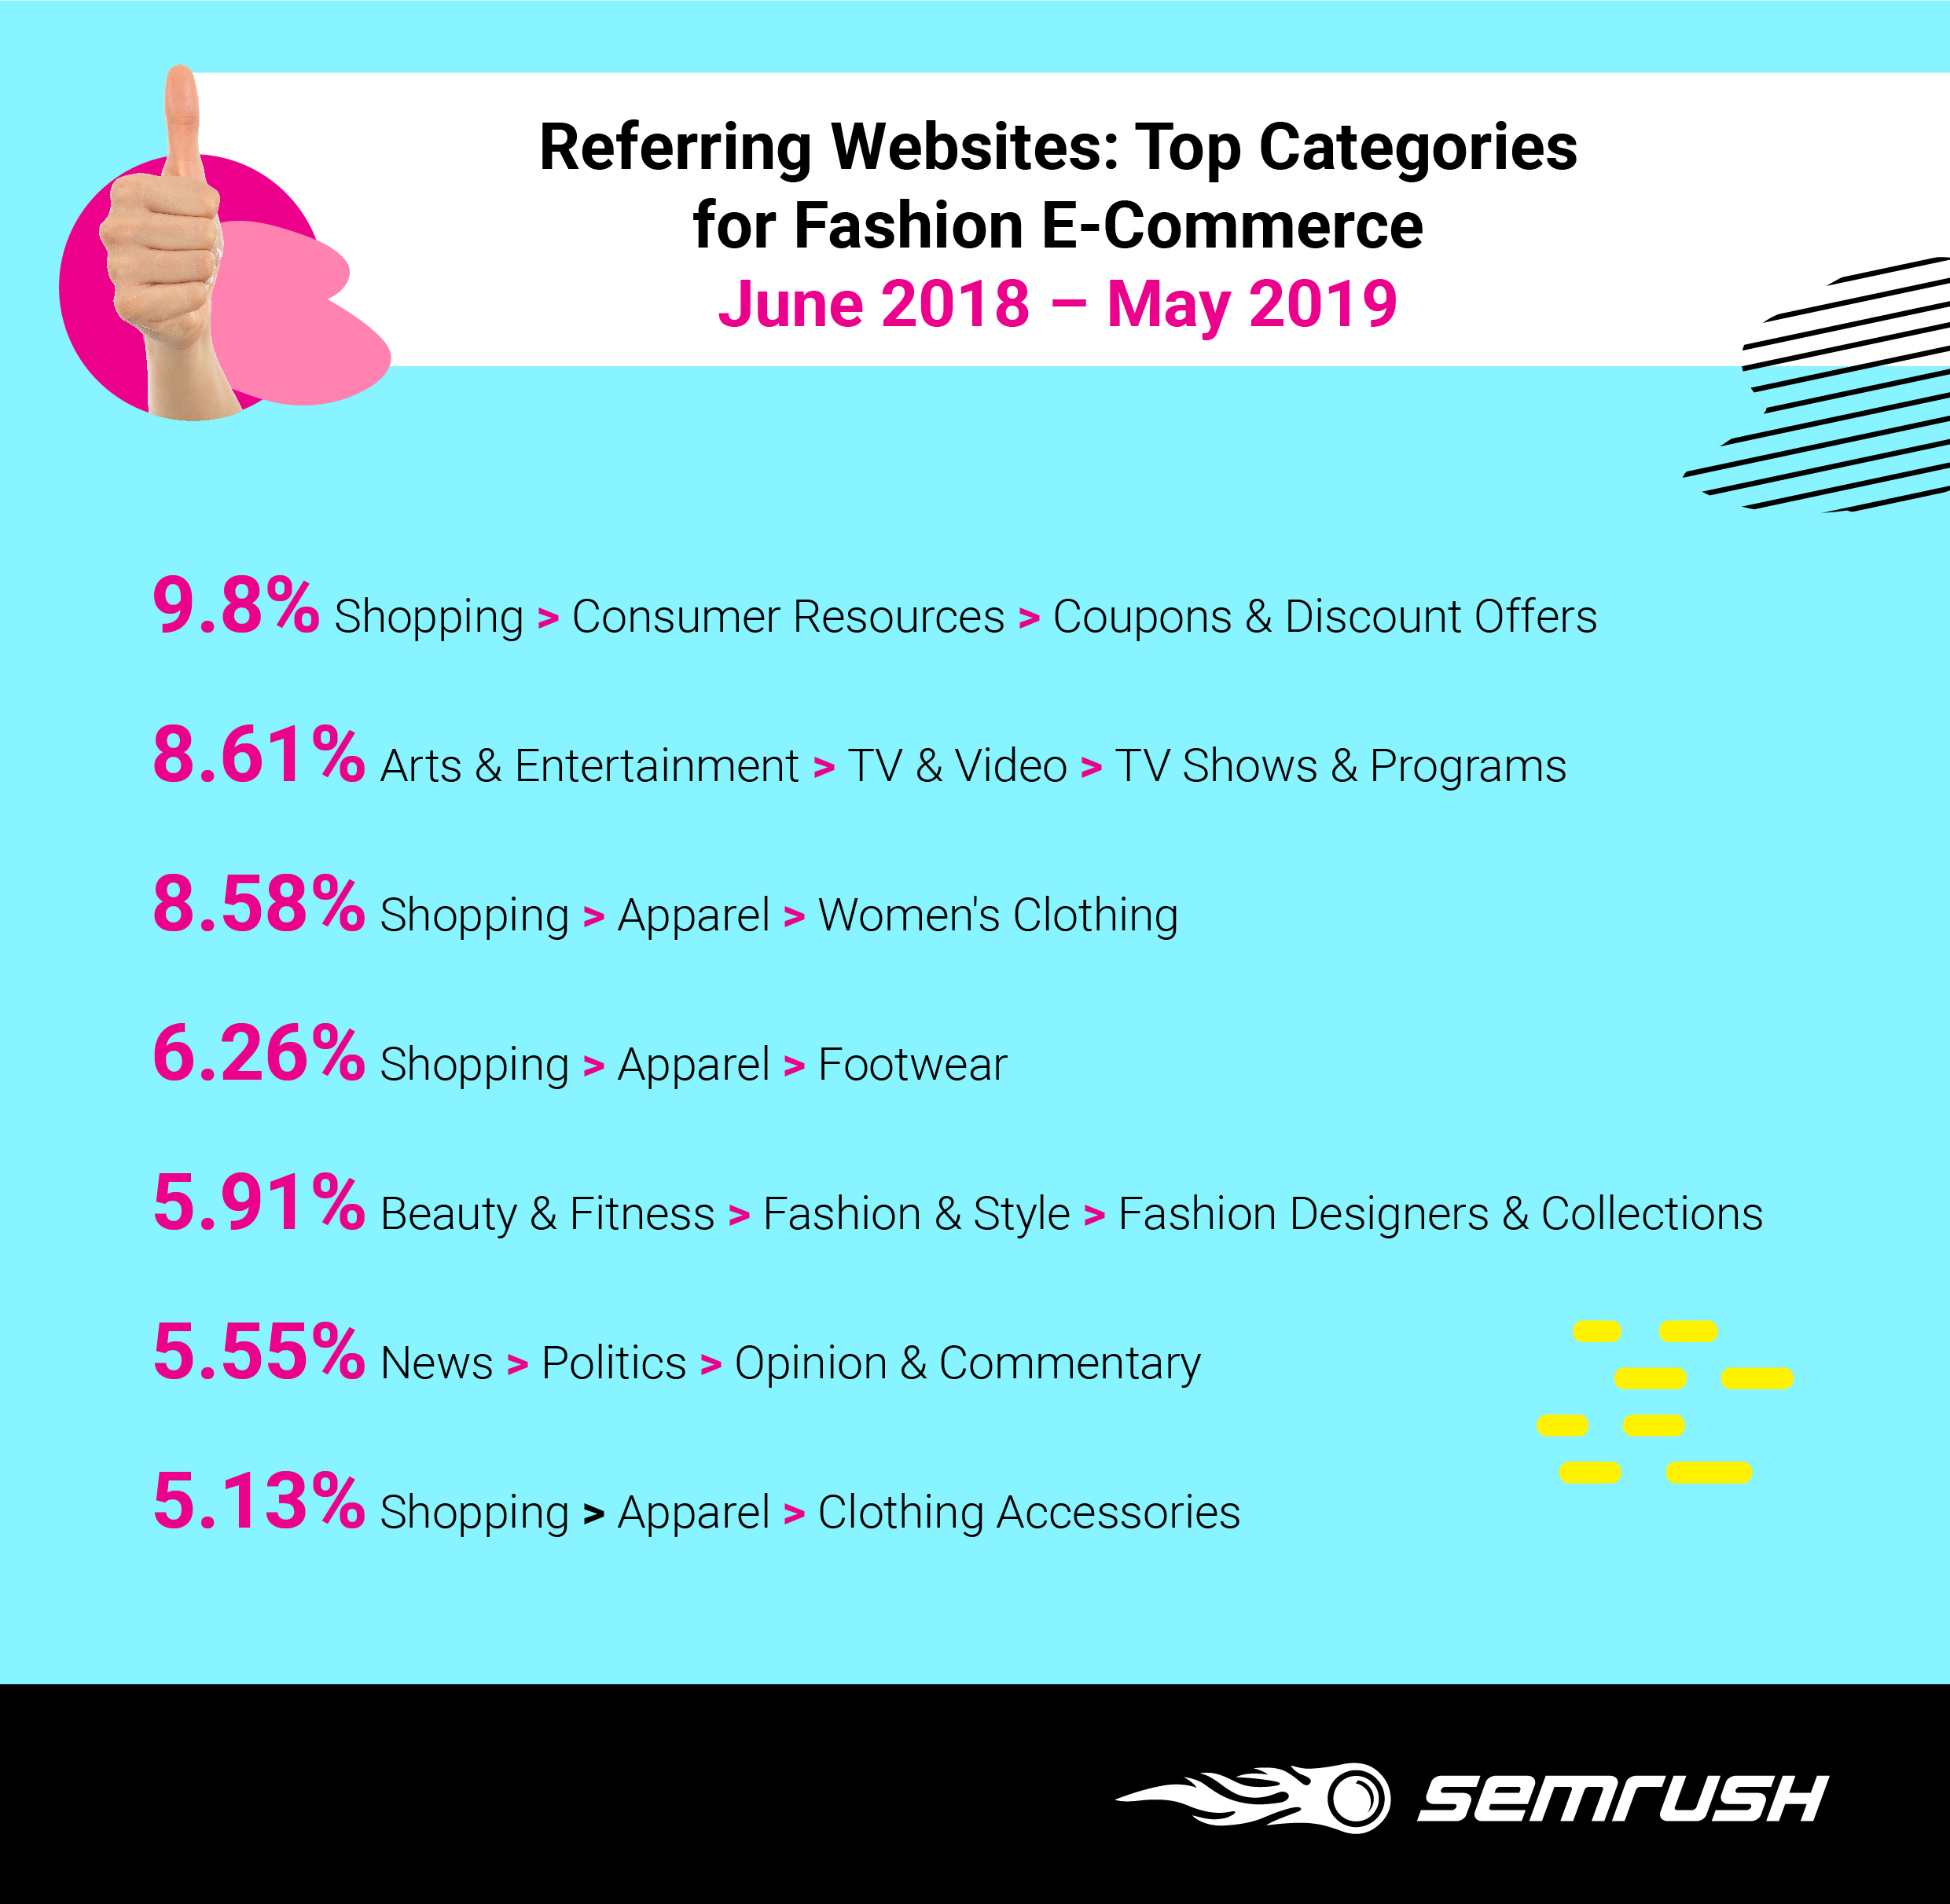
These stats give you a clear idea of what insights you can discover with the knowledge of referring sites. Typically, backlinks are a sign of some sort of co-marketing or business connection between domains. In the above list, 9.8% of referral traffic must have come specifically from affiliate programs.
Another important point we want to mention, it is not only directly related publications that create a quality backlink profile. For fashion ecommerce, television shows and programs turned out to be a resourceful category. The reasons could lie in collaborations between fashion brands and television franchises, the relation of both to the sphere of leisure, or ongoing and still growing interest for a television series. Referring sites give you a hint of where to search for more details — further action and interpretation are your analysts’ business.
Paid sources create hardly 5% of the overall traffic; this means two things for you as an aspiring fashion ecommerce owner or marketer. First, you should not rely solely on advertising and expect it to solve all of your problems with a thousand clicks. Second, it can be the case that lack of paid traffic to your competitors’ is a gap that you could cover. Research the issue more thoroughly, test advertising placements for a short period of time, and decide if they work for you.
As for the social traffic, it takes the smallest share of overall volume if we speak in absolute numbers. However, social networks serve a different purpose — attracting not just high-volume but high-quality traffic. The functionality of platforms like Facebook, Reddit, and YouTube allows marketers to target individuals based on demographics, likes, and interests, which allows marketers to reach the audiences that are most likely to engage with and buy their items. A solid social media presence is a must for a business that aims at optimizing their costs. Focus on a few social networks with the highest potential to generate traffic.
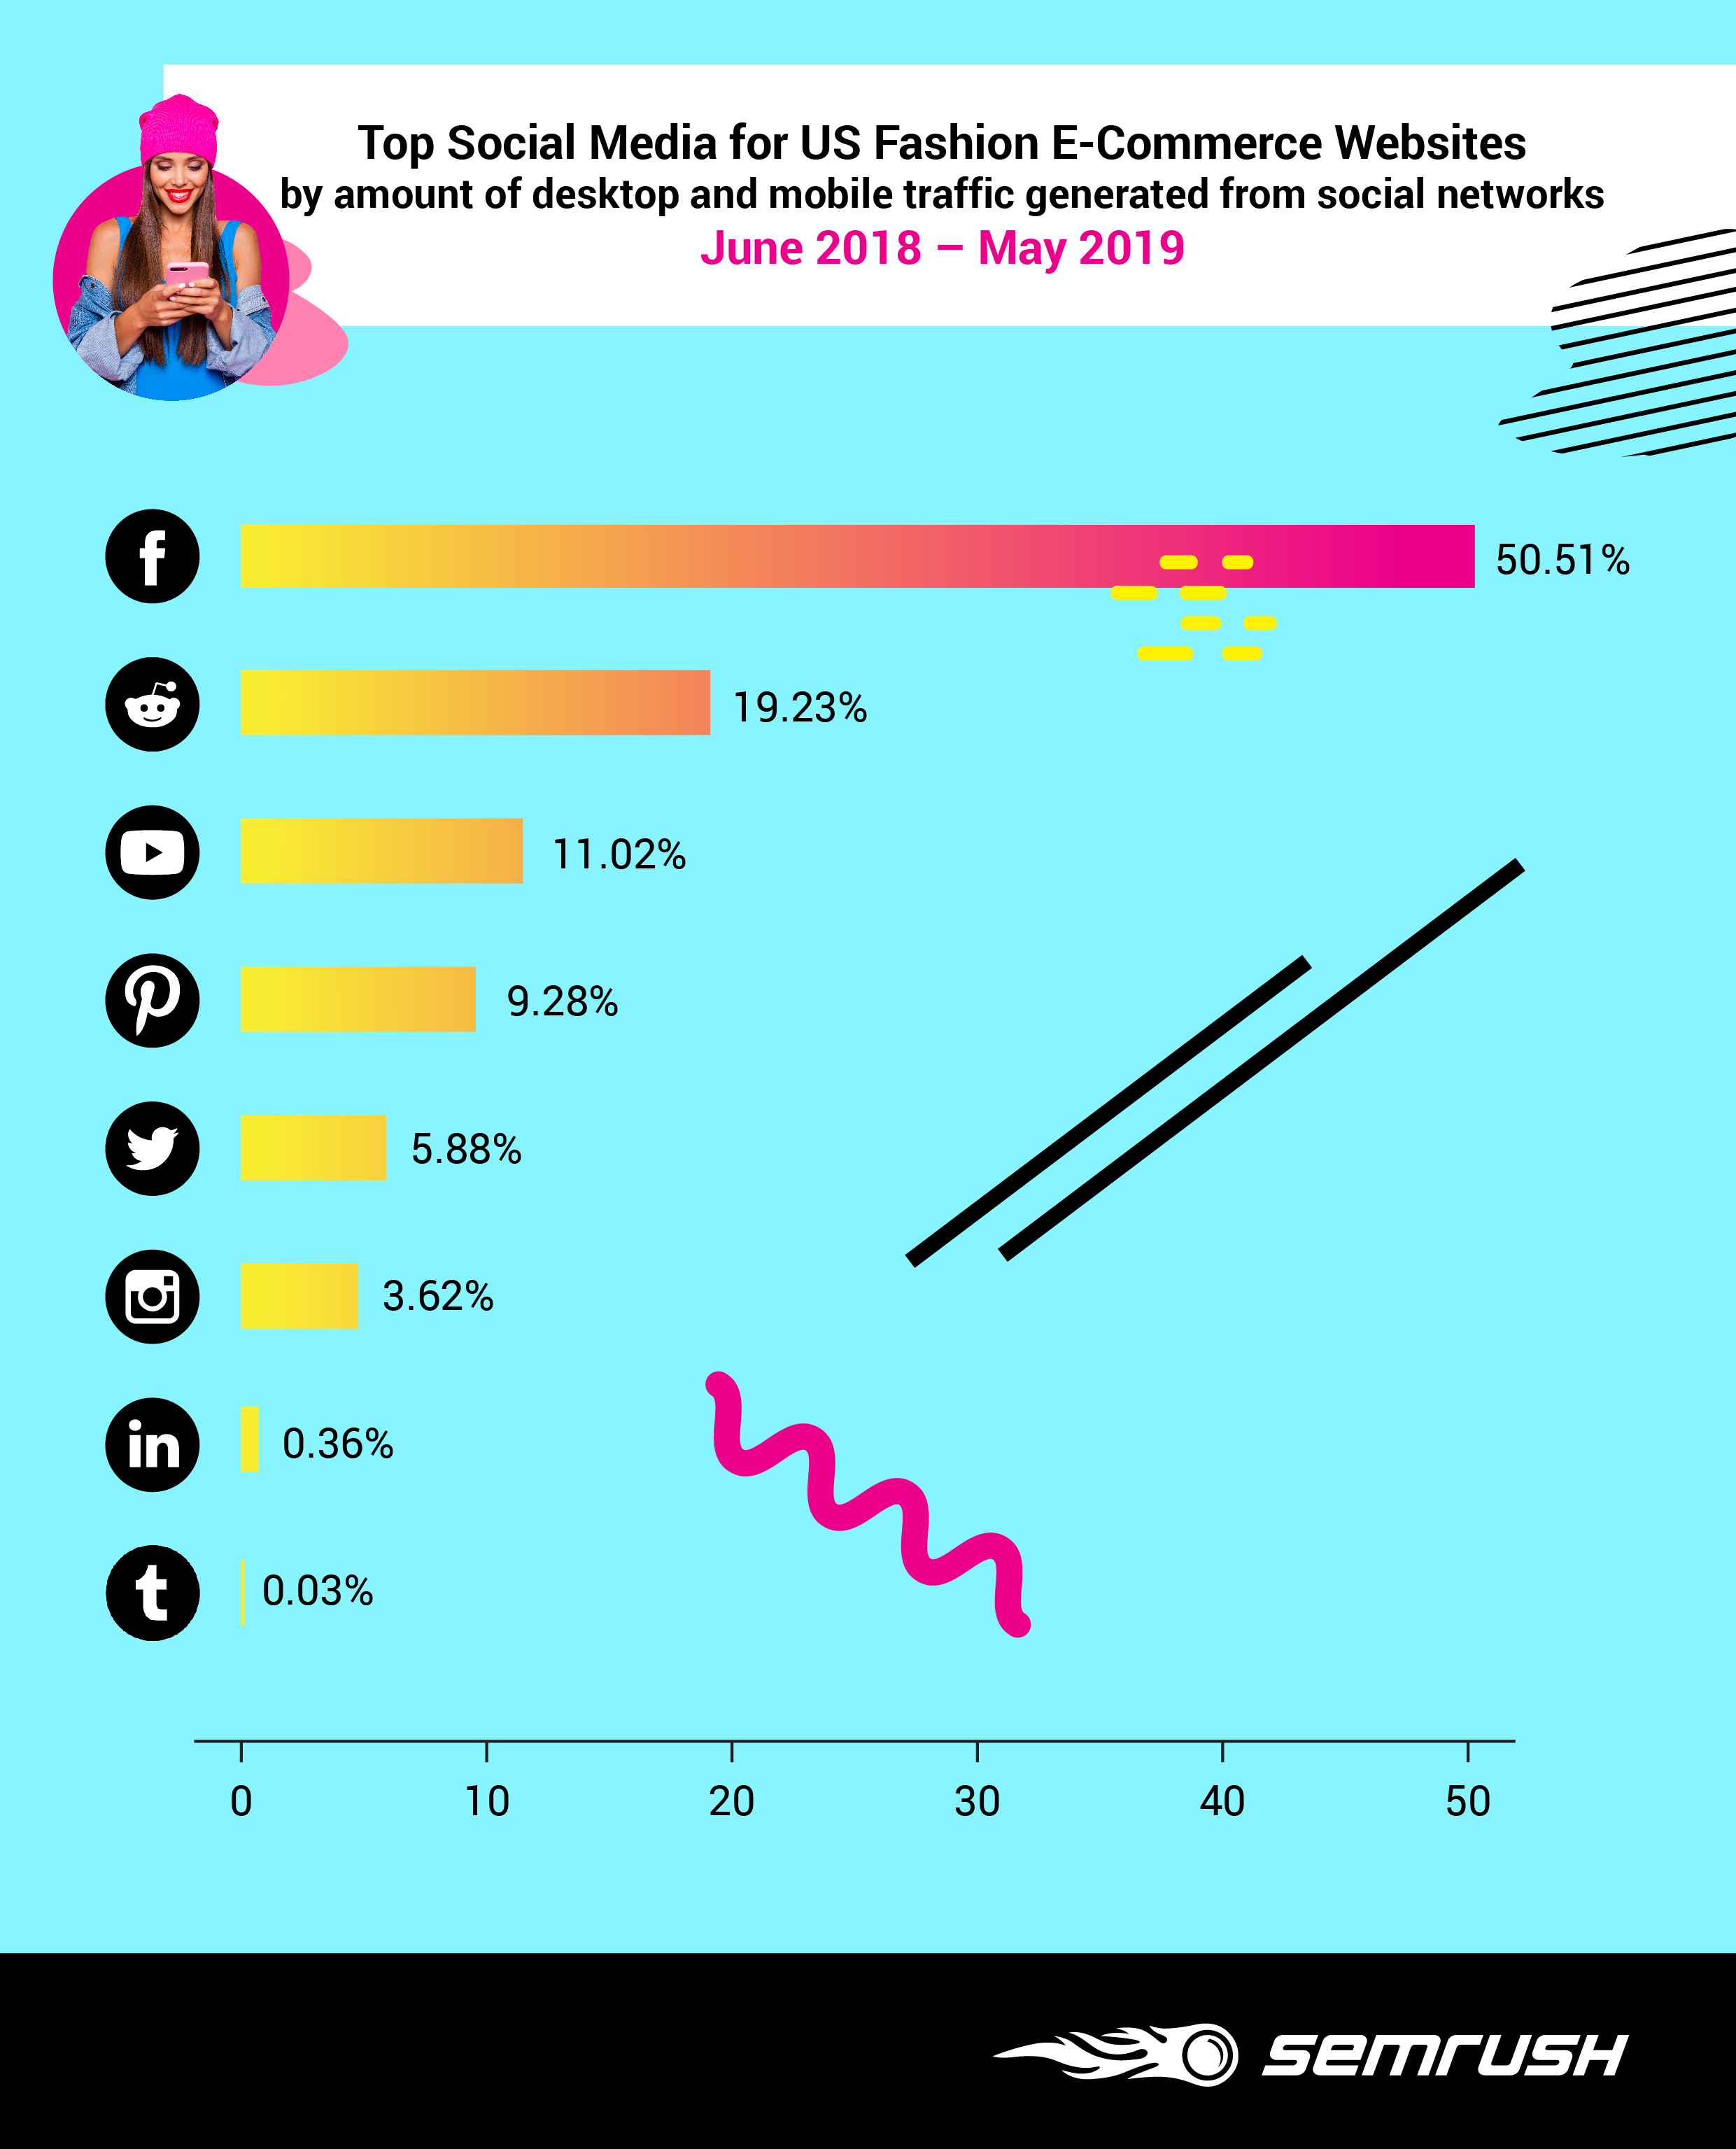
As data indicates, Facebook is the most popular social platform in the US with the vast majority of traffic to fashion ecommerce websites coming from its domain, both from desktop and mobile devices. Reddit, YouTube, and Pinterest follow with popularity shares ranging from 9% to 19%. With these stats, we can say that deploying your social media marketing strategy on these few platforms could result in increased traffic and improved brand awareness.
User Engagement Speaks Volumes
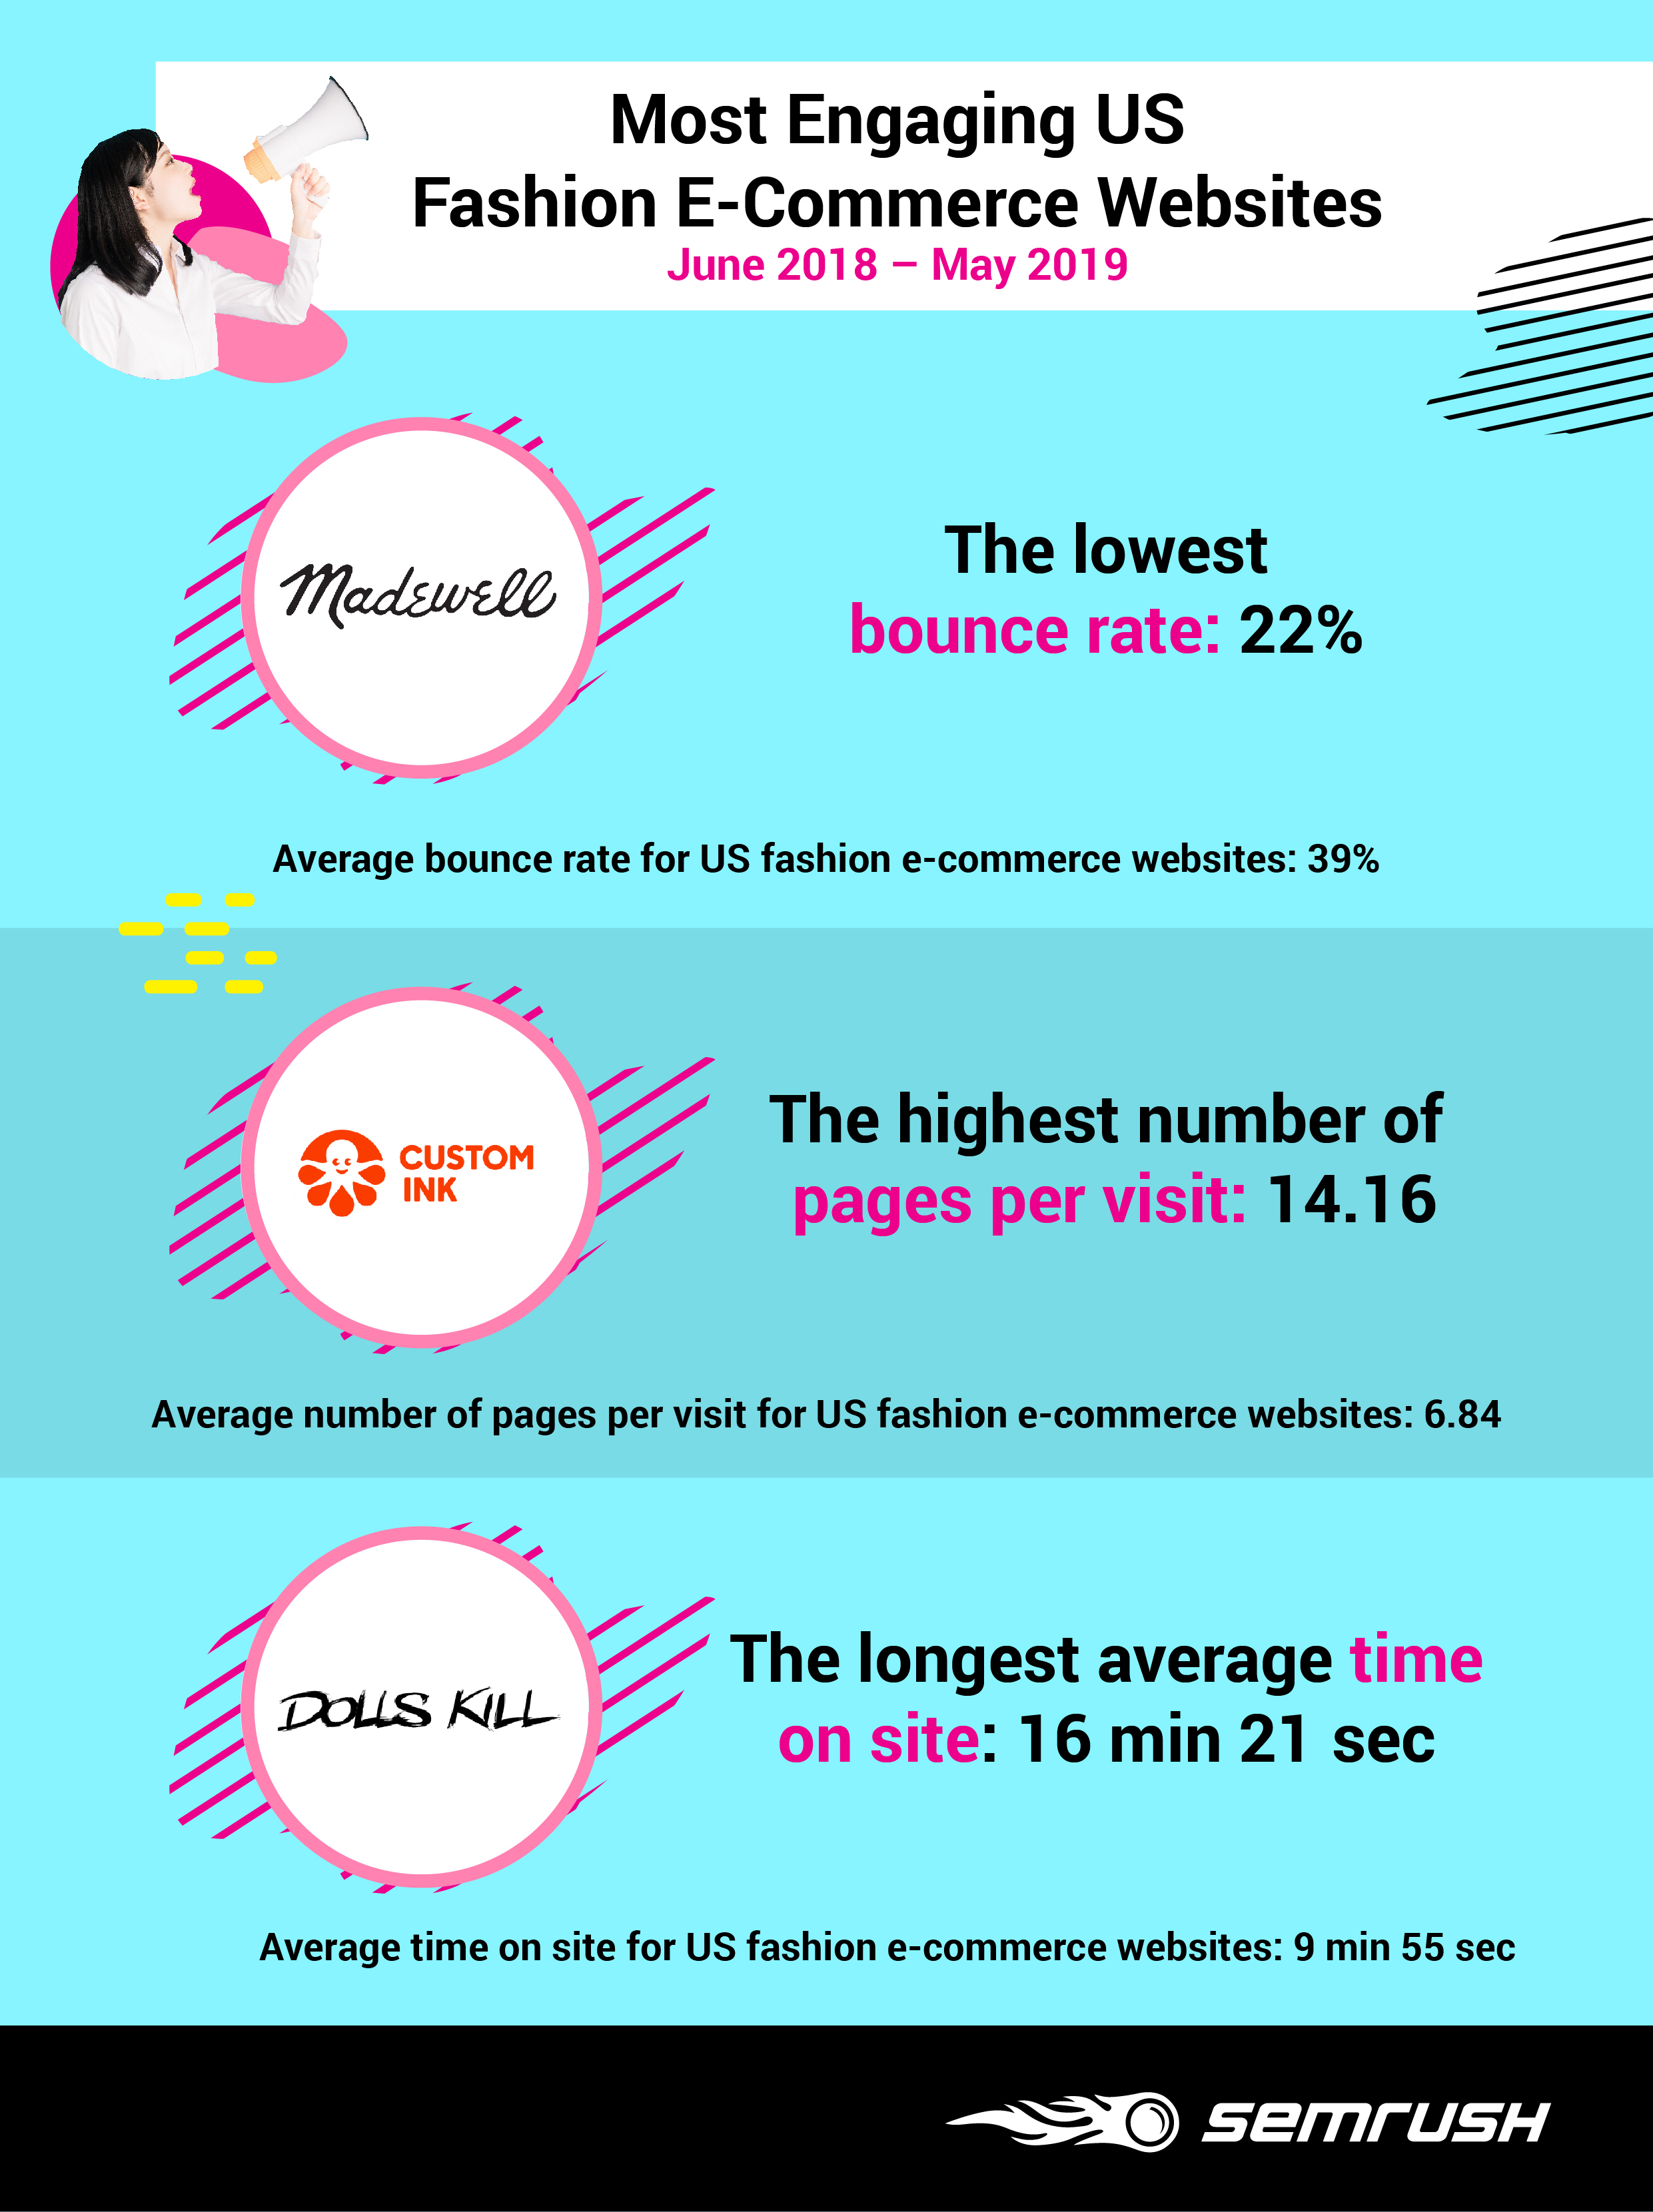
Large Traffic Volume means nothing if it results in a high Bounce Rate. To adjust your marketing strategy the smart way, pay attention to user engagement metrics. For fashion ecommerce, the average time on site and number of pages per visit show the relevance of attracted traffic and the audience’s interest in presented items.
There will be seasons and individual campaigns where a businesses’ top priority will be the amount of traffic — for example, when they are building brand awareness. Other times, user engagement metrics — meaning the relevance of received traffic — should be among the first that you check.
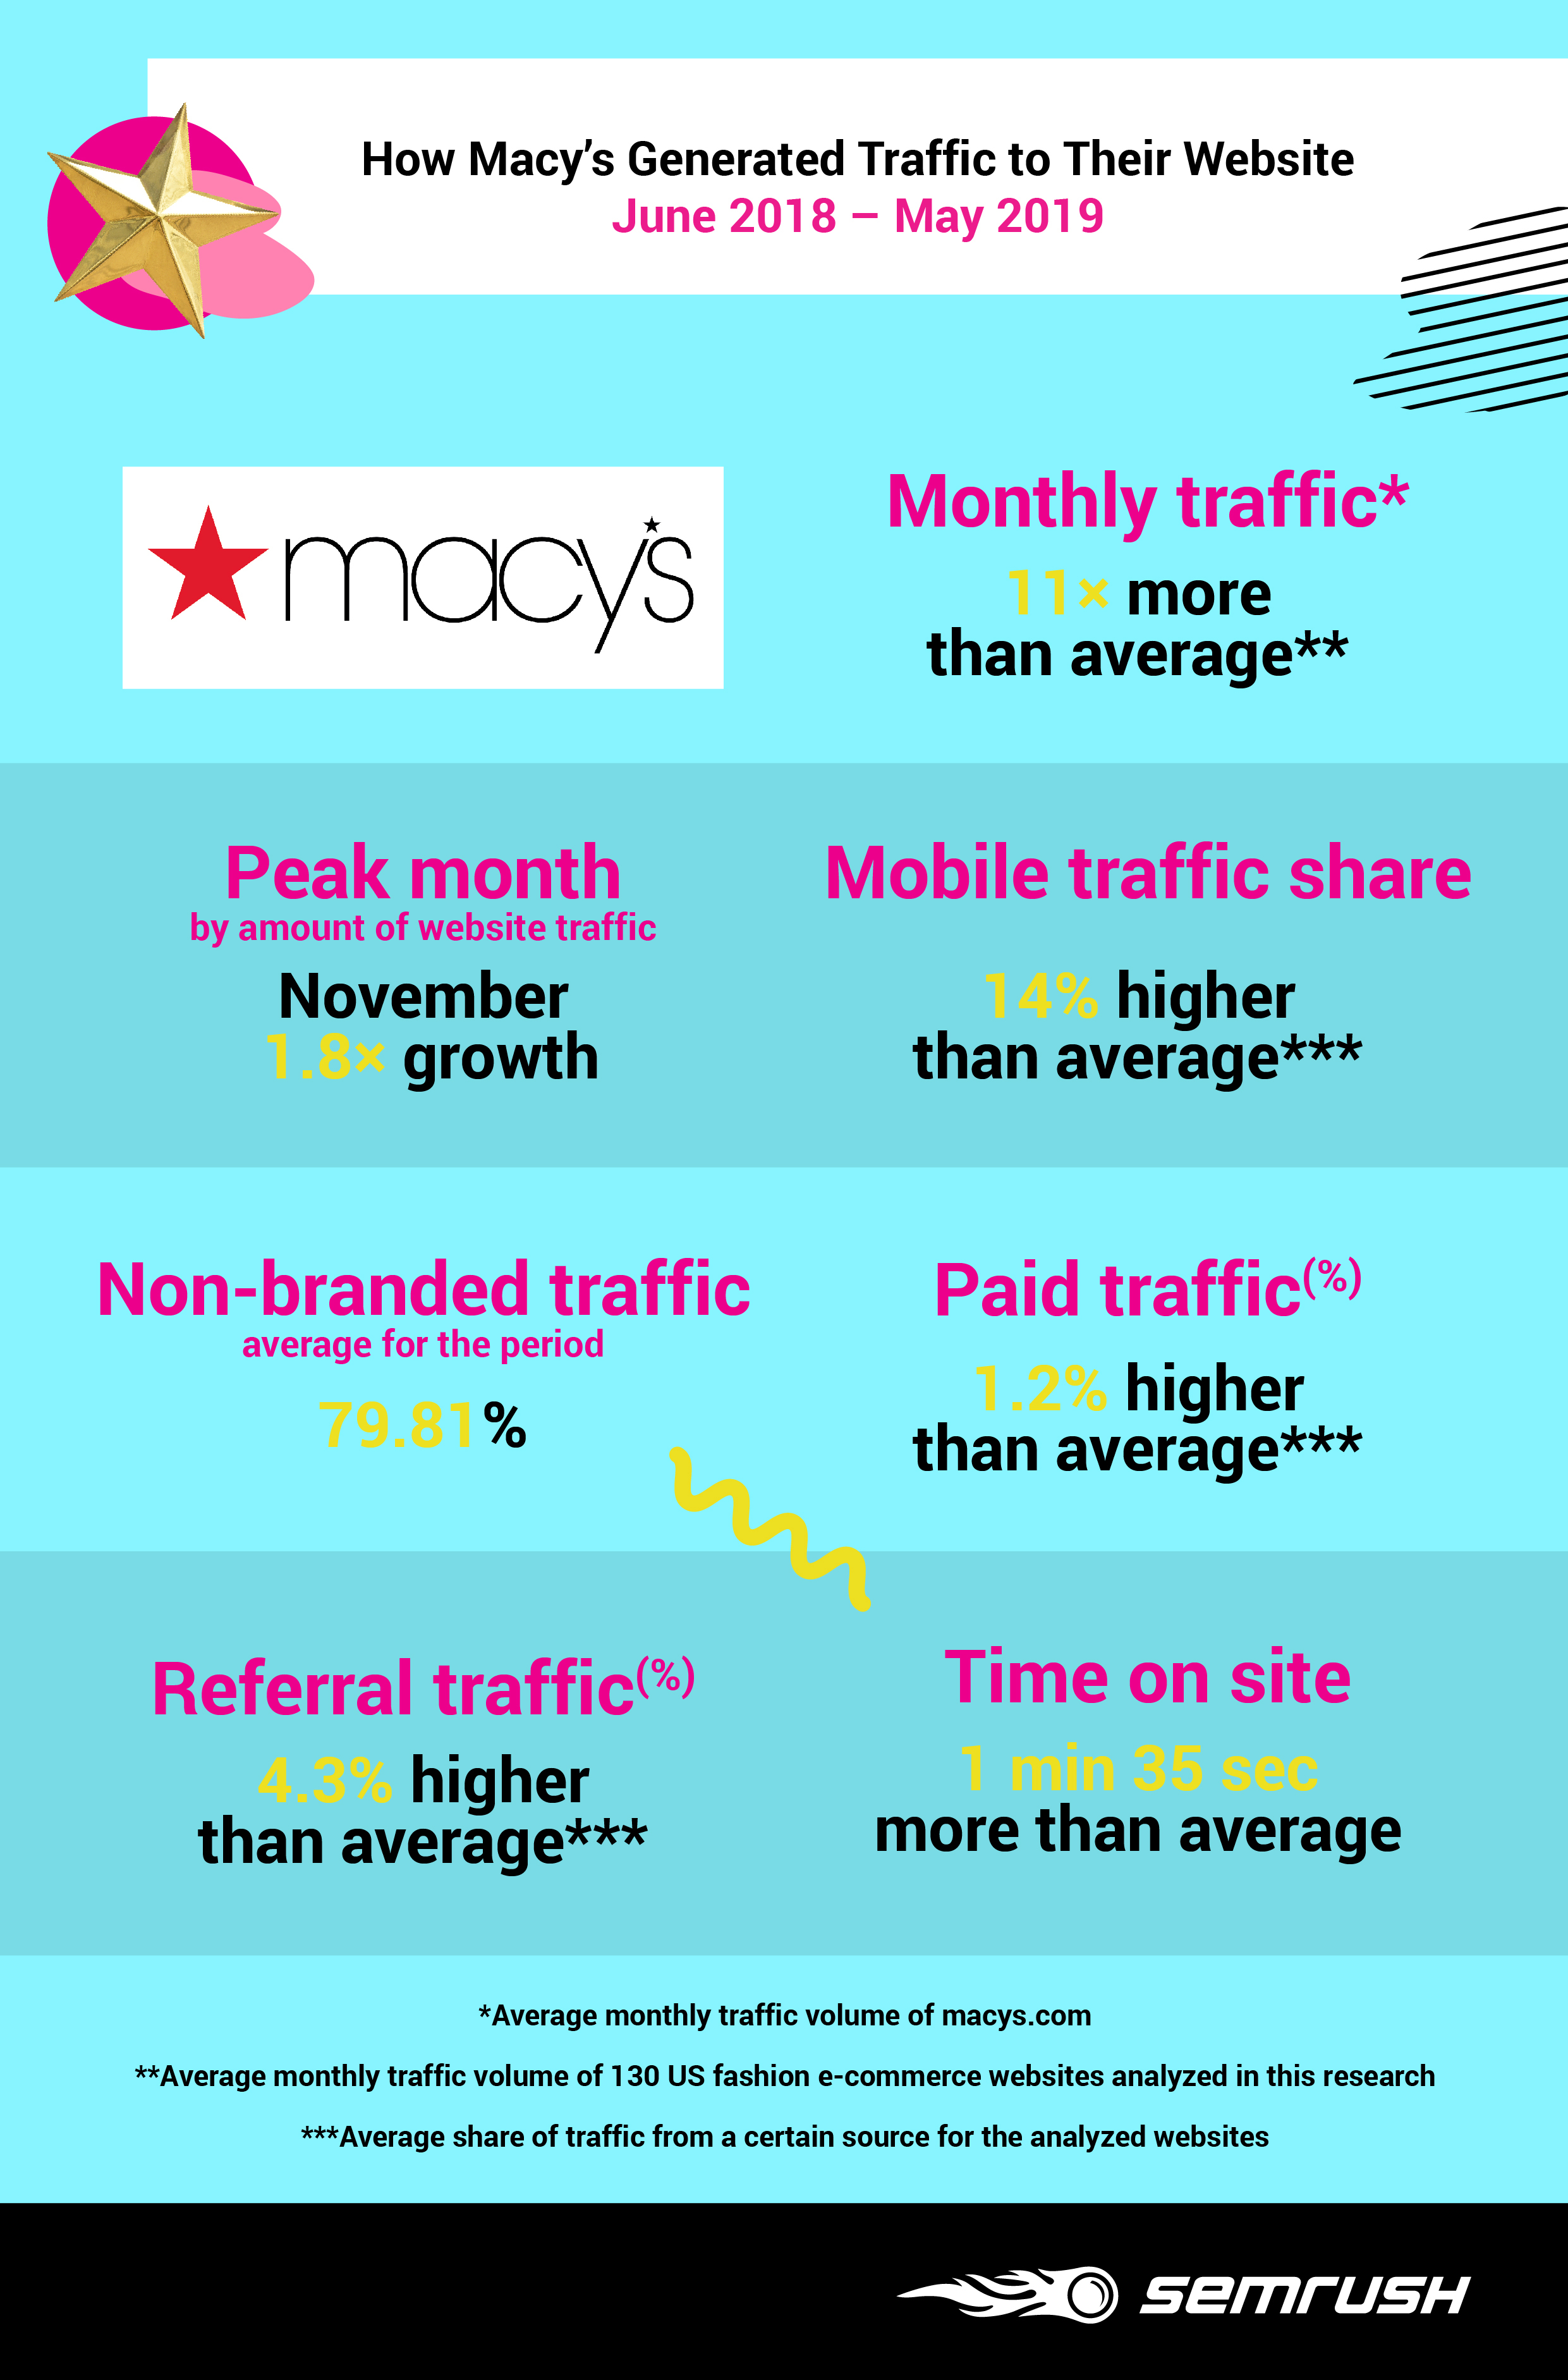
Macy’s: Top Multibrand Fashion Ecommerce in the US
Victoria’s Secret: Top Monobrand Fashion Ecommerce in the US
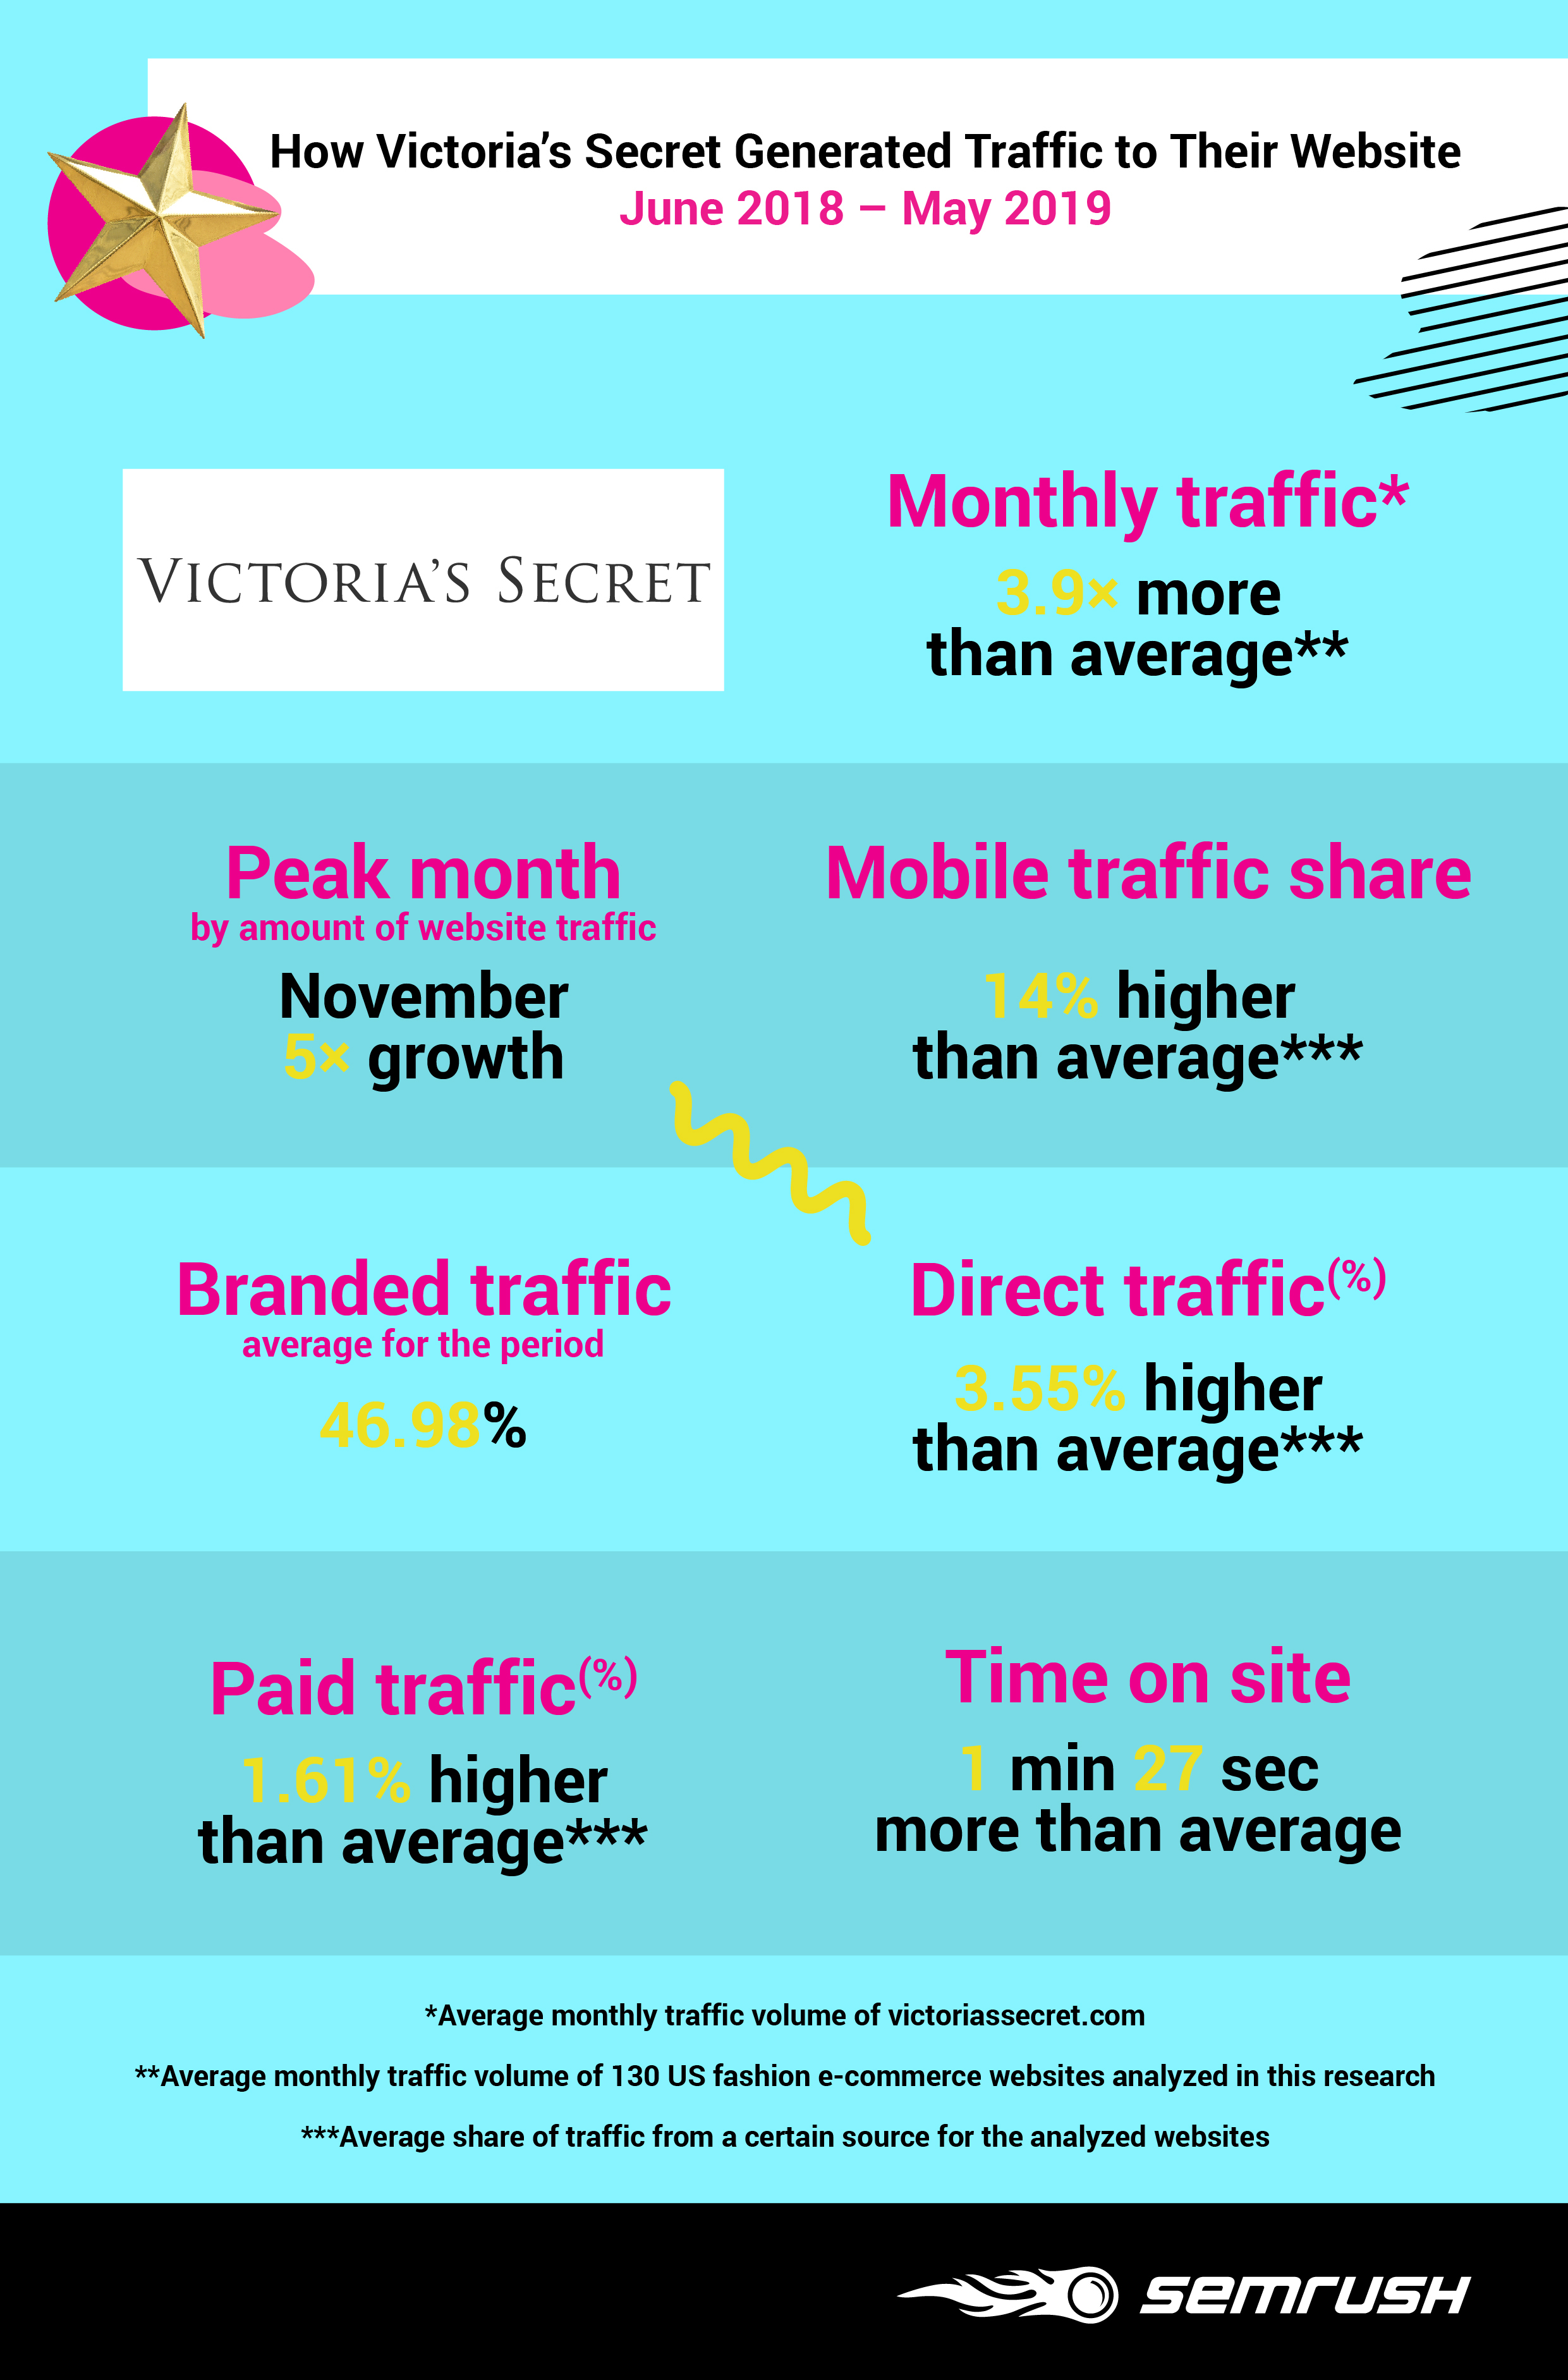
Traffic is definitely not everything you need. If we base the ranking on ecommerce net sales, it will look different: Macy’s will stay the leader (with almost 3.6 million dollars in 2018), but Victoria’s Secret will only be the 8th in the list (with about 1.2 million dollars in 2018). Nevertheless, if the aim of our research is discovering competitors’ digital marketing strategies, it is traffic that tells us the most.
How to Use These Findings
If you work in the sphere of ecommerce in general, and online fashion retail specifically, these benchmarks of key industry players can form the basis of your company’s analytics and make ground for prompt decisions. If you are thinking of expanding to the US market, these findings will be your guide to action when forming a marketing strategy there.
If you observe this data from a higher level, you may want to consider the main trends:
A dramatic shift from desktop to mobile. Annually, as much as 158 million additional users access fashion ecommerce websites via mobile devices than desktop. Therefore, focusing your marketing strategy around mobile users will be imperative for fashion brands in the days to come. While the trend is growing, desktop will remain essential and should not be neglected, especially for those that are targeting particular audiences.
Brand awareness may be as important as an ongoing promotion. With most of the traffic being direct, fashion ecommerce websites may prefer to invest in PR mentions and partnerships rather than leave their performance to advertising leads.
Seasonal ups and downs are not limited to holidays and natural change in product demand. There is more to research in each traffic source and each geographical market.
Following the industry leader is the best practice. Even if your fashion ecommerce cannot account for the amount of traffic that Macy’s, Victoria’s Secret, and even ASOS have, analyzing their techniques and using them as a model certainly pays off.
Finally, use the template below to carry out your own research and reveal intriguing insights about your competitors as we did.
Competitor Analysis Template

Innovative SEO services
SEO is a patience game; no secret there. We`ll work with you to develop a Search strategy focused on producing increased traffic rankings in as early as 3-months.
A proven Allinclusive. SEO services for measuring, executing, and optimizing for Search Engine success. We say what we do and do what we say.
Our company as Semrush Agency Partner has designed a search engine optimization service that is both ethical and result-driven. We use the latest tools, strategies, and trends to help you move up in the search engines for the right keywords to get noticed by the right audience.
Today, you can schedule a Discovery call with us about your company needs.
Source:


