Experienced marketers know their company’s rivals inside and out, and they know that there are always more competitive insights to discover. From marketing trends to competitive landscape analysis, traffic dynamics among key players within your market can reveal a lot.
Let’s look at some of the more complex findings that your rivals’ website traffic metrics can deliver. Set your clock: we have 30 minutes and 6 hidden points to uncover.
We found the insights below with the help of Market Explorer and Traffic Analytics.
If you want to learn how to reveal the specific website traffic metrics of your competitors, please refer to this article. For more detail on online competitor analysis, check out our extensive guide
Competitive Insight #1: Who Is Really Leading the Market?
When planning a marketing campaign, you may be looking at your company’s main rival for insights and strategies, but are you looking at everything you should?
If you only judge your competitors by brand awareness, estimated market share, or frequency of PR appearances, you may be missing the competitor who has the best reach and traffic.
Check out the top 5 competitors that are neck and neck with you for a more legitimate digital benchmark.
Identify the one with the highest traffic volume in the last 12 months; note whether they showed exponential or stable growth and if they had any decreases over a given period. Whether it correlates with offline popularity or not, take this company’s website as a benchmark and build your campaigns with an understanding of their successful and unsuccessful activities.
Let's look at some example data below:
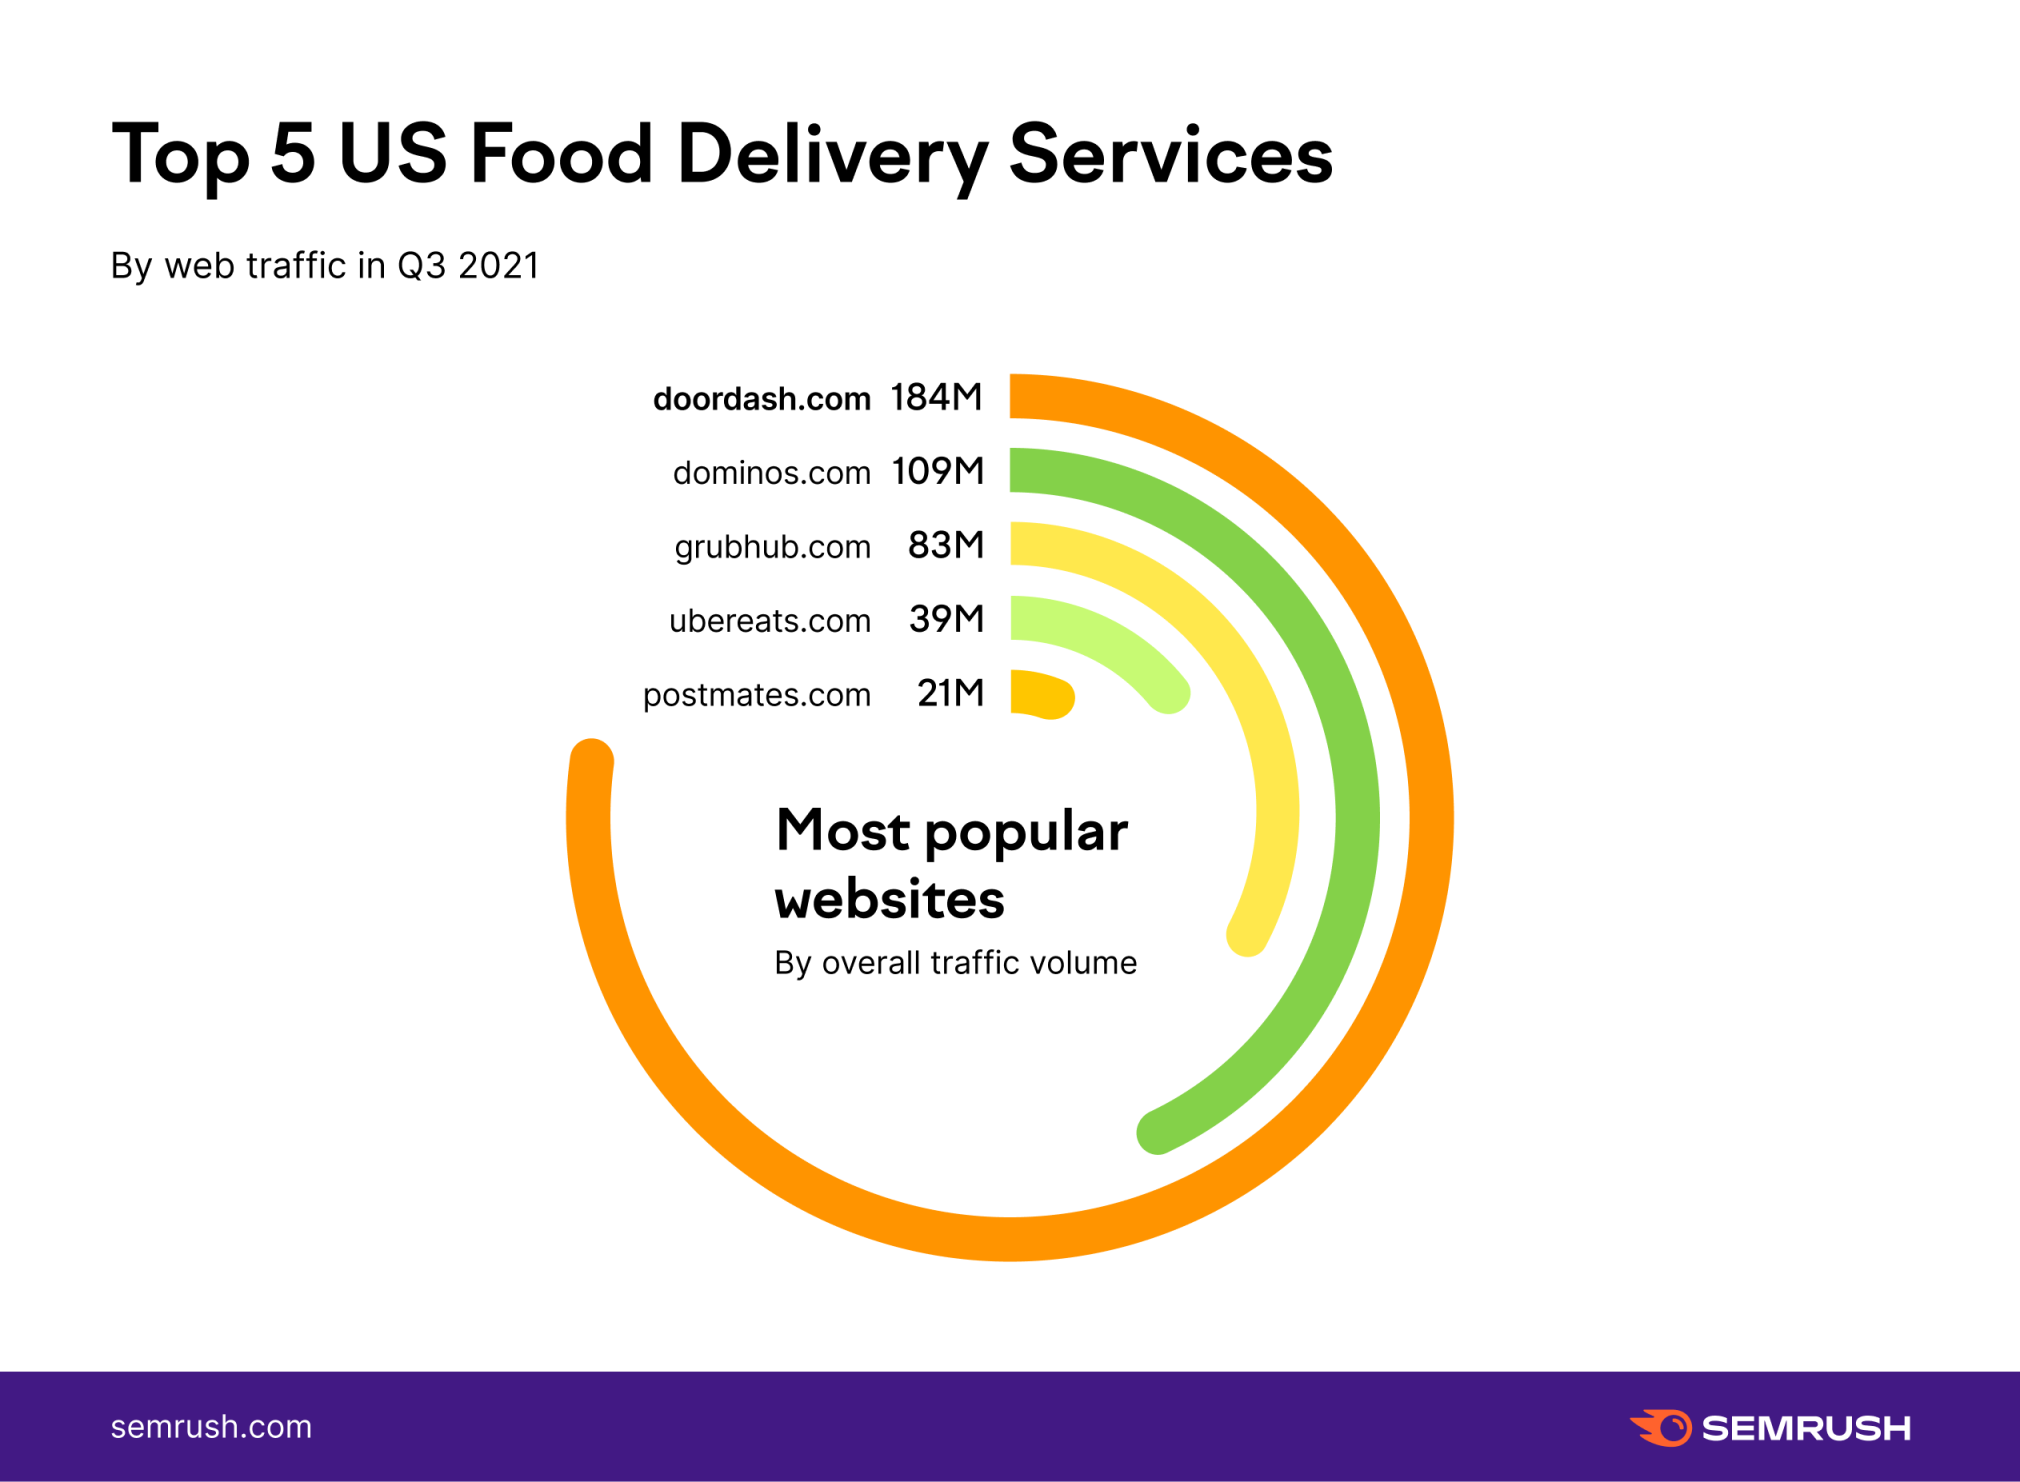
In a quest for competitive market analysis, we simply took the biggest-on-the-market food delivery brand, Domino’s, and entered their domain into the Market Explorer tool.
The tool automatically gathers the top market players within your industry, showing their traffic share, aka online market share, while also reflecting their QoQ, or YoY growth/decline dynamics:
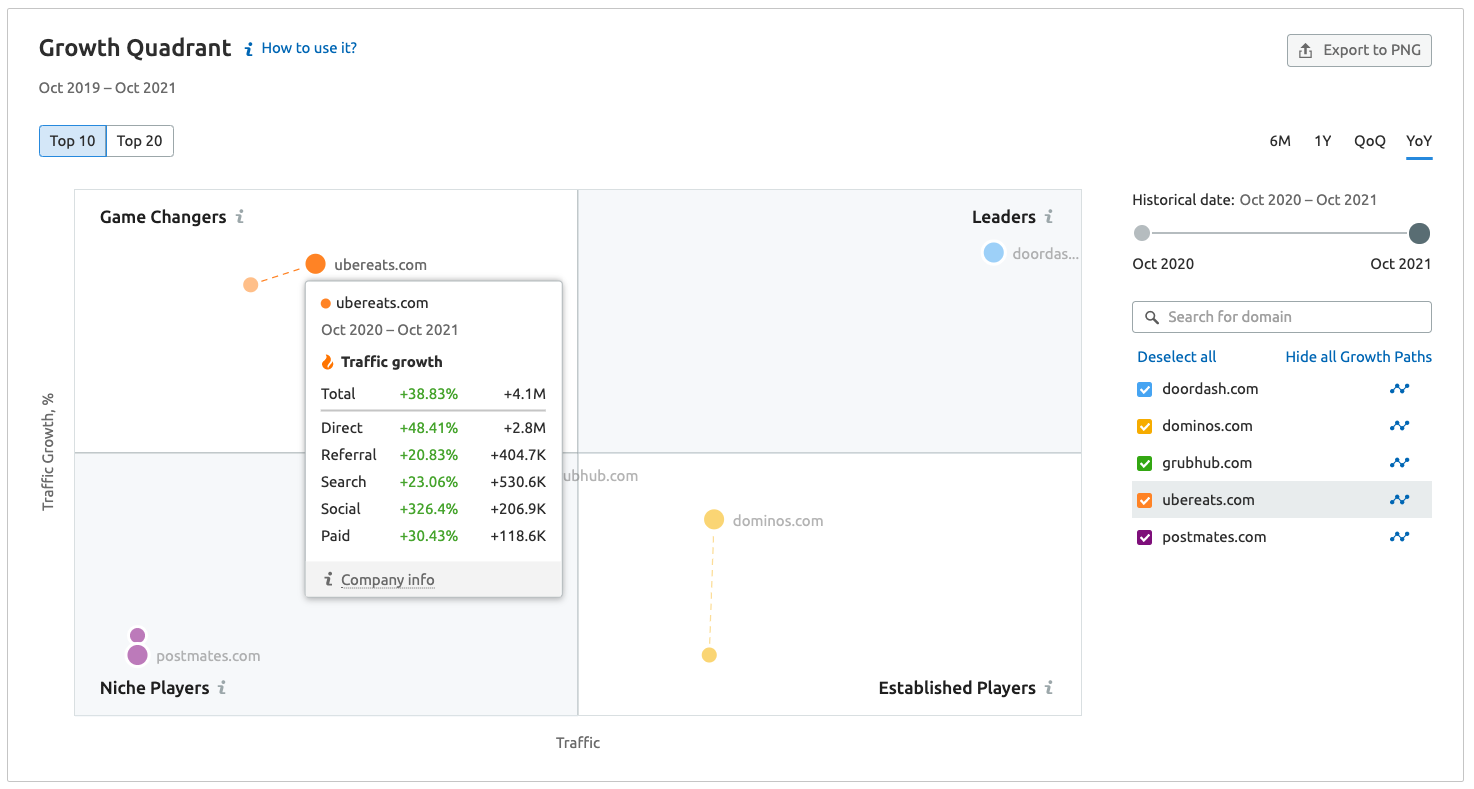
The Growth Quadrant widget places your competitors within four categories:
Game Changers: sites with low traffic volume, but a high rate of traffic growth. Leaders: sites with both high traffic volume and a high rate of traffic growth. Niche Players: sites with both low traffic volume and a low rate of traffic growth. Established Players: sites with high traffic volume, but a lower rate of traffic growth.Further along, make sure to check the companies’ traffic sources and be aware of the one that drives the most traffic.
You don’t have to go anywhere else in search of this data. The Market Explorer Benchmarking report dissects your rivals’ key traffic sources and gives a breakdown of each channel’s impact.

It’s clear that within top food delivery brands, direct is the biggest traffic driver. In other words, people know what they’re looking for when it comes to food delivery.
With this information, you can choose a strategy that will give you the best edge. For example, if your brand awareness isn’t as strong as the competition, you could invest in paid ads or work on your SEO strategy.
Here, Domino’s certainly attracts the most direct traffic. Grubhub, however, has the biggest share of visits coming from search, which implies that it relies less on promo and puts more emphasis on SEO.
Compared to competitors, Postmates receives the largest share of traffic from on social media, suggesting a strong strategy. If you spot greater shares of paid and referral traffic, this may indicate the companies that are more effective in their advertising and PR.
This is how, essentially, in less than 5 minutes, we researched traffic volume amongst food delivery services in the US. This way, using Semrush’s Market Explorer tool, you can determine the leader in any other industry, too.
Competitive Insight #2: What Hidden Seasonal Trends Might You Overlook?
Seasonal spikes in activity are common for most businesses, but it can sometimes be difficult to tell when a spike is actually seasonally related, or if it has to do with other factors.
Sometimes the remaining budget needs to be spent at the end of a quarter, so you see lots of paid traffic going to the website during this time. Or it could be the case that a new head of marketing has arrived after the New Year, bringing fresh ideas, and turning everyone's attention to blogger relations.
Be sure to check traffic metrics over current and previous years. For both, determine your main competitor’s peak month (by the number of website visits). Then compare data. See if it is the same for the overall market and other industry players, and identify the reasons for such an increase. Repeat the same procedure for the period of decline.
Let’s continue with the example of food delivery services in the US.
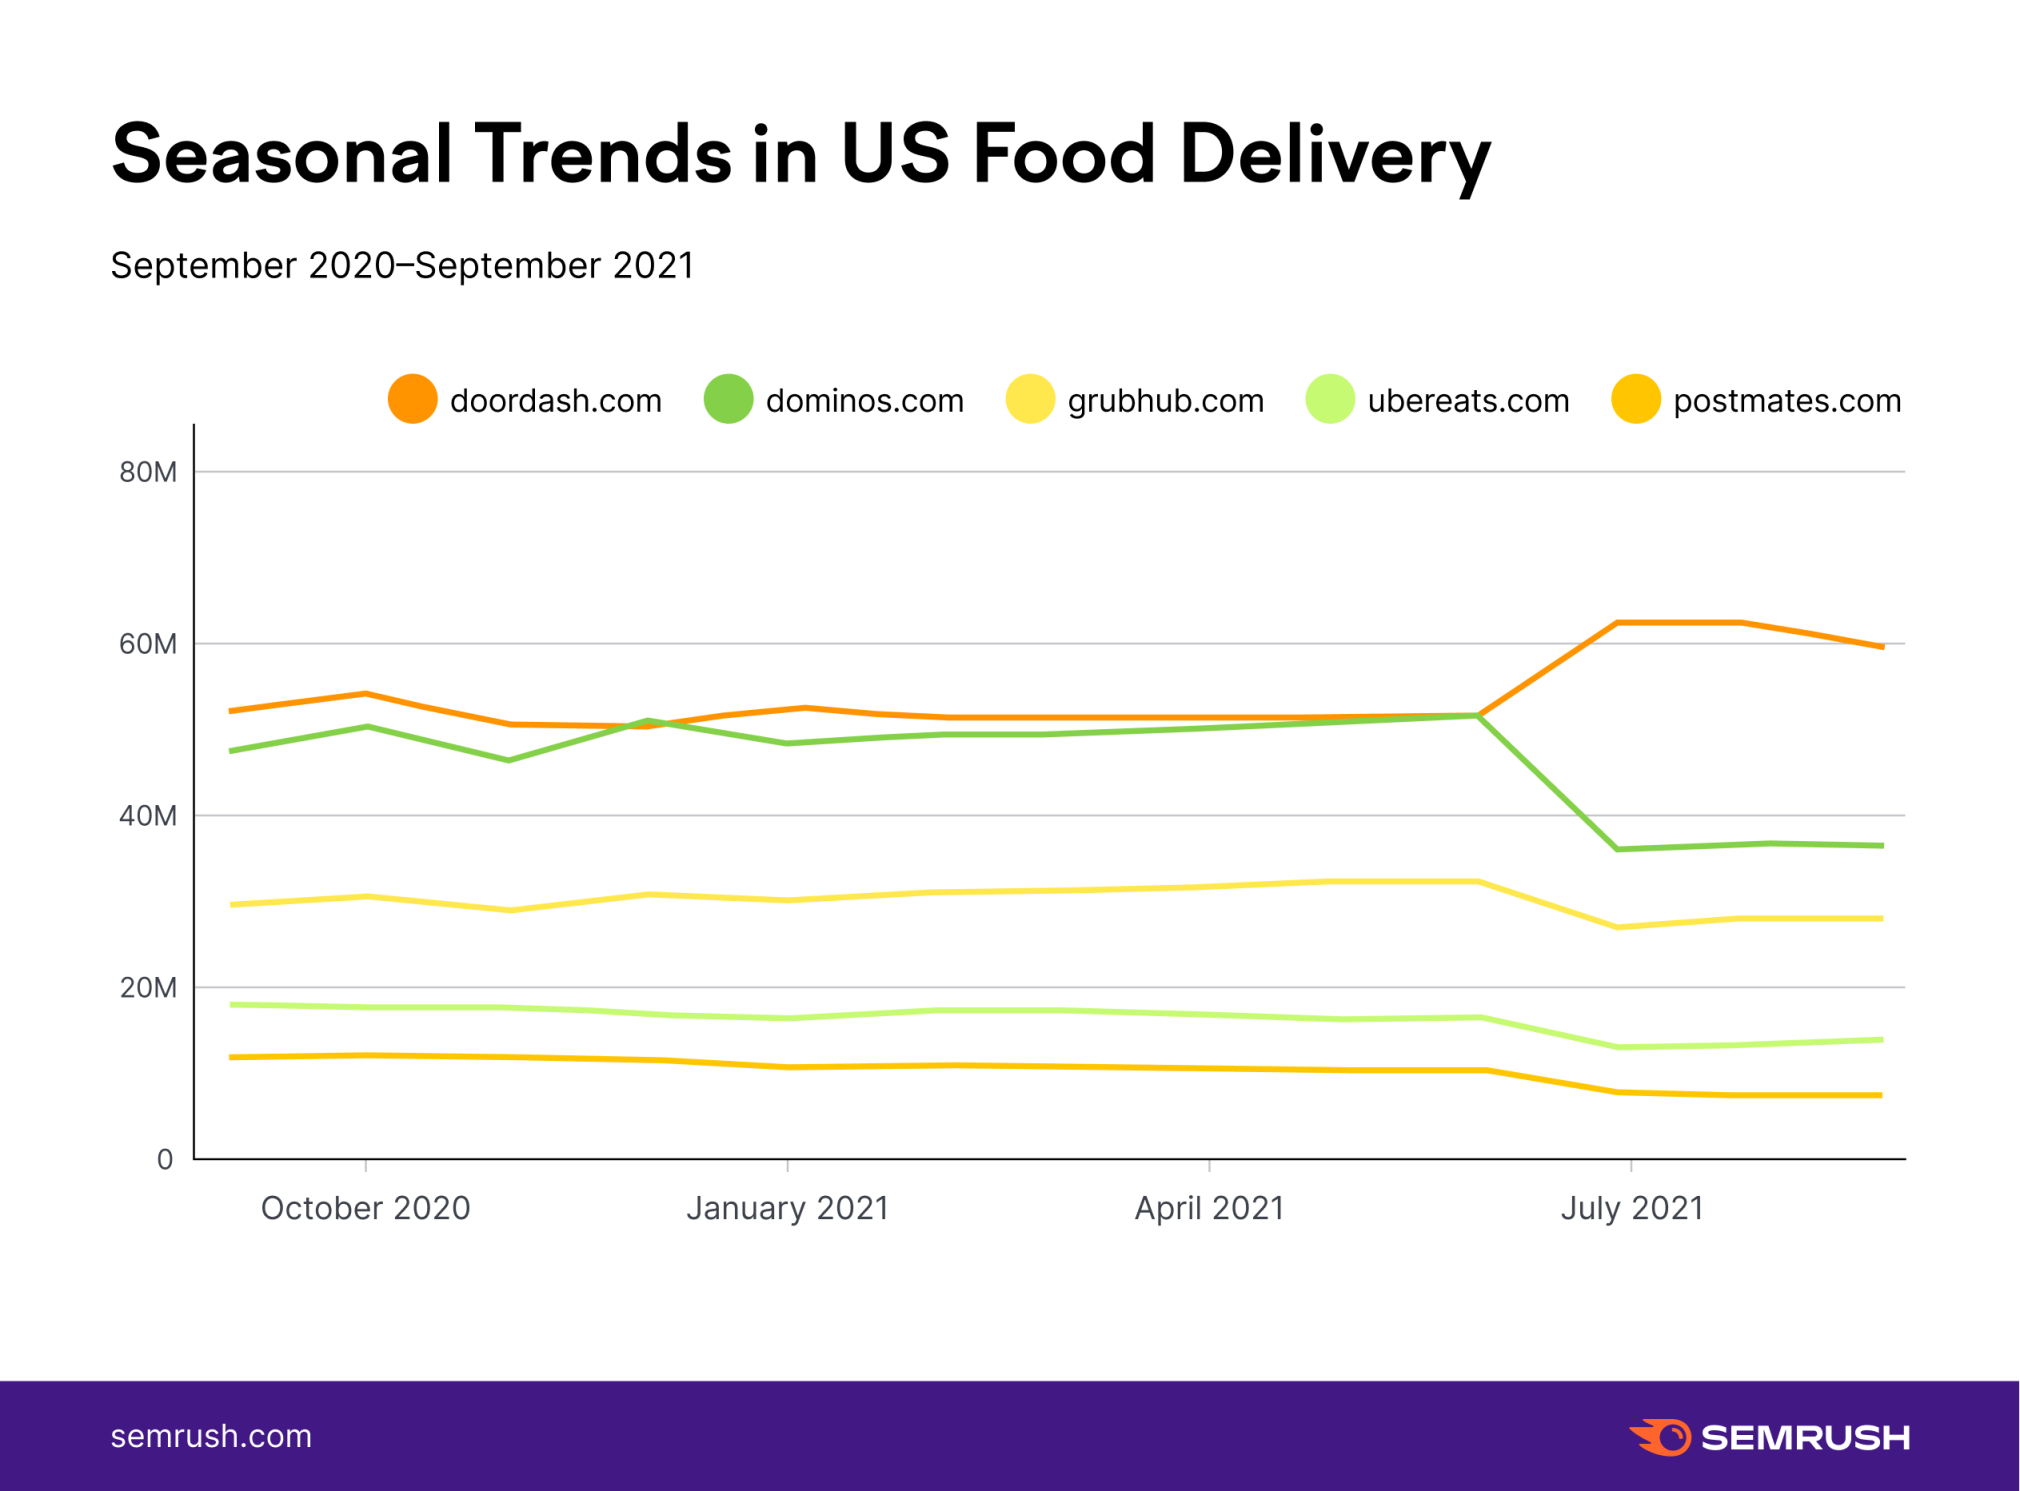
For the five chosen websites, it appears that October through January brought a slight increase in deliveries, while summer showed a slow down. This is true for all of our selected domains except Doordash.com, which saw an increase during the summer. Because this trend is different from all others, it might merit a deeper look to determine the cause.
Looking at the Total Traffic Trends graph in the Market Explorer tool, we can compare the total market traffic to the traffic of individual domains to determine whether certain increases or decreases in traffic were due to seasonality.
Looking at graphs for Grubhub and Postmates, we can see that their traffic pattern (yellow line) is largely in sync with the market traffic pattern (purple line). There are, however, some variations with these businesses.
Both companies saw a sudden decrease in traffic between April and May 2020, while the market trend continued upward.
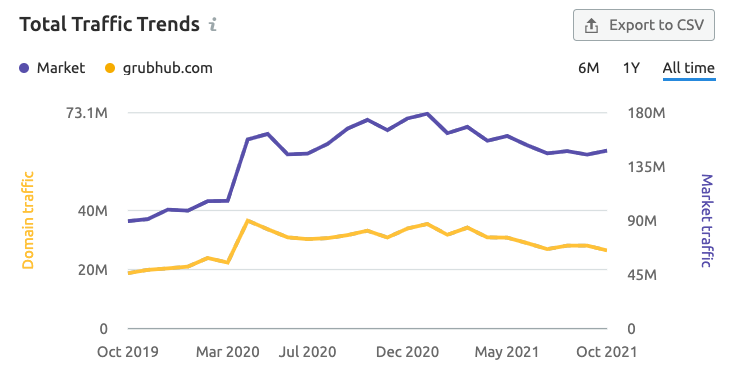
Considering this trend, we might begin to dig deeper by looking at what other players in the market created the spike, and begin asking whether these fluctuations are seasonally related or have another cause.
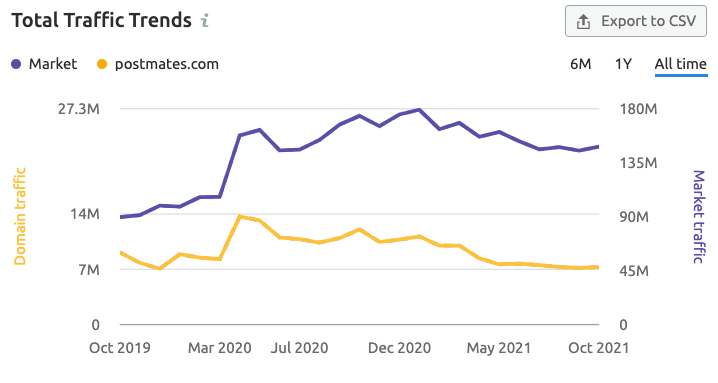
Examining trends like these can help you understand how seasonality impacts your market. With this information you can benchmark seasonal trends against the trends of your competitors, and make strategic decisions about weathering slow seasons or seizing opportunities during peak seasons.
Competitive Insight #3: Do Your Rivals Really Reach the Same Target Audience?
The most important question is not who your rivals target, but who they actually reach. To reveal this, study the audience overlap between your competitors with the help of Traffic Analytics.
The percentage of shared vs. unique audience you find can help you discover the current or even the next leader of the competition, compare brands’ positioning and marketing strategies, reveal media preferences, and align your campaigns accordingly.
Let’s look at 5 popular streaming sites as an example.
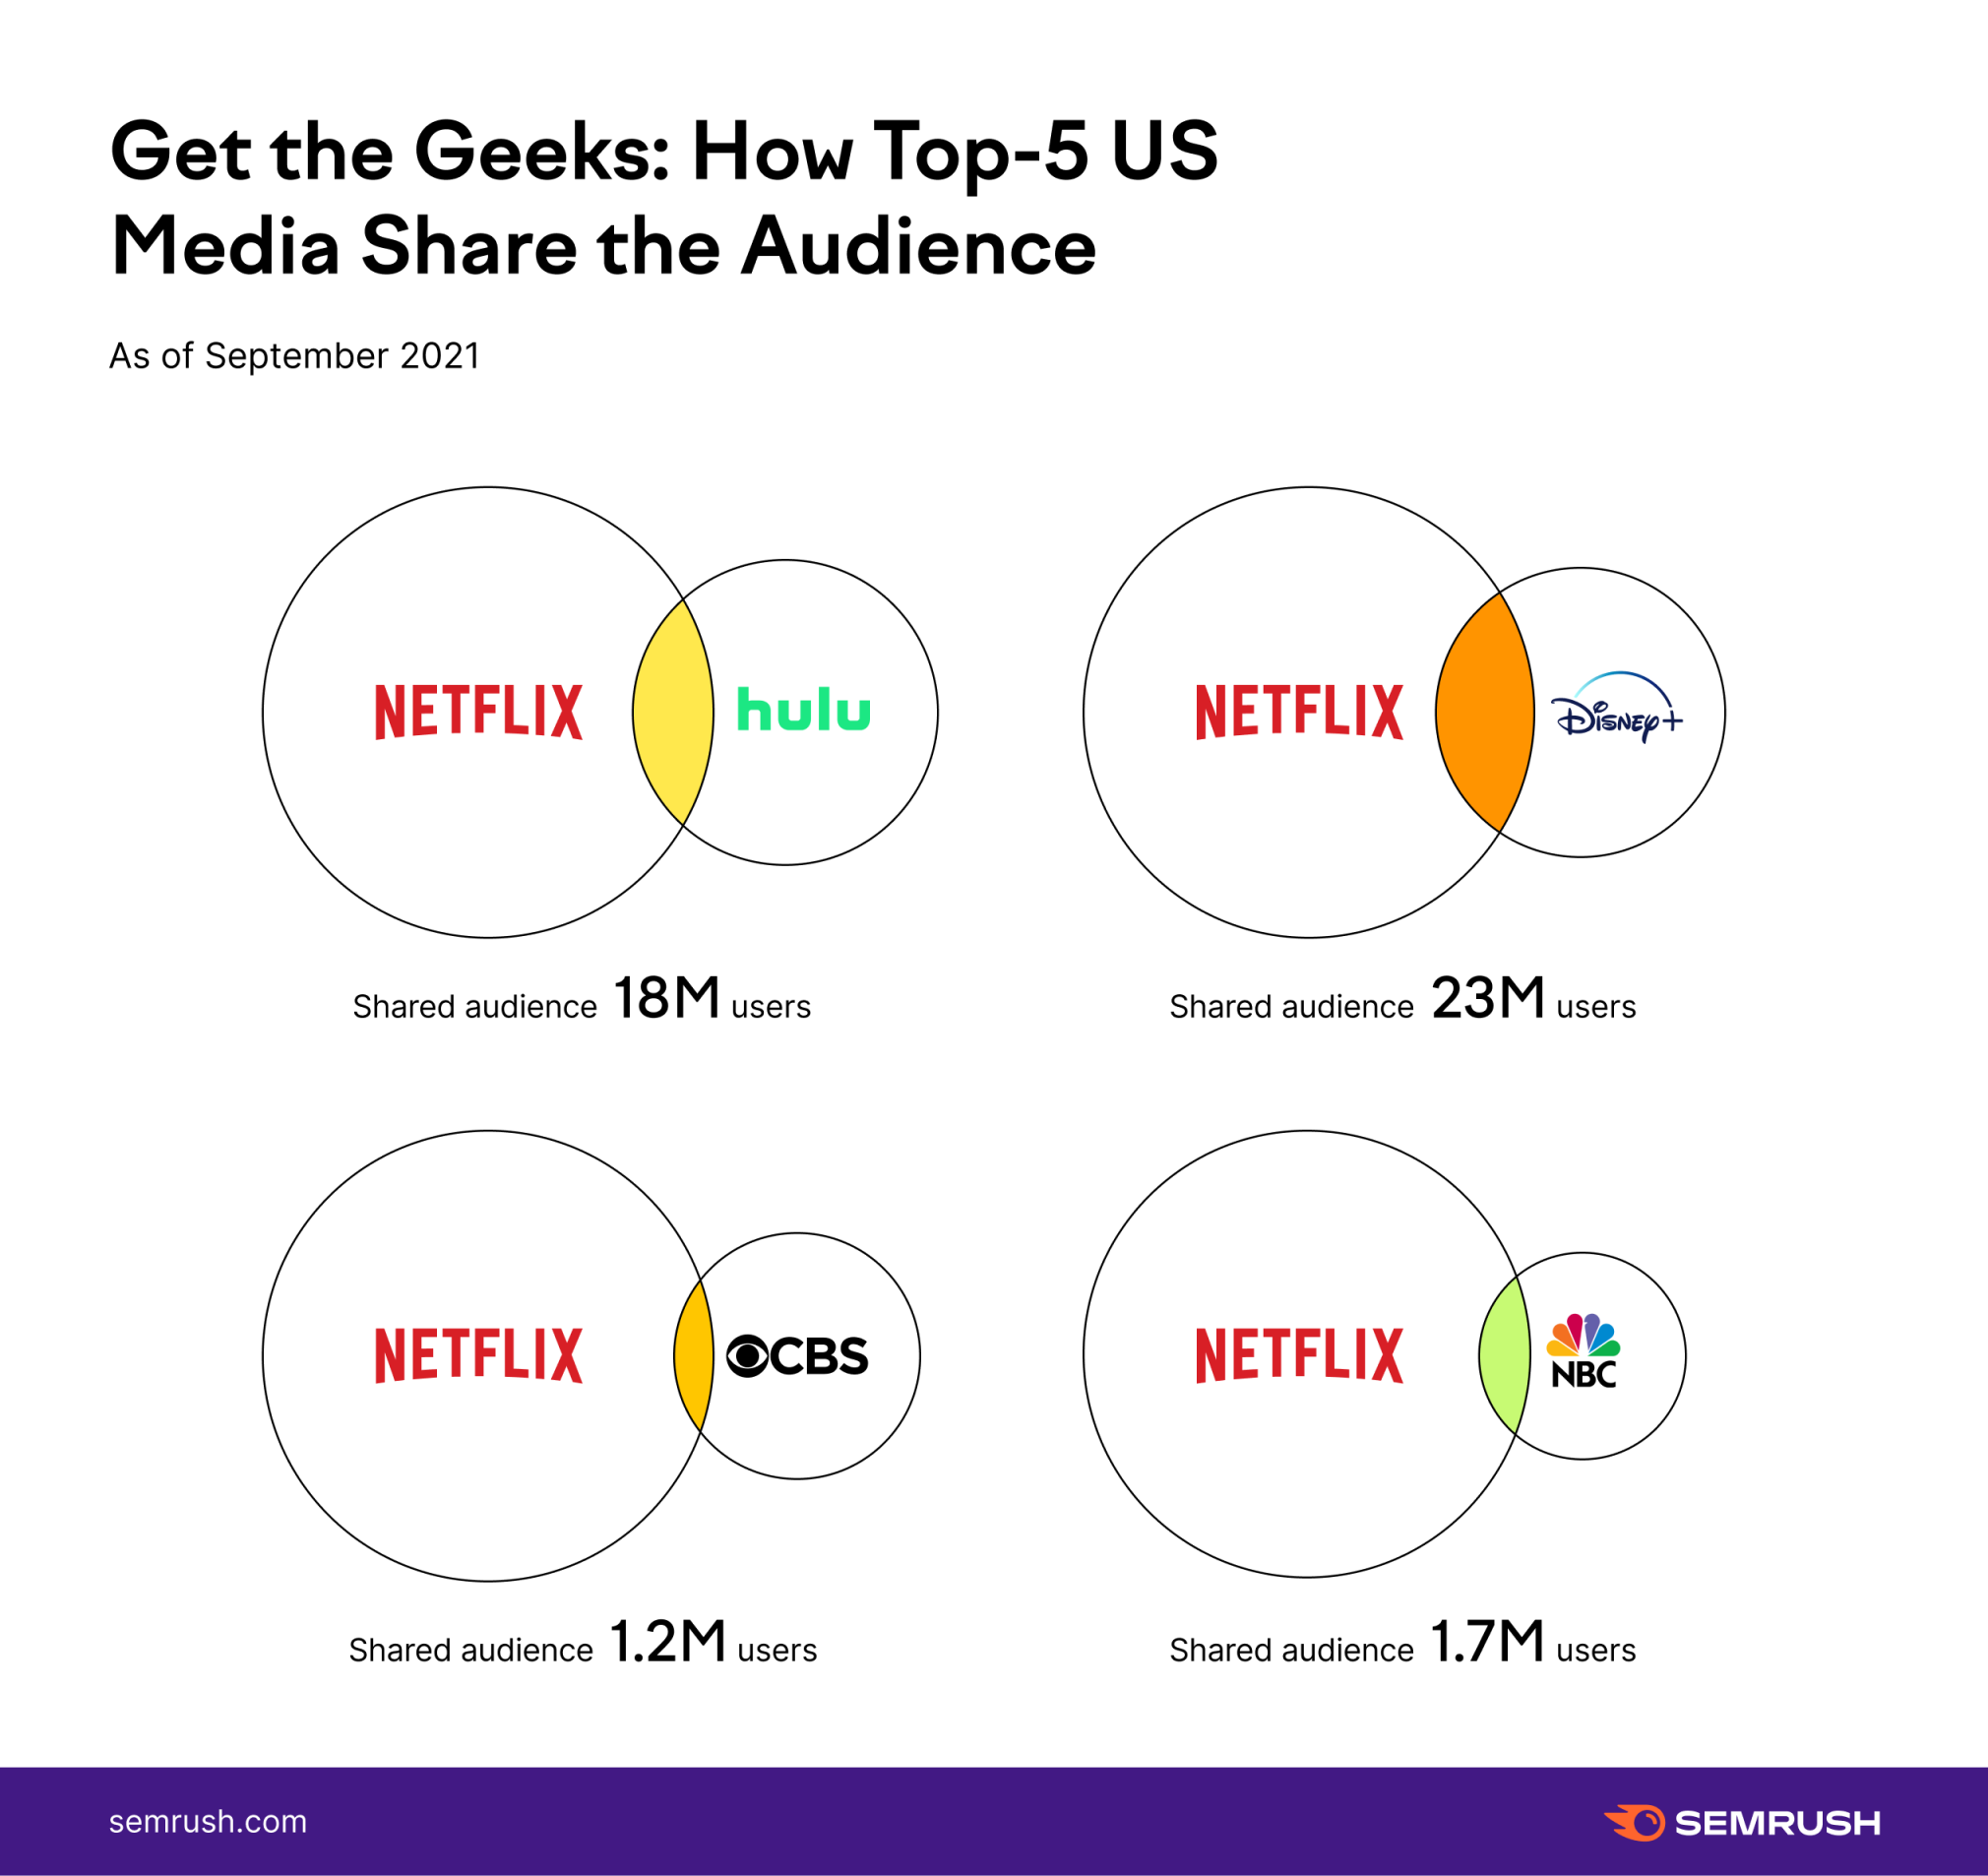
If you look at their home pages, you may notice the similarities in these companies. They all keep releasing fresh films, shows, and other content types on a regular basis. If you look at their actual audience overlap, though, you will see the difference in these platforms’ viewership.
Looking on this graph, we can see that CBS.com and NBC.com are clear outliers with a smaller number of online visitors compared to their video streaming counterparts. If these companies wanted to begin capturing some of the traffic from Netflix or Hulu, they could look at the size of their audience overlap to make informed decisions about media placements, potential partnerships, or audience differentiation.
Competitive Insight #4: Does Your Competitor Serve Your Target Audience Better than You Do?
Pure traffic numbers can only reveal so much about a brand’s success online. If a company doesn’t provide what users want on its website, users leave; it’s that simple. So, turn to Traffic Analytics once again to uncover your competitor’s key user engagement — the average visit duration and bounce rate.
We studied the top US home and garden decor ecommerce brands as an example and discovered that Home Depot, while being the leader in traffic volume, also managed to keep a comparatively high visit duration and bounce rate. The same was true for its competitor, Wayfair. Lowes, on the other hand, had a lower average visit duration and a lower bounce rate.
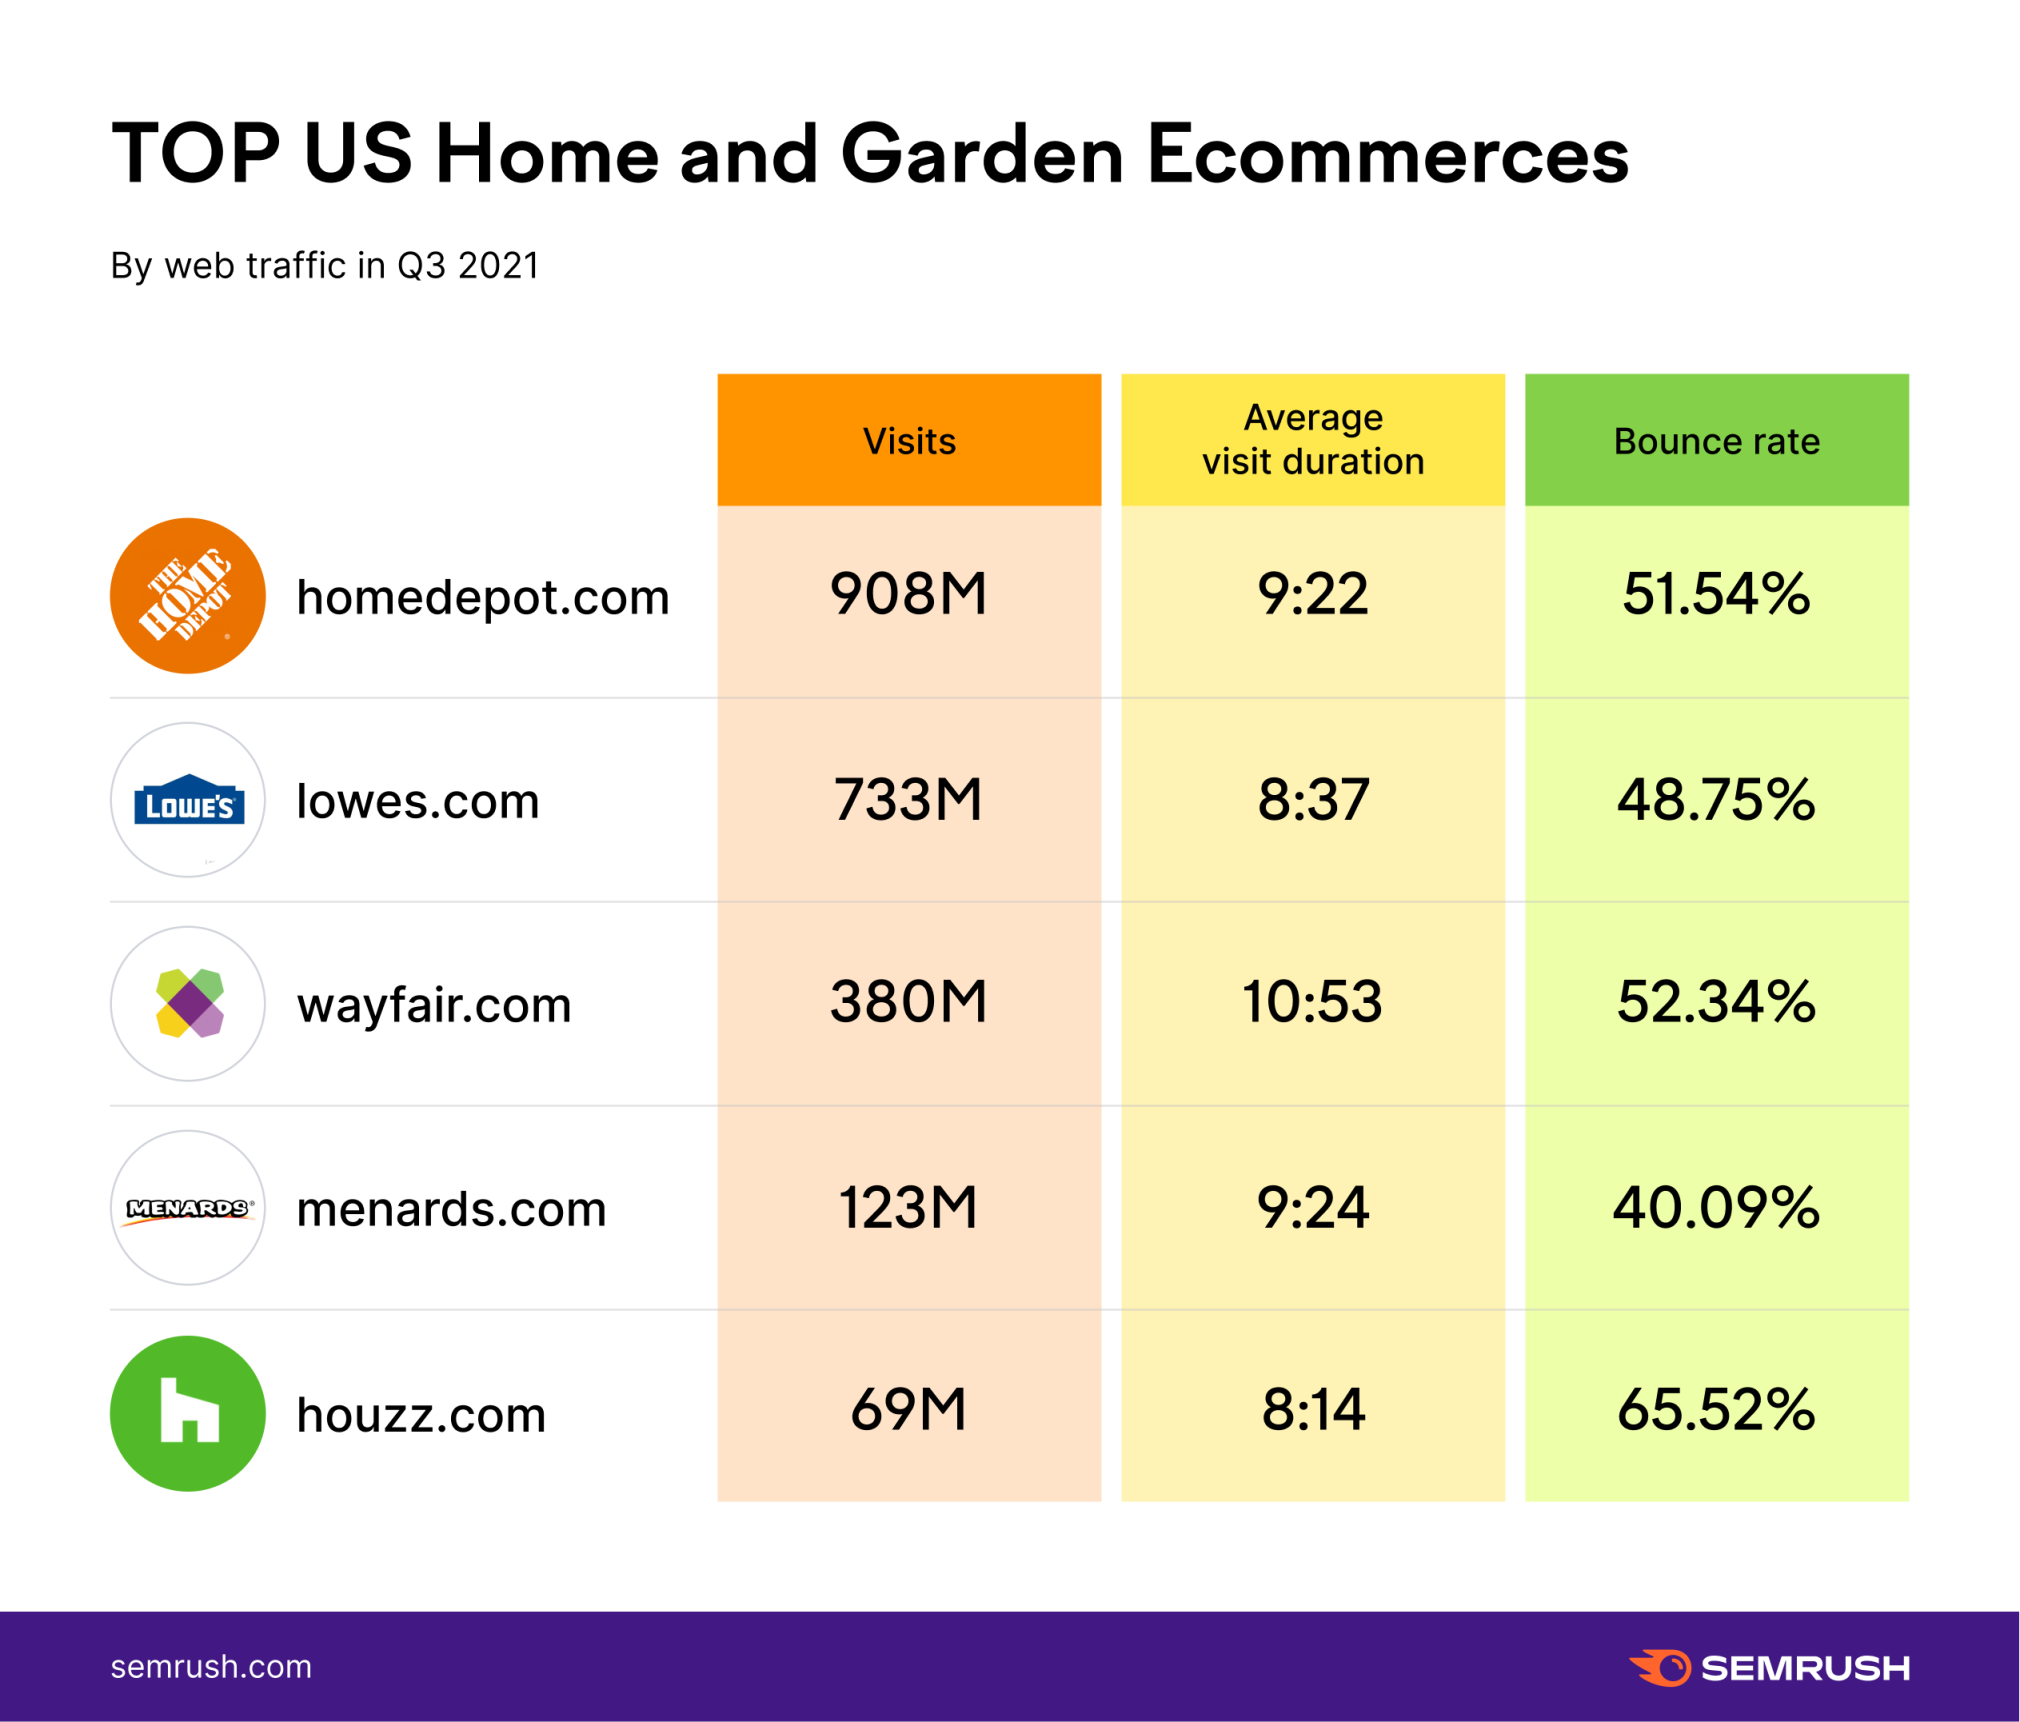
Based on these numbers we can speculate that visitors to the Home Depot and Wayfair websites are looking longer and aren’t finding what they’re looking for. Longer visit durations and higher bounce rates suggest this trend. When it comes to Lowes, however, it appears people are more likely to discover what they need quickly and convert.
What should you do if you research the same metrics for your niche and discover that a competitor has outperformed you?
Check their website traffic journey to reveal the channels and media platforms that attract such a well-targeted audience. Also, have a look at their subdomains and top pages (it may be the structure and content of the website that users find so appealing), and take inspiration from their activities.
Competitive Insight #5: The Top Products and How Your Rivals Manage to Drive Target Users to Them?
Once you have an understanding that you share a certain percentage of similar users, it’s interesting to look at your competitors’ top products/services and uncover which marketing channels are driving the most traffic.
Using Traffic Analytics, we can cover both areas.
Say, you’re in the luxury bag industry, and Prada is your biggest rival. The top pages report can help you identify the most popular pages on their website. For example, when looking at Prada’s website, we can see that one of the most popular pages is dedicated to shoulder bags.
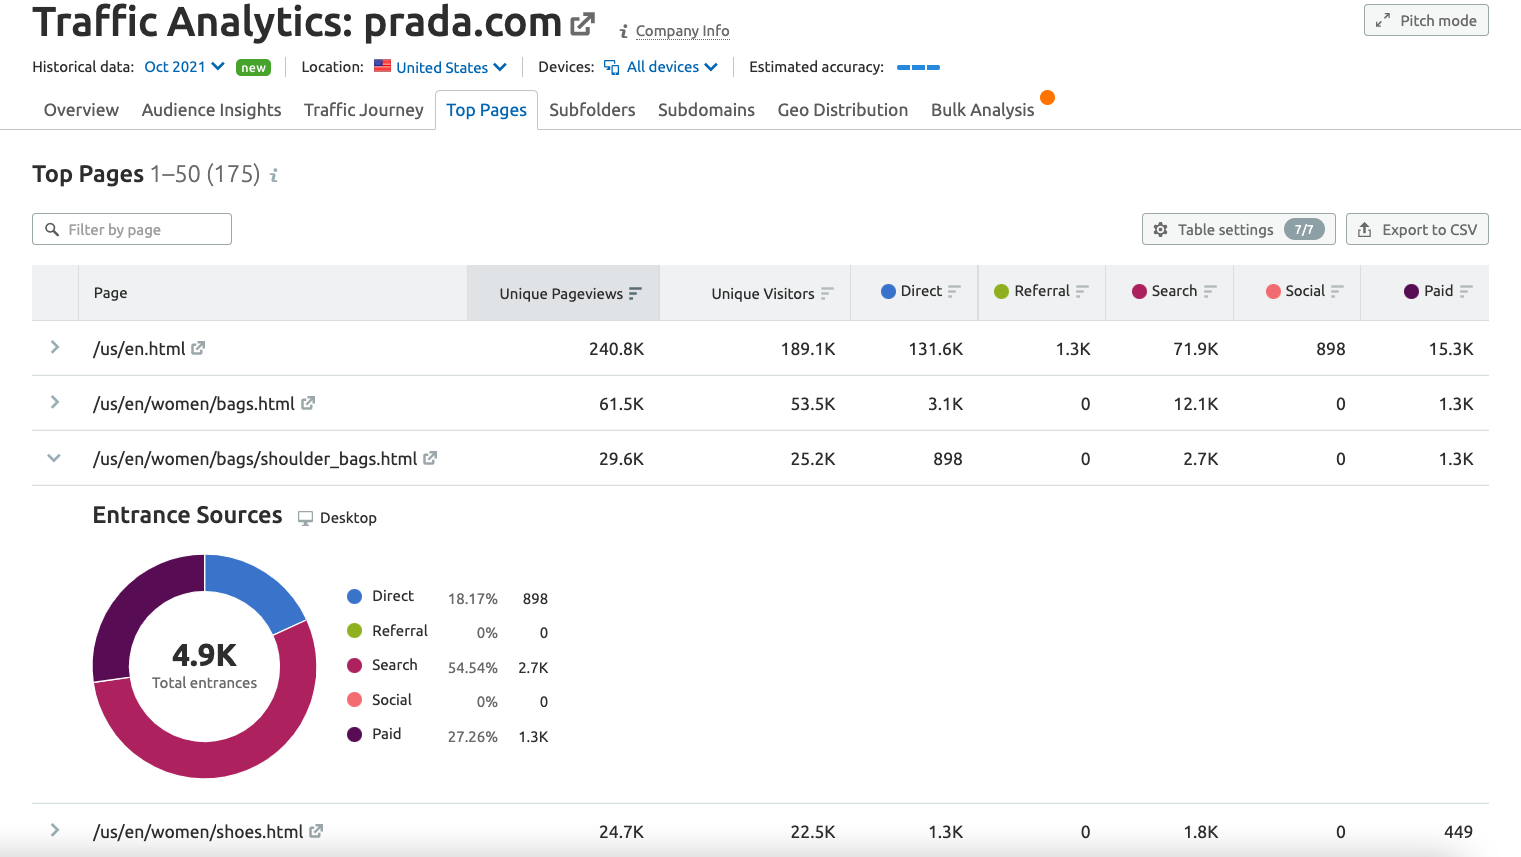
And when you know which product is getting the biggest traction among your target audience, you can simply expand the report and unwrap which external sources are bringing in all the traffic to a given page.
In Prada’s shoulder bag case, we can see that search brings over 50% of traffic to that page. This means that when thinking of an audience generation strategy for this category, the brand is placing its biggest bet on SEO. Paid traffic amounts for over a quarter of the remaining traffic, which suggest a strong paid advertising strategy driving traffic to this page.
So, if you’re willing to get a share of Prada’s shoulder-bag-interested audience, you might want to amplify your SEO strategy and consider ad placements to be able to compete with this fashion giant.
Competitive Insight #6: What Is Their Estimated Conversion?*
*For ecommerce websites and online-based companies only
If users got to a webpage that was made for confirming a purchase or even entering their bank details, there is a good chance they actually bought something.
So, armed with insights from the Traffic Analytics tool, check the traffic to the Top Pages related to payment — filter the complete list by, “pay”, “checkout”, “secure”, or even “thank-you.” These won’t be exact numbers, but you should get some general understanding.
Similarly, you can also find out the total number of users that signed up, logged in, or took specific actions on an online platform.
Here is what we discovered about paypal.com:
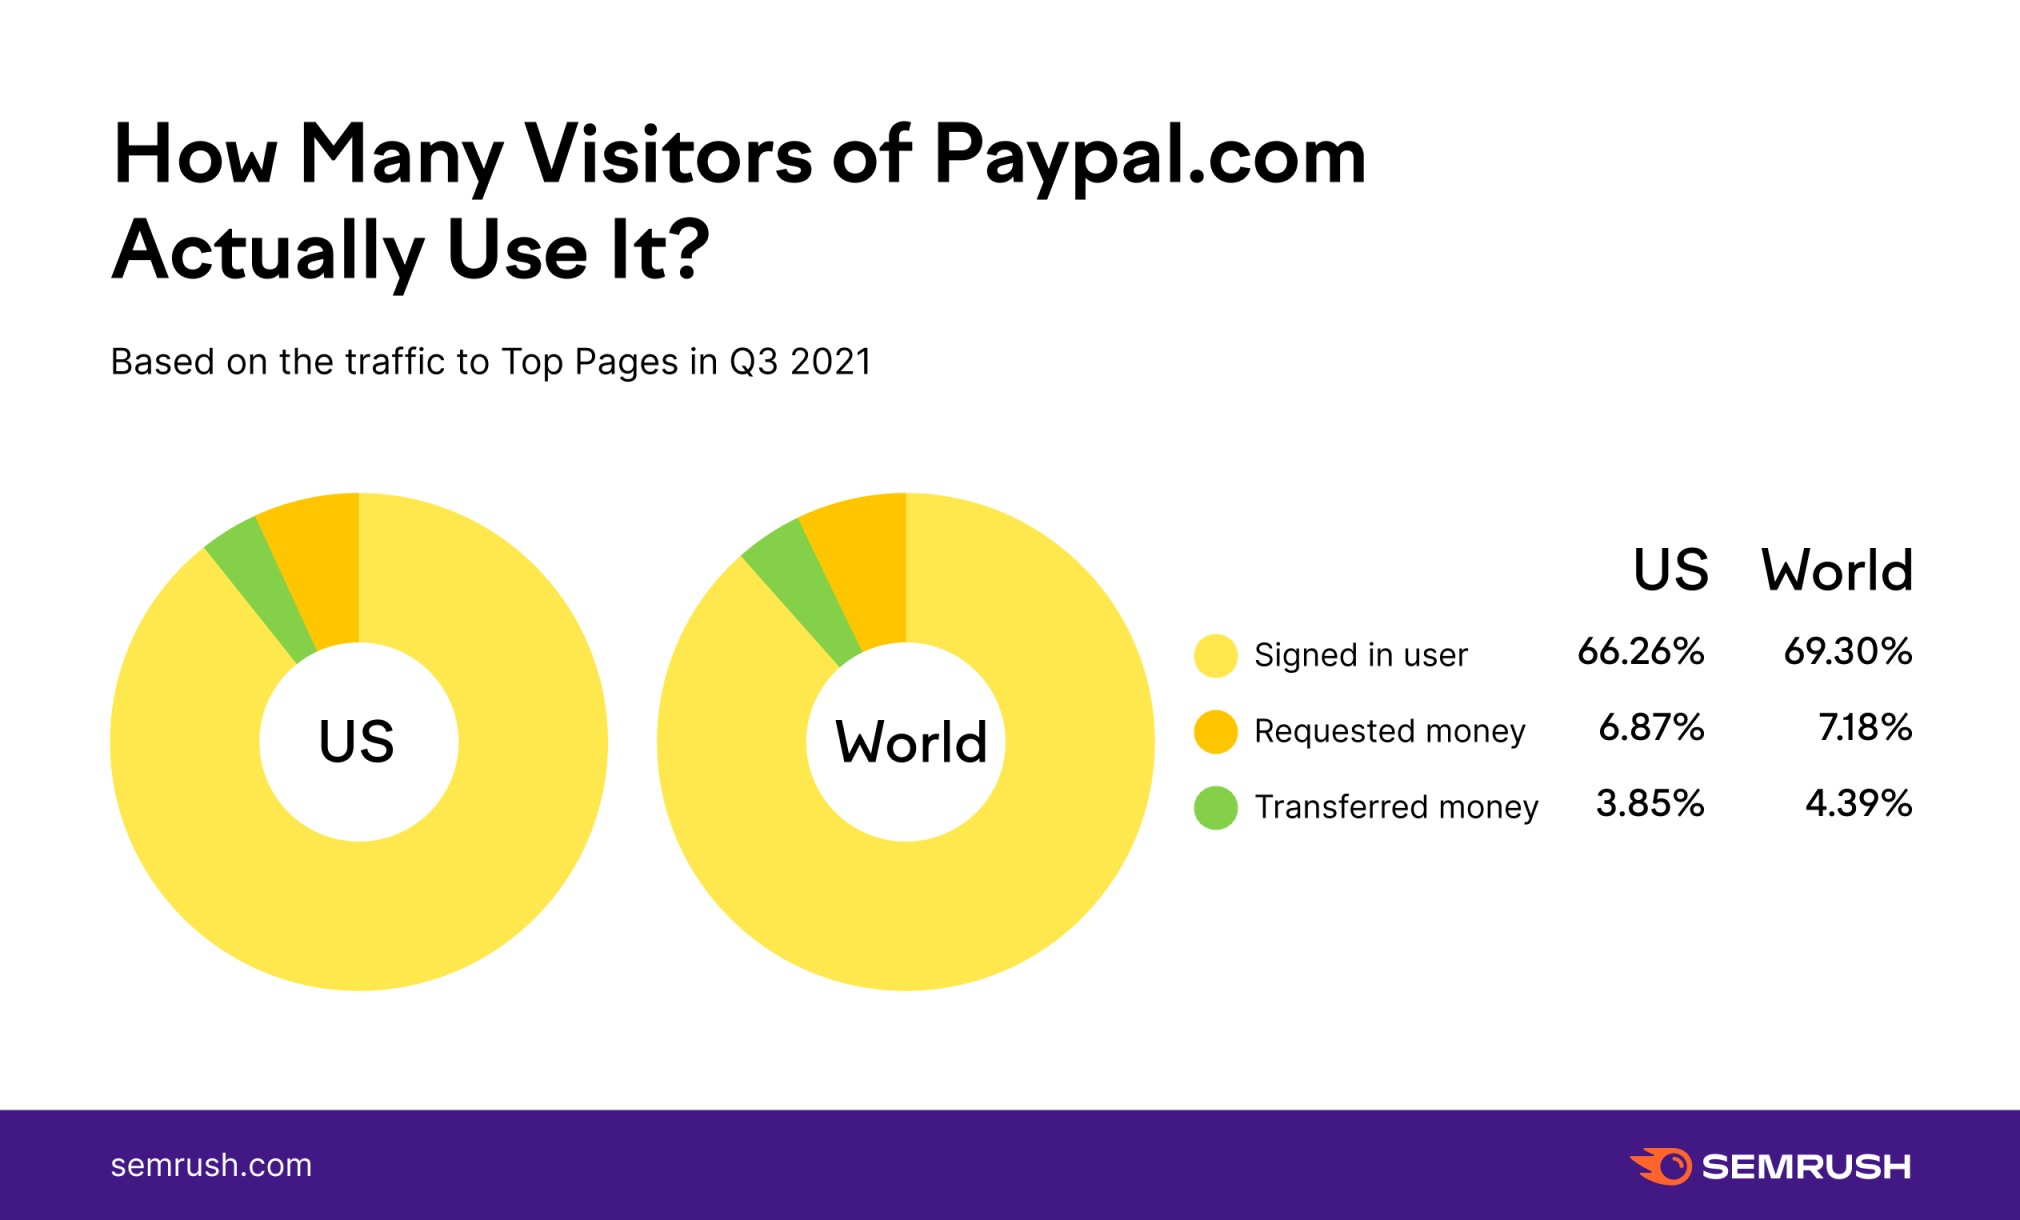
As we can see, of their total number of total sign-ins, it appears only a small percentage of users requested or transferred money. With this information, we might begin asking why this is the case. Is it something with the site's design? Or is it just a natural result of user behavior? Questions like these, revealed with Semrush Traffic Analytics and Market Explorer, can lead to even more insights down the road.
Innovative SEO services
SEO is a patience game; no secret there. We`ll work with you to develop a Search strategy focused on producing increased traffic rankings in as early as 3-months.
A proven Allinclusive. SEO services for measuring, executing, and optimizing for Search Engine success. We say what we do and do what we say.
Our company as Semrush Agency Partner has designed a search engine optimization service that is both ethical and result-driven. We use the latest tools, strategies, and trends to help you move up in the search engines for the right keywords to get noticed by the right audience.
Today, you can schedule a Discovery call with us about your company needs.
Source:


