If your business invests in a social media strategy, you expect to see results. Yet, as any social media marketer knows, reporting effectively on those results isn’t always as easy as it looks.
Below, we’ll explore the top social media metrics you should be tracking on each social channel and where to find them. Use them to target your social media goals more accurately so you can track your progress more effectively.
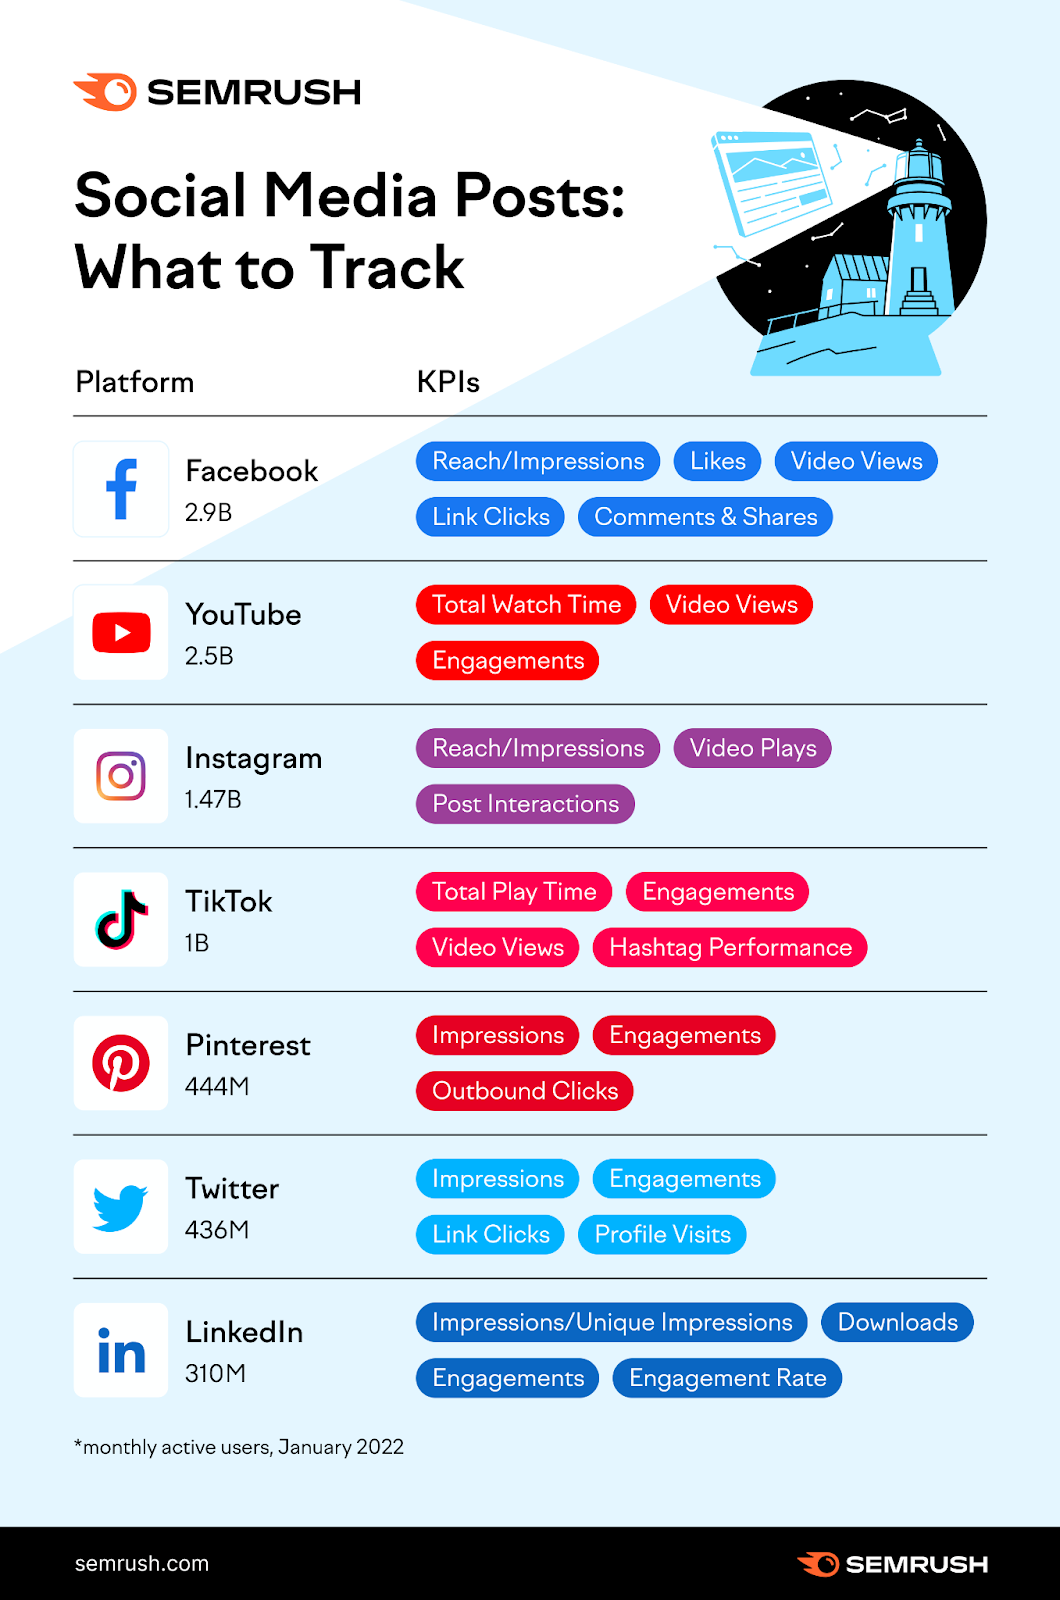
If you ask anyone on the street what the largest social media platform is, odds are strong they’d say Facebook. And they’d be right!
According to Statista, Facebook had 2.93 billion users worldwide, as of Q1 2022. Their user base also accounts for approximately 69% of U.S. adults.
So it’s no wonder marketers around the world love them.
To help you track your progress and make the most of this massive platform, here are our top Facebook KPIs.
Reach & Impressions
What it is: According to Facebook, “reach” is the number of unique users who saw your content on their screens. This is the closest metric to “impressions” Facebook offers natively.
So what’s the difference? Technically, “impressions” refer to the number of times your content appears on any screen, even if one user saw the content many times.
Why it’s important: The reach metric shows you how effectively you’re posting content that gets seen by an audience. It can tell you how big that audience is and help to contextualize other metrics.
For example, if you have an unusually low number of interactions on a post with very high reach, you might need to revisit it.
Where you can find it: You can report on your Facebook reach and impressions using Semrush’s free Social Media Analytics tool.
First, connect your Facebook profile and follow the prompts as the tool guides you through setup. Then, navigate to the Social Media Analytics Engagement tab.
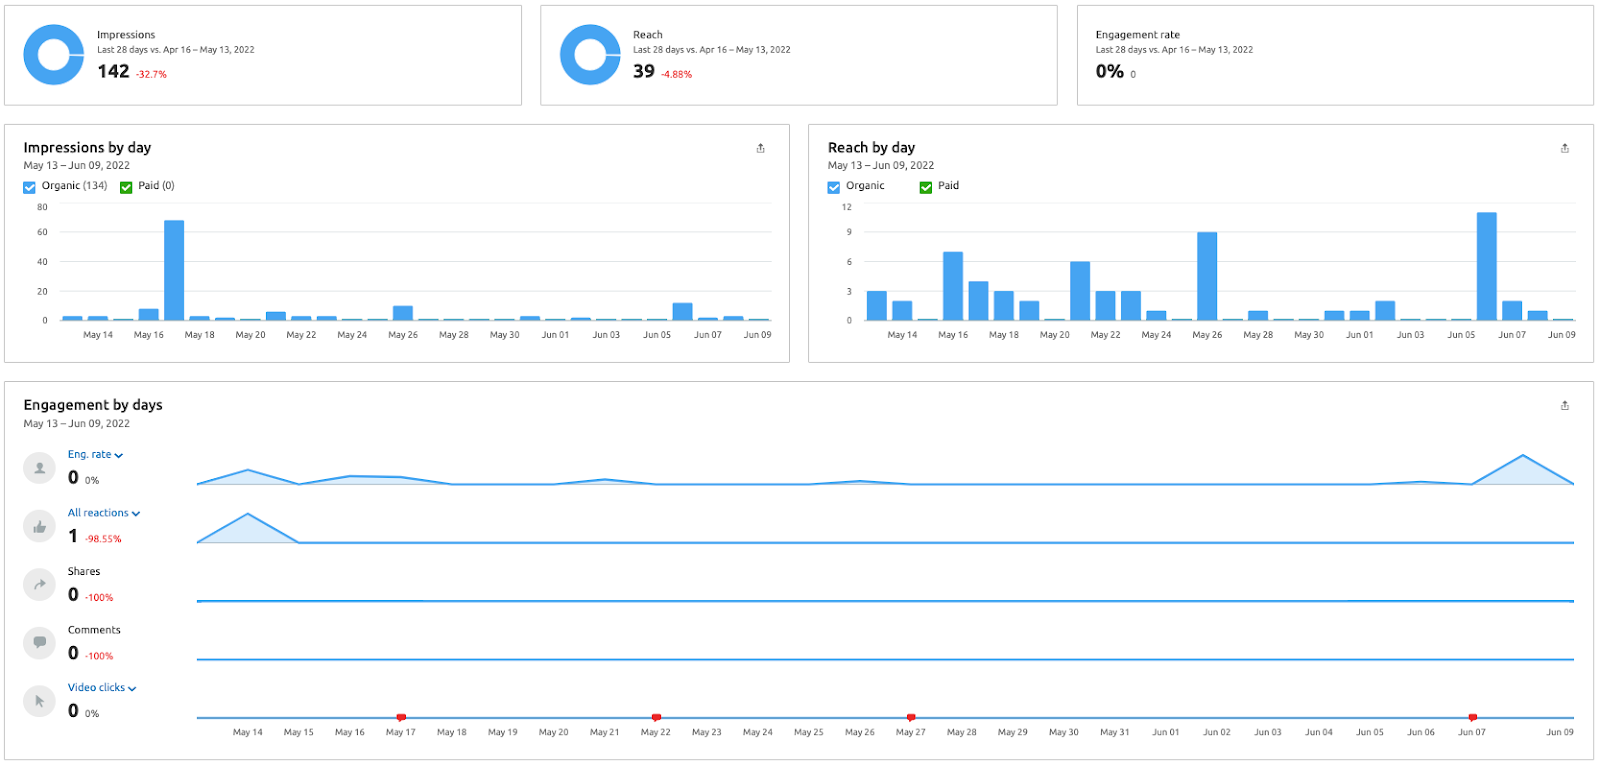
Here, you can find (for a 28-day period):
Impressions Reach Engagement rate Impressions by day Reach by day Engagement by days (detailed breakdown)And more! Best of all, you can access all of this without leaving the Semrush interface.
Likes & Reactions
What it is: “Likes” are a form of engagement that allow users to express their support for a page or a piece of content. “Reactions” are an expanded form of likes that allow users to express their emotional reactions in a more specific way.
Why it’s important: Reactions and likes are social proof that your audience connects with your content. Facebook also uses them as a ranking signal, meaning more reactions could result in higher reach. Additionally, analyzing reactions in detail could help you understand user sentiment around your content.
Where to find it: Analyze your Facebook content’s likes and reactions in Social Media Analytics.
First, navigate to the Engagement tab for an overall reaction count and to break down those reactions in detail.

Here, you can find out exactly how your audience reacted to your content, including how many people took negative actions such as unliking, reporting spam, or hiding your content from their feed.
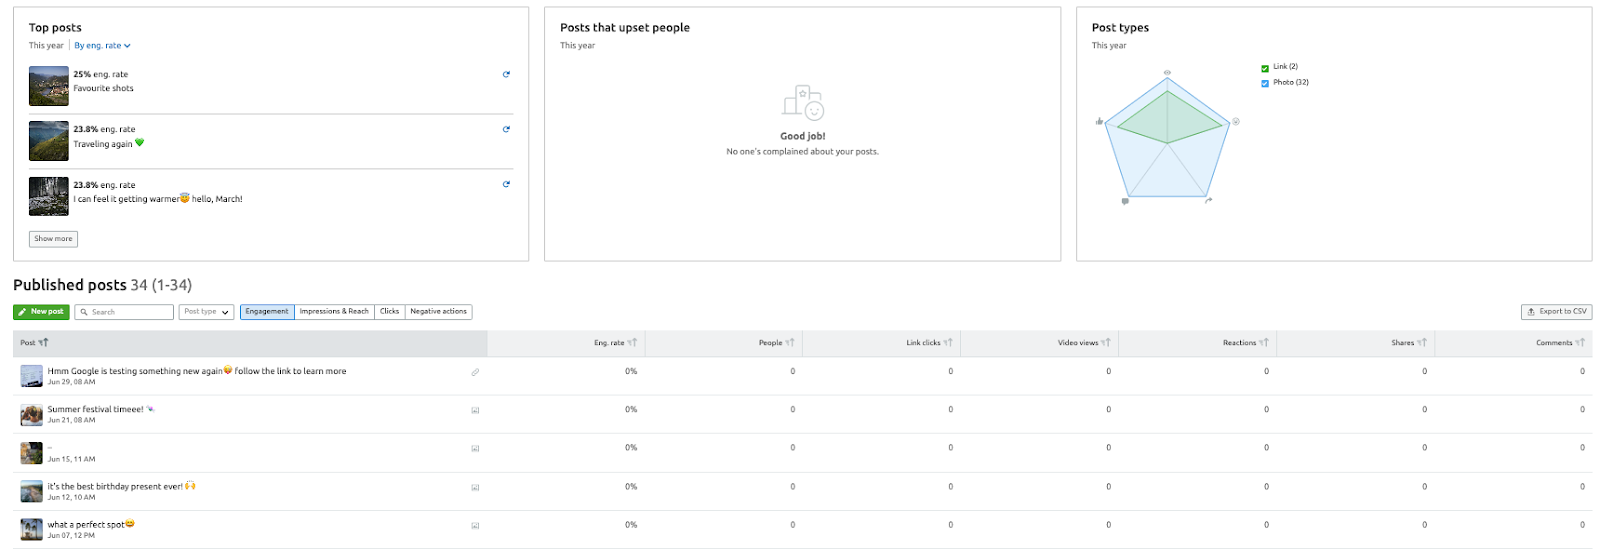
Want to learn more about user sentiment? Check out the Posts tab, where you can find a detailed breakdown of which posts (if any) your audience particularly disliked, so you can modify your strategy and messaging accordingly.
Video Views
What it is: On Facebook, a “view” is when a video is played for at least three seconds. To play, it needs to be 100% on screen in desktop mode and 50% on screen on mobile. Facebook offers three types of video view metrics:
Three-second video views One-minute video views Minutes viewedWhy it’s important: If you’re creating video content, tracking views can show you how well-received it is by the audience. A three-second view, in most cases, would indicate that a user paused for your video, even if they did not complete it. A one-minute view shows that users remained engaged for a more significant period of time.
Where to find it: Using Social Media Analytics, you can find this data on the Engagement tab, on the same page as your Impressions, Reach, and Reactions metrics. On this page, it’s referred to as “Video clicks.”

Want it broken down by post? Check the Posts tab.

Convenient, right?
Link Clicks
What it is: On a typical Facebook post (i.e., not an ad), a link click refers to any time a user clicks an external link in your post to access more content, such as a page on your site.
For comparison, in an ad, this is referred to as an outbound click. For ads, “link clicks” keep the user on Facebook (for example, initiating a form to fill out, or another experience).
Why it’s important: In most cases, the goal of social media is, ultimately, to drive more customers to your site. Measuring link clicks shows you how successful your efforts are. If your posts have few link clicks, first consider whether your posts are enticing enough. Then, consider whether you’re linking to the right types of content for your audience.
Where to find it: Social Media Analytics users can find each post’s link clicks on the Posts tab. Just scroll down to the “Published posts” section and find it in the fourth column.

You can even export it to a CSV for further analysis by clicking the button in the top right corner.
Comments & Shares
What it is: As a metric, “comments” refer to the amount of replies users have left under your content. “Shares” refer to the number of times users have sent it to others via direct messages or have shared to their own feeds.
Why it’s important: Comments and shares are social proof that users connect with your content. Because they require more effort than a like, they could also be considered a more valuable form of engagement. Additionally, analyzing comments can tell you about user sentiment regarding your content and brand.
Where to find it: Semrush Social Media Analytics users will find their comments and shares metric on the Engagement tab, in the “Engagement by days” section.

Want it broken down by post? Visit the Posts tab. Here, you can look at your most recent posts or sort by comments or shares to find your most successful content during that period.

YouTube
If you’re creating video content at all, you’re probably posting it on YouTube. Why? According to Statista, YouTube has a staggering 81% reach among U.S. adults as of February 2021. Additionally:
694,000 hours are streamed on YouTube every minute YouTube is responsible for 11.2% of Google’s total ad revenue, at $28.84 billion 55% of marketers use itHere are our picks for the top metrics to track on YouTube.
Total Watch Time
What it is: Total watch time equals the amount of time all viewers have spent watching your video, added together. For example, if 1,000 viewers each spent 2.5 minutes watching your video, the total watch time would be 41 hours and 40 minutes. At the channel level, this metric shows the total amount of time viewers spent watching all of your content.
Why it’s important: Together with video views, total watch time helps you analyze the success of your videos. You can also compare total watch time for subscribers versus non-subscribers for more insights into your audience.
Where to find it: In YouTube’s Video or Channel Analytics, you can find total watch time in a few places:
On the Overview tab In the Reach tab in the “Impressions that led to watch time” graphic (you may notice a discrepancy in this graphic, because it’s updated less frequently)Video Views
What it is: Google defines views as “the number of legitimate views for your channel or videos.” In other words, views a user intentionally initiates (e.g., by searching or clicking a thumbnail). If the site finds a video’s views to be suspicious, they will freeze the number while they review it. This metric is measured in hours.
Why it’s important: The video views metric tells you how enticing your video is to potential viewers. Factors that could impact it include your video topic, title, and thumbnail design. As with watch time, you can view it at the channel or video level and differentiate between subscribers and non-subscribers. Additionally, together with watch time, views can help you better understand how engaged viewers are with a video.
Where it is: Whether you’re analyzing your own performance or benchmarking against a competitor, you can analyze view count easily in Semrush’s Social Media Tracker.
First, access your YouTube account within the tool. Then select “videos” for a detailed breakdown of each published video’s performance.

Engagement
What it is: As on other platforms, “engagement” means any interaction with content that goes beyond simply accessing it. On YouTube, that means likes, dislikes, views, and comments.
Why it’s important: In addition to being a signifier that your audience connects with your content, engagement is a ranking factor on YouTube. So if you want to end up in somebody’s recommended feed, or even on the front page, increasing your engagement could be helpful.
Where to find it: YouTube’s native analytics platform doesn’t offer a unified engagement metric. But Semrush’s Social Media Tracker does. Simply add your business or a competitor to the tool, and then visit the Engagement tab.

According to Statista, Instagram has 1.28 billion users around the world. With that in mind, there’s a strong chance you (or your brand) are one of them, especially if your brand wants to connect with young people:
31.7% of global internet users between the ages of 25 and 34 use Instagram 22% of teens say it’s their favorite social networkHere are our favorite KPIs to track on Instagram.
Impressions
What it is: Impressions are the number of times your content was seen by logged-in users, even if those users saw it multiple times. In other words, this metric counts how often your content actually appears on a screen.
Why it’s important: Like reach, the impressions metric shows you how effective you are at getting eyes on your content, and it provides important context to understand other KPIs—e.g., low engagement on a post with very high impressions, versus low engagement on a post that nobody saw.
Where to find it: If you’re a Semrush Social Media Analytics user, visit the Stories section to see how many impressions your Instagram Stories earned, and go to your Posts tab to analyze your impressions by post.

Reach
What it is: Reach is the estimated number of unique logged-in users that saw a piece of your content. However, because this metric counts users, not views, this number is likely to be lower than impressions.
Why it’s important: Reach shows you how large your audience actually is, and it tells you how effectively you get your content seen by that audience. Like impressions, it can also be helpful in contextualizing other important metrics, like post engagement or follower count.
Where to find it: You can find your Instagram reach in a few different places within Semrush’s Social Media Analytics. First, visit the “Profile interactions” section to find out how much reach you have for all your content together.
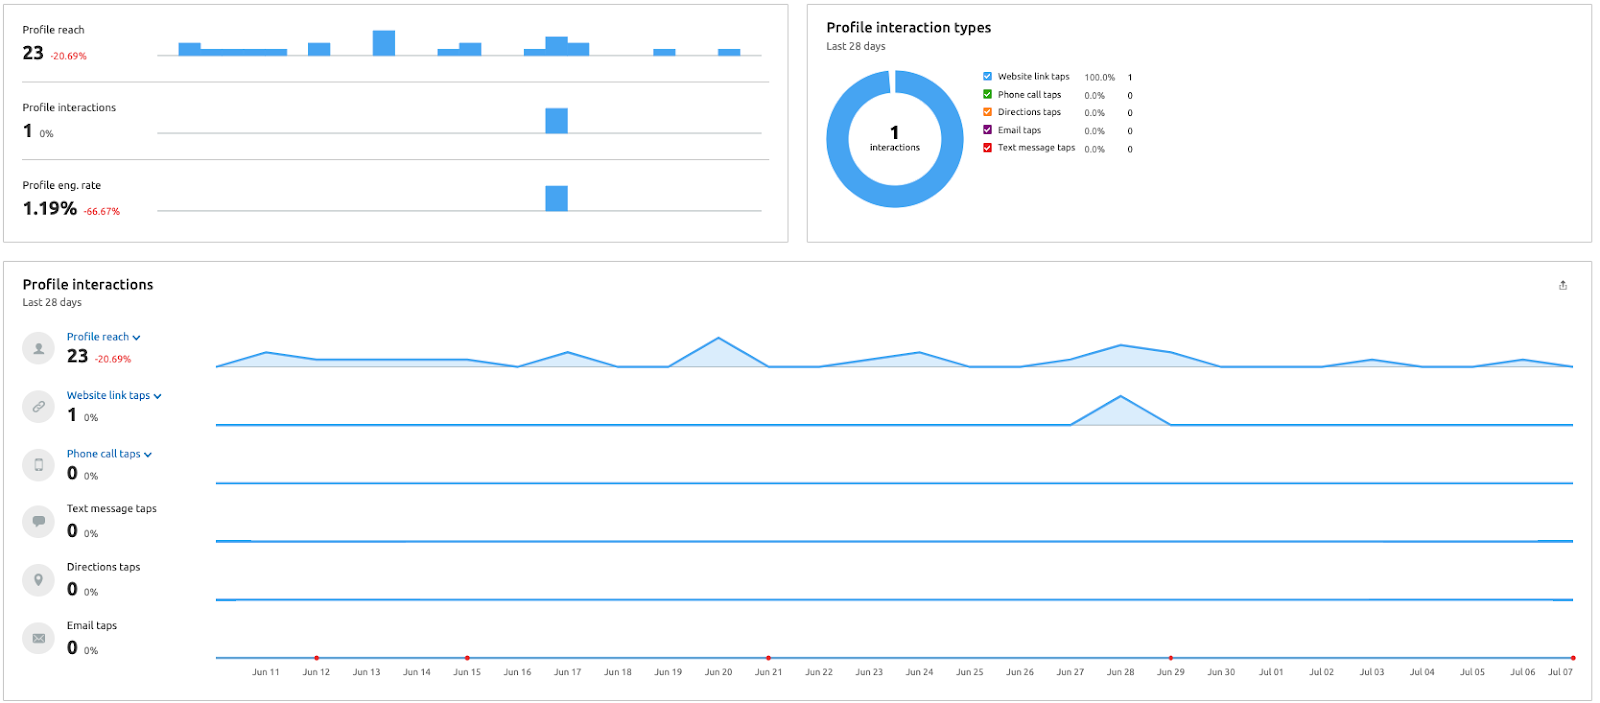
To analyze your reach by individual story or post, visit the “Stories” and “Posts” sections respectively.

Video Plays
What it is: The number of times your video or reel was played by an Instagram user. Because many videos are short and loop automatically, this number may be higher than you expect based on your reach. This metric is available for both in-feed videos and reels.
Why it’s important: Creating video content requires a lot of time and effort. Video plays show you how well that effort is paying off, because it means users not only saw your content on their feed but also opened it to watch.
Where to find it: Navigate to the Posts tab within Social Media Analytics, and you’ll see it in the ninth column. Sort by video views to find your most successful video posts.

Post Interactions
What it is: Post interactions are the number of likes, saves, comments, and shares your posts received, not counting any deleted interactions. This metric does not include story and reel interactions. If you want to include those, use content interactions instead.
Why it’s important: Unlike the previous Instagram metrics, which focus on how often your content was seen, post interactions show you how well your content connected with the audience. Interactions can also help boost your impressions and reach.
Where to find it: To see account-wide post interactions, open Instagram’s native analytics page, Insights, and tap “accounts engaged.” Here, you can find the number of logged-in users who interacted with your content, your total content interactions during the analyzed period, and your total post interactions during that period.
To see post interactions data for a specific piece of content, navigate to that post, select “post insights,” and scroll down to the post interactions section.
TikTok
If you’re a consumer-facing business targeting Gen Z and Millennials—especially young women—and you’re not on TikTok yet, you’re probably thinking about it. On average, users spend over 19 hours on TikTok every month. That’s a lot of time for your audience to connect with your brand.
Even beyond that demographic, TikTok is a fast-growing platform. According to Statista, TikTok:
Is used by 57% of women around the world Has 136.42 million users in the United States alone Increased first-time installs by 400% year over year between 2017 and 2021But how do you measure TikTok success? With these KPIs, of course.
Total Time Watched
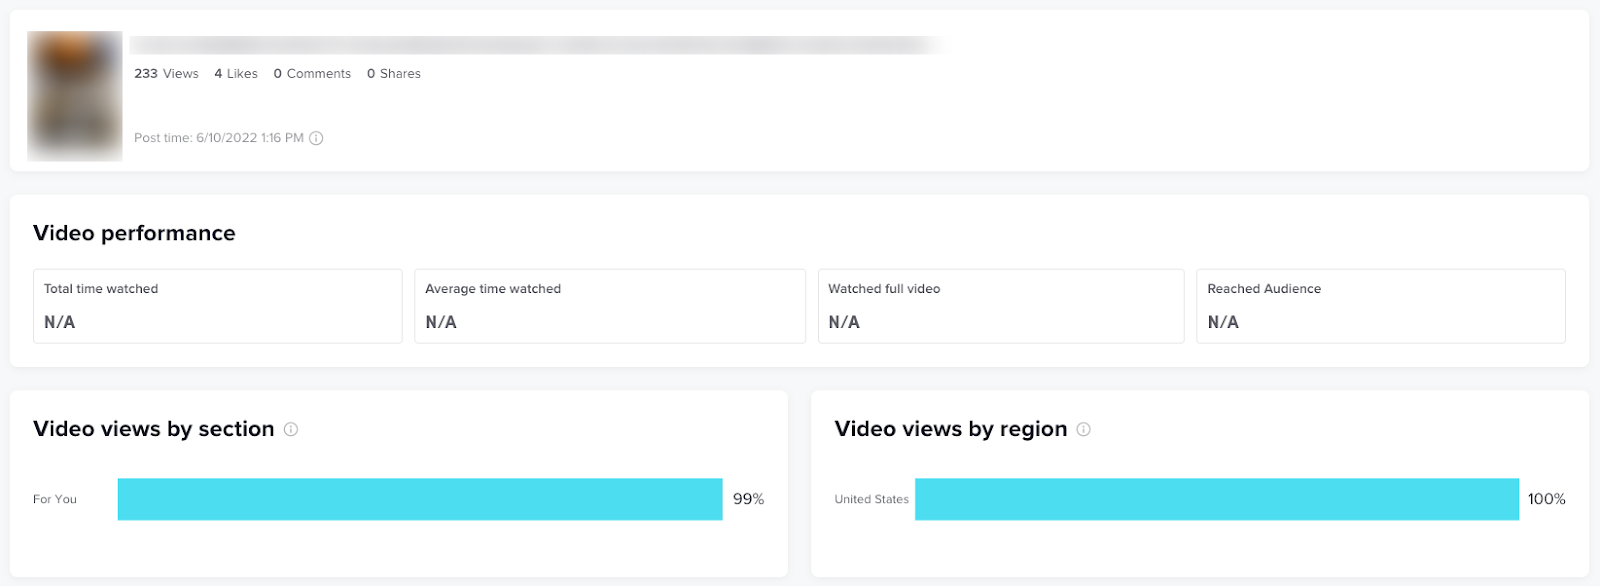
What it is: Total time watched is the cumulative amount of time people have spent watching your video. TikTok currently shows this information only for individual videos. As such, if you want to determine your average total time watched across your account, you’ll need to collect this information on all of your videos.
Why it’s important: This metric is primarily useful for benchmarking purposes. By tracking this metric regularly, you’ll be able to evaluate how successful new content is compared to other videos you’ve posted in the past, or under certain hashtags. You can also use total time watched to provide context for other metrics such as views or engagements.
Where to find it: To find total time watched, you’ll need to access the browser version of TikTok Analytics, ideally on a desktop. In Analytics, select the Content section and tap the video you want to analyze. You’ll find your total and average watch time for that post on the video details screen.
Engagement
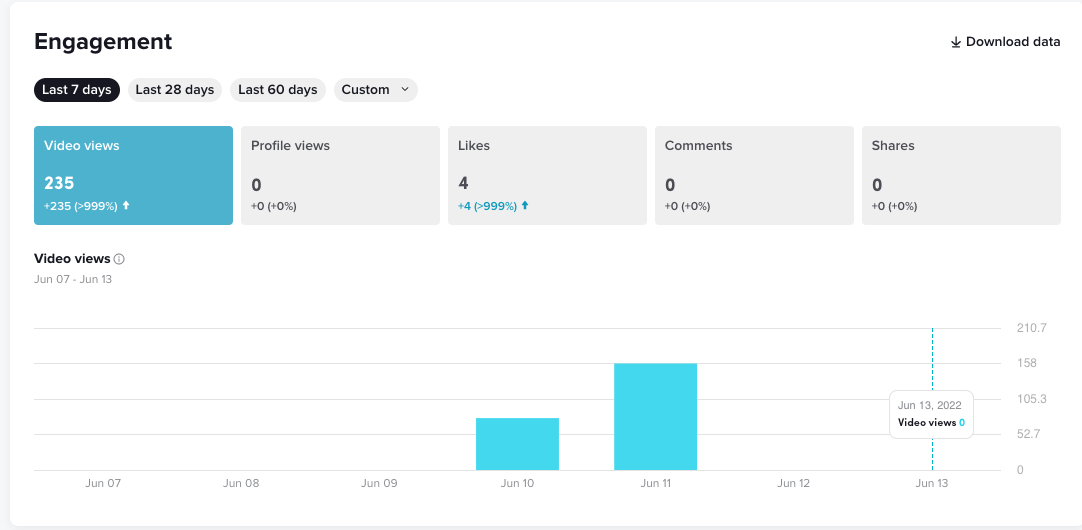
What it is: TikTok analytics doesn’t offer a single engagement metric. Instead, the Analytics Overview screen has an engagement tile that includes video views, profile views, likes, comments, and shares during the analyzed period.
Why it’s important: Engagement tells you how effectively your content connects with your audience. Additionally, the higher your engagement, the higher your reach is likely to be.
Where to find it: You can find the engagement tile—which contains your account’s video and profile views, likes, comments and shares—on the Overview page in Analytics. You can also view engagement data for individual videos by navigating to that content and looking at the video details screen.
If you need a single engagement rate, you can calculate it yourself the same way you would on other platforms, using a formula like:
((Likes + Comments + Shares) / Followers) * 100
Feel free to adapt this formula to include whichever engagement metrics you care most about.
Video Views
What it is: Video views are the amount of times people have played your video. Unlike other platforms, TikTok counts a view from the moment a video begins to play. This metric also counts repeat plays, so if a user loops your video several times, each loop will be counted as a view. You can view this metric at the account level (for all of your content) and at the video level.
Why it’s important: Because video views are counted from the moment they start, they’re essentially TikTok’s equivalent of an impression. Like impressions, video views tell you how effectively you’re putting content in front of your audience.
Where it is: To see your views at the account level, open TikTok Analytics. You can find your account’s video views in the Engagement tile. To see how many views a single video earned, open the video details.
Hashtag Performance
What it is: Typically, this refers to how many viewers found your video via a certain hashtag. However, if you’re creating custom hashtags for your brand, you could also look at the number of videos posted under that hashtag to analyze its performance as well.
Why it’s important: The hashtags you use on your videos can significantly impact your view count and engagement, so using the right ones is crucial. By tracking your video’s performance by hashtag, you can make more strategic choices and attract more viewers. (Additionally, if you’re trying to create a custom hashtag to help your audience connect with your brand, it’s extremely helpful to know how much traction it’s earned.)
Where to find it: Your video’s performance by hashtag can be found on the video details screen under “Video views by section.”
If you want to see the performance of a hashtag in and of itself, simply look up the hashtag on TikTok. Its views will be displayed to the right of the hashtag.
If you’re an ecommerce business who wants to increase brand awareness and drive conversion from social media, Pinterest might be perfect for you. This image-based social media platform is full of super-shareable content. According to Statista, Pinterest:
Has 86.35 million users in the U.S. Earns 885.7 billion visits every month Grows its audience by 12.4% year over yearIf your brand uses Pinterest as part of your social media strategy, track your progress with these KPIs.
Impressions
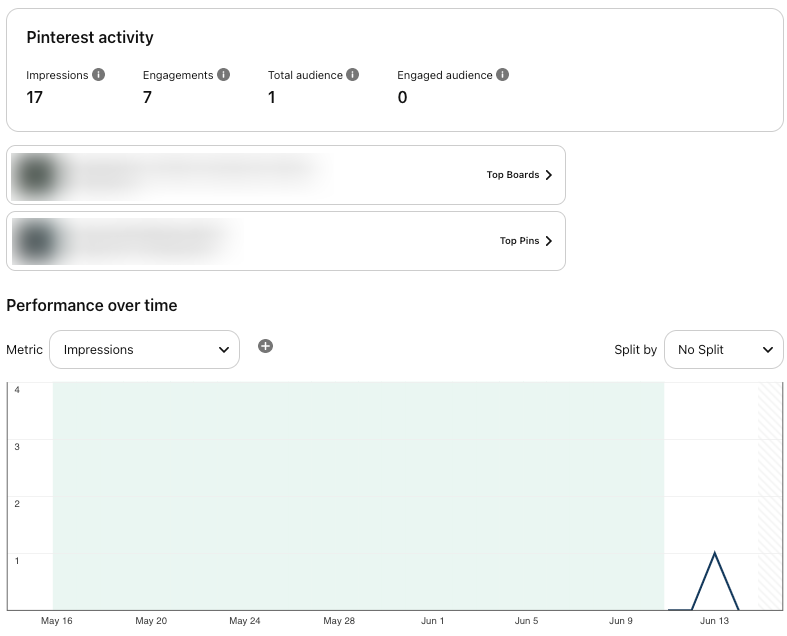
What it is: Impressions are the amount of times your pins have appeared on screen, regardless of whether a user clicked the pin to open it. Impressions can be viewed at the account level, looking at all activity during the analyzed period (e.g., the last 30 days) or by pin.
Why it’s important: Impressions can help illustrate how effectively you are putting content in front of an audience; for example, using keywords and hashtags that users gravitate toward. That said, because this metric includes the times a user scrolled past without interacting, it’s not particularly useful on its own unless your impressions are very low.
When viewed in comparison to pin clicks or other engagement, however, it can tell you a lot about how effective your pin design is at enticing viewers. In other words, if you have high impressions but low clicks, it’s likely most users are scrolling straight past you. In that case, revisit your content and design choices.
Where to find it: To see the impressions for one pin, access your account on a desktop, navigate to that pin, and select “see more stats.”
To see your account-wide impressions, visit the Overview page within Pinterest Analytics. See your overall impressions in the Pinterest activity tile, followed by your performance over time.
Engagement
What it is: Pinterest defines engagement asthe total number of “saves, pin clicks, outbound clicks, carousel card swipes, secondary creative (collections) clicks and Idea Pin forward/backward swipes.” In other words, engagement is any time somebody interacts with your pin instead of scrolling past it.
Why it’s important: While impressions show you how effective you are at getting your content in front of audiences, engagement shows you how enticing that content is. Interesting, well-designed pins drive pin clicks. Once a user clicks to open your pin, they engage in other ways (e.g., likes, saves, or outbound clicks) to show that they connected with it.
Where to find it: Your account-wide engagement can be found on the Overview page in Pinterest’s native Analytics. Here, you can also find your engaged audience metric, which tells you how many people in your audience interacted with your content.
While the pin stats page for individual pins does not currently include an engagement metric, you can see the comments, link clicks, saves, and other types of engagement.
Outbound Clicks
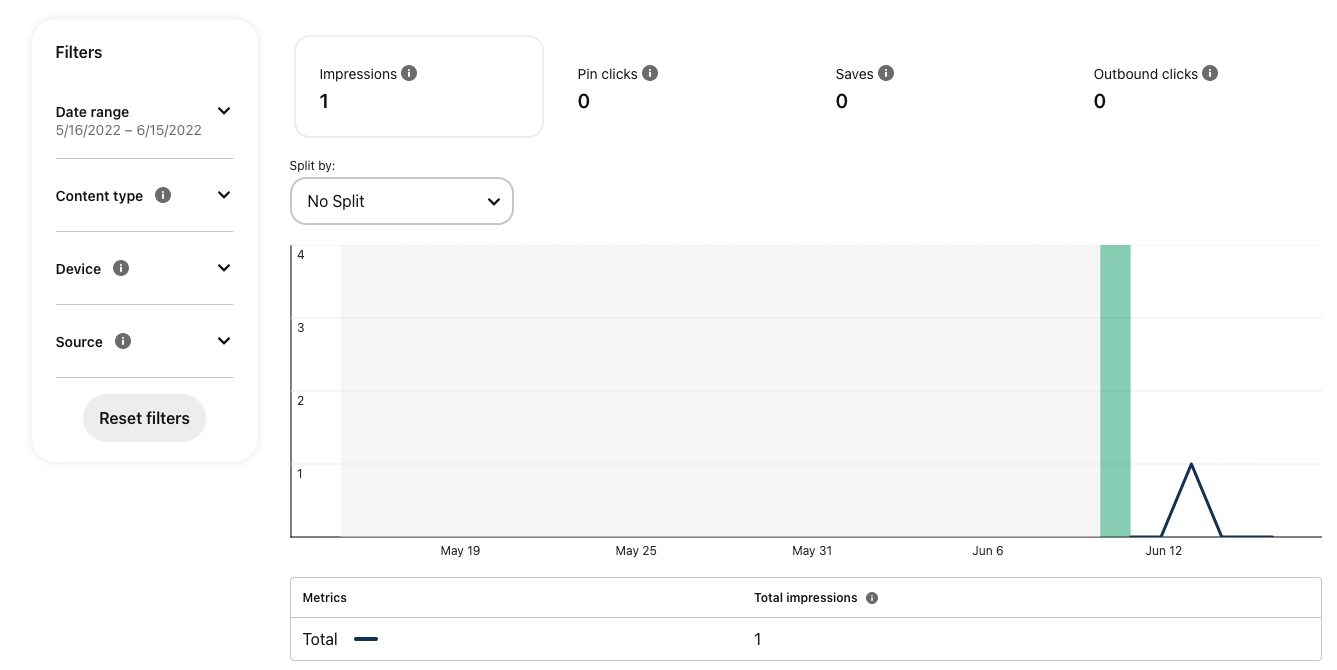
What it is: Outbound clicks are the amount of times a user clicked on an outbound link in your pin. For example, if you posted a photo of your product and linked to the product page in your online store, any time users clicked through to get to your website would be considered an outbound click.
Why it’s important: Ultimately, the goal of your business’s social media strategy is to drive more customers to your site or your storefront. Outbound clicks measure how effectively you’ve done that. Provided that you link to your own content, the more clicks you earn, the more visits your site receives—and the higher the potential to convert.
Where it is: To see the outbound clicks earned by one pin, navigate to its pin stats page. To see your outbound click performance at the account level, visit the Analytics Overview page. Then, under “performance over time,” select “outbound clicks.”
Twitter offers brands an opportunity not just to connect with their audience but also to participate in larger conversations. As such, done well, it can be a valuable tool to build brand awareness and stronger relationships with your customers.
According to Statista, in 2021, Twitter had:
178 million monetizable daily active users (mDAU) 429.79 million users around the world (38.5% of which fall in the 25-34 age bracket)If your brand relies on Twitter as part of its social strategy, consider tracking these KPIs.
Impressions

What it is: Impressions are the number of times your tweet appeared on screen, such as via a user’s timeline or under a hashtag. It’s available both at the account level (for the performance of all of your tweets) and for individual tweets.
Why it’s important: Impressions tell you how many people actually see your tweets, even if they don’t interact directly with them. This is especially important considering that many users do not see their timeline chronologically.
Where it is: To see how many impressions one tweet earned, navigate to that tweet and select “view stats.”
To see how many impressions all of your content has earned, navigate to Twitter Analytics. Here, you can see all the tweet impressions earned during the last 28 days, the amount of impressions earned during the current month, and data from previous months.
Engagement
What it is: Engagement is the amount of times people have retweeted, quoted, replied, liked, or clicked within your tweet.
Why it’s important: Engagement not only tells you how effective your content was; it also increases the odds that your content will be seen by more people. For example, likes and replies will typically show up on that user’s timeline, bringing more eyes to your brand.
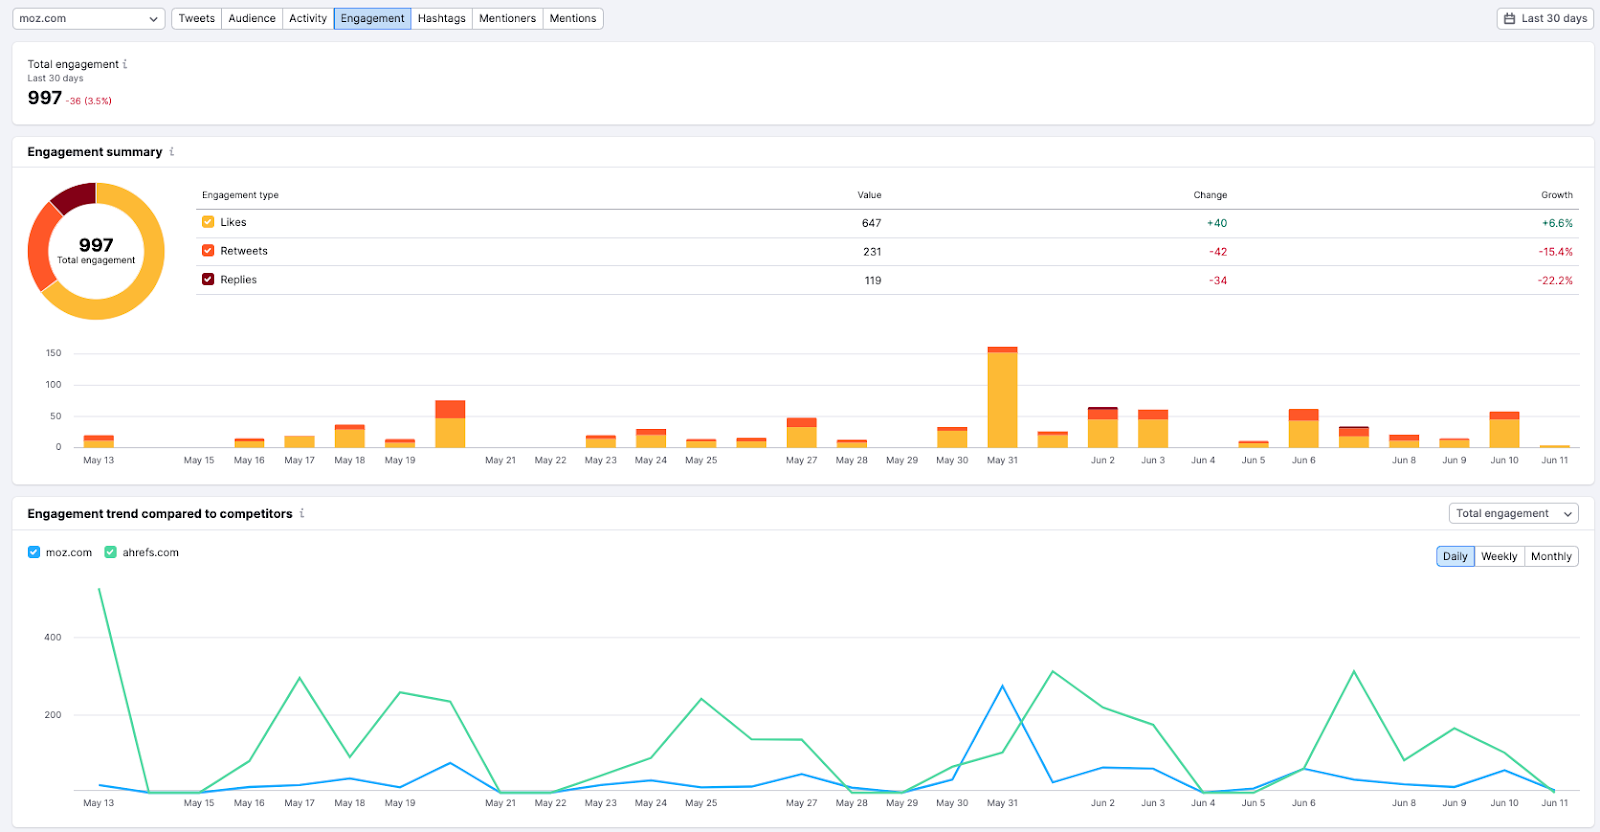
Where to find it: Analyze your content’s engagement (or your competition’s) with Semrush’s Social Media Tracker.
First, move to the Tweets section to find the number and rate of engagement for each post.

Then move to the Engagement section to see your overall trends, including the types of engagement you receive most, and how that metric has grown over time.
Link Clicks
What it is: Twitter considers a link click to be any click on a URL or a card within a tweet.
Why it’s important: If you’re using Twitter to promote your website’s content, products, or services, you’ll need to know whether your tweets are doing so effectively. Link clicks tell you that your tweet successfully convinced somebody to visit your site or view the content you wanted to promote.
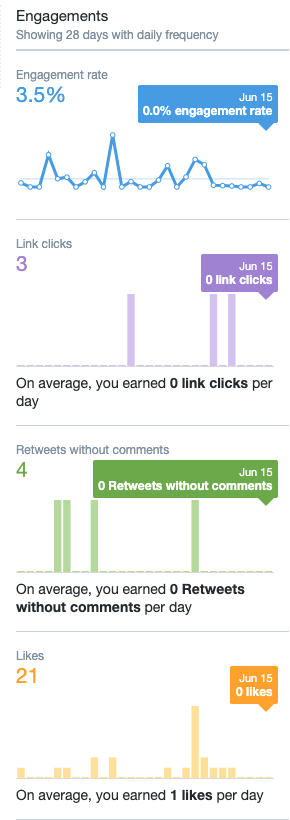
Where to find it: For individual tweets that contain a link, the link clicks metric can be found on the Tweet Activity page for that tweet. Find this page by navigating to the post in question and clicking “view stats.” This metric will not be visible if there is no link present.

You can also find monthly, account-wide link clicks data on the Tweet Activity page in Twitter Analytics, below Engagements.
Profile Visits
What it is: As the name suggests, profile visits represent the number of people who visited your profile either from a tweet or through another way, such as a search.
Why it’s important: As you build your social media presence, growing your follower count is crucial. While profile visits do not necessarily equate to followers, they’re an indication that people were interested enough to learn more about you.
Where it is: To find out how many people visited your profile from one tweet, select “view stats” to see that tweet’s activity.
To find out your account’s overall profile visits performance, visit the Overview page in Twitter Analytics. You can find this information in the 28-day summary and in each month.
For marketers—especially B2B marketers—it’s almost a given that you’re on LinkedIn. According to Statista, LinkedIn has 58.5 millions users in the United States, and 22% of them visit the site daily.
But how do you know if you’re connecting effectively with that audience? Try analyzing your performance with these KPIs.
Impressions & Unique Impressions
What it is: LinkedIn offers two impressions metrics—impressions and unique impressions. Impressions are the number of times at least 50% of your post was visible on screen for a logged-in user for at least 300 milliseconds.
Unique impressions are the number of times your post was visible (using the same standards) for unique users. This is similar to facebook’s “reach” metric.
Why it’s important: Together, impressions and unique impressions paint a picture of the size of your audience and how visible your content is to them. If the ratio is unusually high or low, this could be a sign to look more closely at your other KPIs.
Where to find it: You can find both your page’s impressions and unique impressions in two places in LinkedIn’s native Update Analytics.
First, if you navigate to Update Metrics, you can find impression data over time for all of your content during the analyzed period. To see data about an individual post, navigate to Update Engagements.
Engagements
What it is: While LinkedIn’s native analytics doesn’t have a metric that counts engagements, they do have an entire Update Engagements section. This includes information like video views, clicks, reactions, comments, shares, and more.
Why it’s important: Engagement shows that your users connect with your content enough to interact with it. What’s more, the type and content of that engagement can tell you more about your audience’s feelings and opinions about your brand and other important issues.
Where it is: You can find engagement information in Update Analytics, in the Update Engagements section. This is broken out by individual posts, so you can quickly spot trends and identify which posts did and did not perform well.
Engagement Rate
What it is: LinkedIn uses the following formula to calculate engagement rate:
(Number of interactions + Number of clicks + Number of followers acquired) / Number of impressions
Why it’s important: Engagement rate tells you the percentage of impressions that result in engagement with your post. The higher your engagement rate, the more successful your post is likely to be.
Where to find it: You can find your overall engagement rate in your page’s Update Metrics. To view your engagement rate for a single post, see Update Engagements.
Bring Your Social Media A-Game
Social media marketing is harder than it looks. Going in blind—without accurate data to guide your path—is a risk you probably don’t want to take. Luckily, you don’t have to.
While most social channels do offer native analytics options, the truth is, you probably have enough tabs open on your browser without having to log into every single social media account you have.
That’s where Semrush comes in. Our totally free social media management suite gathers all the data you need into one convenient place, so you can analyze your performance and competition, set your social media goals, and schedule your posts—all without missing a beat.
Try it for yourself.
Innovative SEO services
SEO is a patience game; no secret there. We`ll work with you to develop a Search strategy focused on producing increased traffic rankings in as early as 3-months.
A proven Allinclusive. SEO services for measuring, executing, and optimizing for Search Engine success. We say what we do and do what we say.
Our company as Semrush Agency Partner has designed a search engine optimization service that is both ethical and result-driven. We use the latest tools, strategies, and trends to help you move up in the search engines for the right keywords to get noticed by the right audience.
Today, you can schedule a Discovery call with us about your company needs.
Source:


