

Whether you are working at an agency or on the client side, in all likelihood, you are spending at least one day a month pouring over your Google Analytics (GA) account to pull together reports for various parts of your site. Even people who know there is a better way will often postpone report automation over and over again because of the initial investment of hours needed to set things up.
Most of the time we will excuse the work to ourselves and others by pointing out that the monthly report is pulled together much quicker these days as we have been doing it for so long and we are used to the process. Other times, we will point out that spending the time automating reporting will set us back in other tasks. For others, there is the issue of not knowing where to start or fearing possible costs (sometimes even the worry that it may not work).
However, for most marketers, Analytics reporting can be reduced to a few clicks of a mouse simply by spending a day or so automating the whole process. When you consider that this can all be done using freely available Google programs, the cost relative to the potential benefit is one of the most unevenly matched positives you are likely to come across in marketing.
While this can be configured to include AdWords data, we will be dealing with Analytics only for this blog post, though I may write again on AdWords in the future.
Step One: What You Will Need to Begin
Other than your GA account, you will need just three things in order to begin the process of automating your reporting:
Google Sheets: - available as a free Google alternative to Excel, Google Sheets is the program into which you will be pulling your data. Google Sheets is available here. The 'Google Analytics' add-on: - Available here, this add-on allows you to connect Google Sheets and your GA account. It also provides a wizard to speed the process along. Google Data Studio: - Data Studio is a data visualizer currently in beta and available here. By linking your Google sheet to Data Studio, you can create easy to parse reports for a whole manner of different KPIs.Step Two: How to Begin Your Automation
The first step is to define what you want to see in any eventual report. While many will have a template to work from, if you are not currently reporting, or are looking to update your metrics, then now is the time to do this – before you go any further.
The reason for this is simply that, if you are at all like me, having a virtually limitless set of possibilities and variations can send you down a rabbit hole of constant tinkering, equally – some may find it overwhelming (what is known as ‘ Analysis Paralysis’).
For those that don’t have a template or previous marketing report to work from or replicate, I will touch briefly on reasonable some report types for a couple of different kinds of sites (many sites could and do use many of the KPIs mentioned below).
A Blog (personal or professional)
Your blog, if you already are or are looking to monetize your blog, will (unlike my own) be regularly updated with fresh, useful content. As such, the number of pages will increase fairly rapidly – as will the number of event or destination goals you will track. This can cause the reporting time to increase concomitantly.
The main aims of reporting for a blog (at the most base level) are to track sessions, actions, the performance of posts, time on page and (if required) goal conversions.
A Brand Website
A brand’s website, which is looking to provide a similar, positive user experience (UX) as a simple blog (though it may include one), has some slightly different requirements for reporting.
In addition to session data and goal conversions, brands will be looking to track top performing pages, referral sources (I know this is true of blogs, too, but bear with me), exit pages and more.
Step Three: Setting Up Reports
The first thing to do is to install the add-on and allow it access to your Analytics data (which can be done in the ‘Add-Ons’ drop down in the menu bar); from there it is a case of knowing what to look for and how to find it.
For a basic report, it is possible to use the aforementioned wizard – which will allow you to set the basic parameters for your report. It is as good a place as any to start and the metric and dimension finder works on a text search, which can save time in the early set-up.
The sections of the wizard are reasonably self-explanatory for the most part, but for the purposes of a walkthrough:
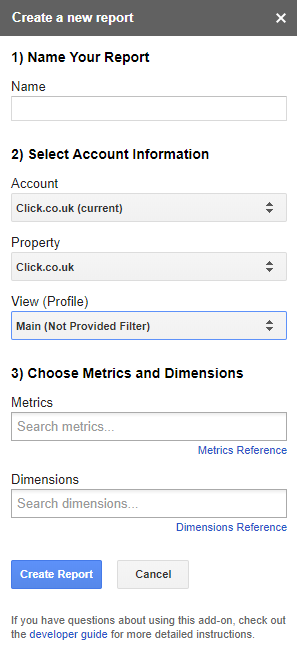
Name Your Report – While it is a perfectly simple instruction, I did make the mistake of failing to name reports sufficiently, and distinctly, with my first set of reports. Depending on the complexity of the result you are looking for, these reports can stack up fairly quickly, so name the report in a manner that will make it easy to find what you need and rediscover.
Select Account Information – The three options in this section relate to your GA account. Depending on how many accounts you are managing, you will need to make sure you pick the right ones. While you can edit the details in the main report tab, it is just quicker to make doubly sure here.
Section three is where you make the magic happen. While you can add ten each to the dimension and metric sections of your report – consider how you want the eventual report to look. It tends to be easier to compile your final Data Studio document from summary sheets and, in turn, it is easier to create these summary sheets if the data you are summarising is easily identifiable in these reports. So keep your dimensions and metrics short and sweet (you can always add more later on).
Once you have added the necessary metrics and dimensions, you can click "create report". This will populate your sheet with a configure column – next to which will be your report. The first thing you will notice is that there are a number of empty cells in your report – this is where you can begin to tweak your report to ensure it is only giving you the data you want.
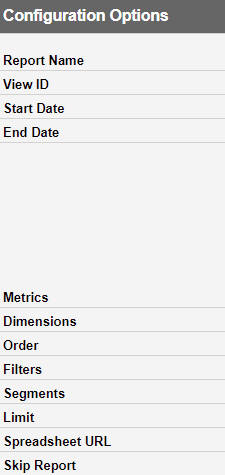
The configuration options are a little more complicated because of the refinement options but are – in and of themselves – again fairly obvious.
‘Report Name’ and ‘View ID’ are entered during the wizard stage (the name of your report and Analytics view respectively).
‘Start Date’ and ‘End Date’ will need to be entered – and will determine the period your report covers. If you are looking at scheduling a daily report and would like to avoid having to enter an end date each morning, you can simply enter =TODAY() in the ‘End Date’ cell which will update automatically.
‘Metrics’ and ‘Dimensions’ were, again, defined during the wizard – but we will go into these a little more in a moment.
‘Order’ refers to how the report will be arranged (i.e., ascending or descending), but I recommend drawing the actual report from a series of summary pages, as it is safe to leave this and sort the data either in the summary sheet or in Data Studio itself.
Filters allow you to restrict the data – this is especially useful if you are looking to capture data from specific subfolders (a blog or resource section, for example). One of the reports that run for the Click Consult blog (for example) features the metrics, dimension, and filter on the right.
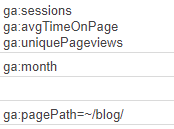
As you can see – this pulls the session, time on page and unique page views, defines it by month and limits the data captured by the report to the specific /blog/ subfolder.
‘Segments’ is another data limiting option – allowing you to refine data by specific segment parameters. A brand operating in multiple countries, for example, could limit data per country using a string like: gaid::-1,segment=sessions::condition::ga:country==United Kingdom.
The ‘Limit’ option is mostly important for larger sites (e-commerce sites, for example) which have the potential to return thousands or even millions of results. In these cases, limit the data to a manageable number. While many of these functions can be done later – either in the summary sheet or Data Studio – not limiting the data for large sites can make reporting unmanageable and report run times excessive.
Spreadsheet URL allows you to export results to a second, external sheet (for which you must have edit permissions). For most purposes, allowing the report to output to the same sheet is perfectly fine.
Metrics and Dimensions
There is a complete list of metric and dimension codes here, but for the purposes of illustration, here are a few that could apply to either of the two kinds of sites mentioned earlier.
TIP: an update today near gave me a heart attack, leading to the following pro tip: separate multiple metrics, etc. with commas or your reports no longer work. As the plug-in only permits 10 metrics per report, I have split them into two distinct reports – session level and page level:
Session level
Dimensions
ga:month – Your session level report will deal entirely with metrics, but the initial set up (and some chart types in Data Studio) requires a dimension, so a time-based dimension is worth entering. Assuming a monthly report, this will treat the ‘month’ as a dimension. This can be replaced with any dimension of your choosing – provided it’s compatible with the metrics (which, if you aren’t already familiar with matches, can be quickly checked in Analytics).Metrics
ga:sessions – This metric delivers a count of total sessions for the selected view (this matches with Analytics, obviously, where a view created part way through the report period will return only the sessions in that time and not overall for the site). ga:users – Returns the total number of users that have produced the previous number of sessions. ga:percentNewSessions – Gives a decimal figure for the number of sessions which were ‘new’ (i.e., from previously unseen users). If you wish to, this will need converting into a percentage figure in the summary sheet. ga:avgSessionDuration – Returns a figure representing the average session duration – it will need to be converted into a time format in the summary sheet. ga:pageviews – This is the total number of pages viewed during the selected period. ga:pageviewsPerSession – This is the average number of pages viewed in each session on the site. ga:goalCompletionsAll – This provides an overview of the total goal completions for the selected view. If you want to measure specific goals individually, you can use ga:goalXXcompletions where ‘XX’ is the goal number of your desired goal in the Analytics goal report (in ‘Admin’). If you have multiple views, you’ll need to create multiple versions of this report before collating the results in the summary sheet.Top pages
Dimensions
ga:pageTitle – This dimension, too, can be subbed for another if needed, but in this instance, the page title dimension will pull through the meta title for each page, allowing you to determine the performance of specific posts or landing pages.Metrics
ga:sessions – This metric here will return sessions per page title. ga:users – The same is true here, the total will split between each page listed. ga:percentNewSessions –This is again split out per page (and can give you some additional information about the usefulness to users of certain pages). ga:avgSessionDuration – The average session duration of users that have viewed each page. ga:pageviews – How many pages a user has viewed in addition to the listed page. ga:pageviewsPerSession – The number of pages in a session that includes the correlating page. ga:uniquePageviews – How many unique page views the page has received in the specified period. ga:avgTimeOnPage – How long the average user has spent on the page (good for determining whether they are actually reading the information on the page). ga:goalCompletionsAll – Again, if you want to know how many conversions the page has led to for each individual goal, you can use goalXX, but this will give you a total for the page for the view.There are some obvious omissions – you can track bounce rate and referral sources and any other metric or dimension as you choose, but (as I am at more than two thousand words already), I thought I’d leave that for you to explore.
Step Four: Creating Summaries and Scheduling
While this step isn’t compulsory, it does make the eventual report collation much easier (and appeals to some part of me that requires neatness in numbers). Essentially, it is possible to compile reports through Data Studio using the raw data, but it can become messy and long-winded. Instead, I prefer to create a number of summary sheets that directly reflect the data required for the eventual report.
For the top performing page report, for example, you can create a table which places the dimension ga:pageTitle in column A – using formula =('**REPORT TITLE**'!A--) to draw through the page title – against the various metrics (using the same type of formula if you just require the exact information returned).
For time calculations, however, you’ll need to convert the number returned from analytics into standard hh:mm:ss format using a formula such as =sum('**REPORT TITLE**'!C--/86400) where the /86400 and selecting hh:mm:ss as the cell display will convert the number into the right format.
Once you have set up summary sheets (including selecting unnecessary but lovely color schemes, ensuring a good cell width and height to make the table look balanced… okay, that may just be me — and then you can schedule the report from the Add-ons>Google Analytics>Schedule reports options from the menu.
Step Five: Importing Data to Google Data Studio
This is where you can begin to visualize the report for public (or at least client/employer) consumption. Upon opening Data Studio, select ‘New report’ and name it – again, clearly and precisely. Following that, you will need to create a data source.
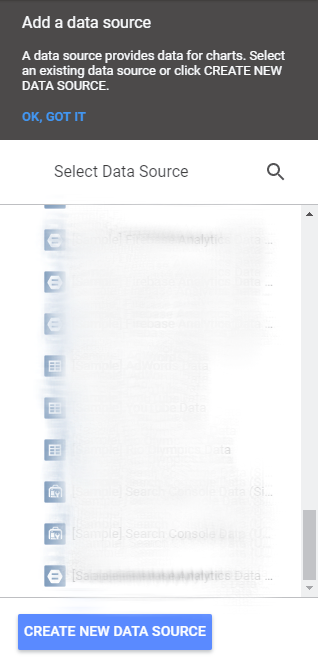
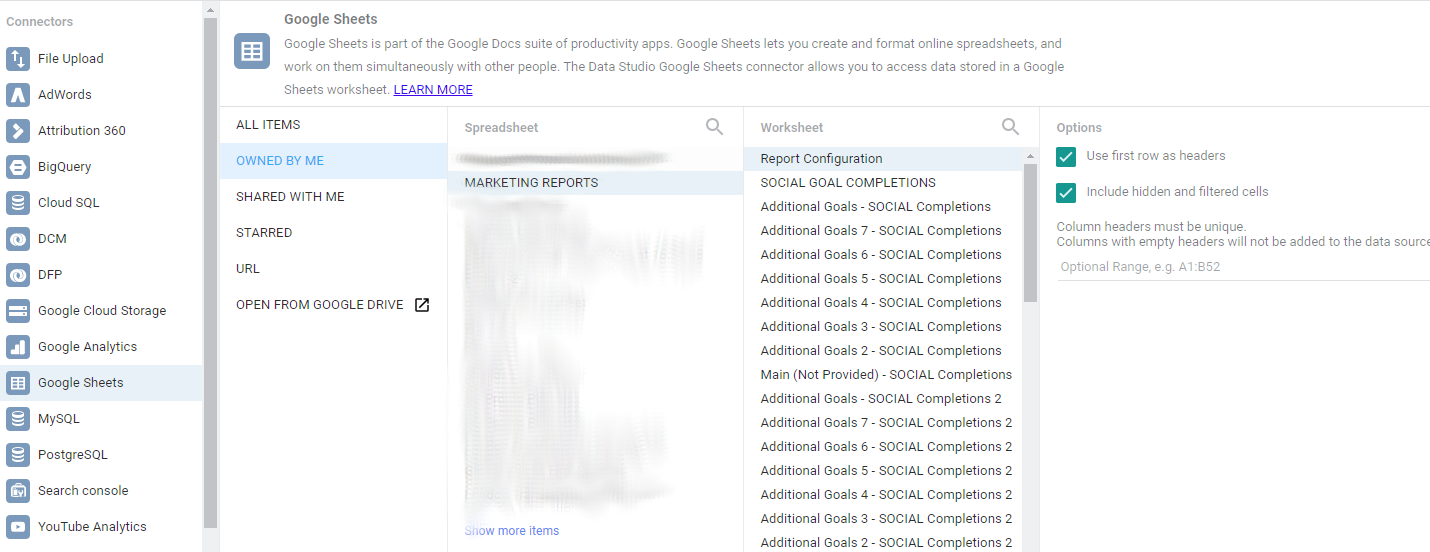
Clicking the ‘CREATE NEW DATA SOURCE’ button will then take you through to a second menu that will give you a list of possible data sources. For this report, we need to select ‘Google Sheets’, though as you will see you can pull straight from Analytics if you feel confident (which point I am yet to reach). You can also see that you can import from other Google properties also.
However, in this instance, it is enough to select ‘Google Sheets’, then find your saved sheet and select the specific worksheet you wish to use in your first report. You can then click the ‘CONNECT’ button.
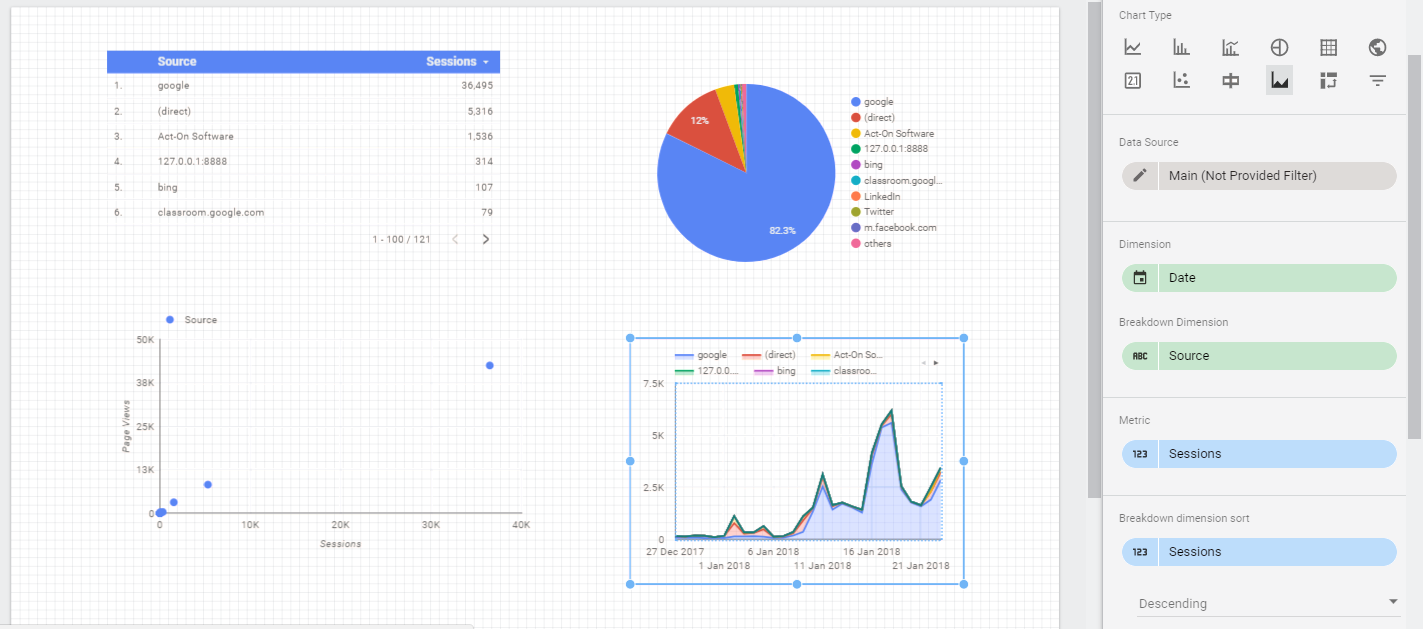
Once you have connected the appropriate sheet, you can then select a chart type from the toolbar and sketch out the size of the chart you want to create.
Using your summary sheets, you can then select your desired dimensions and metrics to easily create a variety of different report types in seconds.
While it may be necessary to add filters to the reports to exclude null results or reduce the number of results pulled through to a reasonable number, once your report is set up. The process is complete until you either need to change months in Google Sheets (which you can avoid having to do by using EOM and DAY formula) or add a view or another report.
While the process of getting there can be a little arduous, once completed this report will run on Google Sheets without intervention, leaving you to generate your monthly (or weekly, daily, etc.) reports at the click of the refresh button.
Innovative SEO services
SEO is a patience game; no secret there. We`ll work with you to develop a Search strategy focused on producing increased traffic rankings in as early as 3-months.
A proven Allinclusive. SEO services for measuring, executing, and optimizing for Search Engine success. We say what we do and do what we say.
Our company as Semrush Agency Partner has designed a search engine optimization service that is both ethical and result-driven. We use the latest tools, strategies, and trends to help you move up in the search engines for the right keywords to get noticed by the right audience.
Today, you can schedule a Discovery call with us about your company needs.
Source:

![How To Create a Strategic Dashboard in Excel Using Semrush Data [Excel Template Included]](https://allinclusive.agency/uploads/images/how-to-create-a-strategic-dashboard-in-excel-using-semrush-data-excel-template-included.svg)
