

Written content, or text, appears in most online marketing channels and in many different ways. Having a methodology for analyzing text is essential, and while it may come in an array of forms, there are structures and patterns that can be used to standardize the analytical process.
So what kind of text am I talking about, and what kind of analysis? Let's find out...
The Text
Text typically manifests as phrases or short paragraphs along with metrics that describe it with numbers:
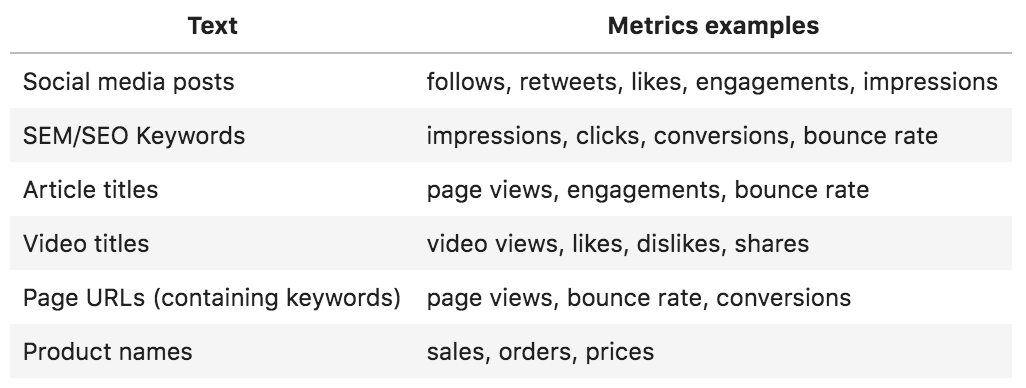 Online marketing text and metrics examples
The Analysis
While there are numerous text mining techniques and approaches, I will focus on two topics for this analysis: extracting entities and word counting.
1. Extracting Entities:
There is a set of techniques that try to determine parts of a phrase or a sentence (people, countries, subject, predicate, etc.), which is formally called "entity extraction". For the purpose of this article, I will be extracting much simpler and structured entities that typically appear in social media posts as hashtags, mentions, and emojis. Of course, there are others (images, URL's, polls, etc.), but these are the three I will discuss:
Hashtags: Usually the most important words in a social media post, hashtags readily summarize what a given post is about. They are often not words in the traditional sense; they can be brands, phrases, locations, movement names, or acronyms. Regardless, their common strength is that they efficiently communicate the subject of the post. Mentions: As with hashtags, mentions are not words per se. Mentions serve to show connections between one post and another as well as connections among users. They show conversations and indicate whether or not a specific account(s) is meant to receive a particular message. In a social media posts data set, the more mentions you have, the more 'conversational' the discussion is. For more advanced cases, you can do a network analysis to see who the influential accounts (nodes) are and how they relate to others in terms of importance, clout, and centrality to the given network of posts. Emojis: An emoji is worth a thousand words! As images, they are very expressive. They are also extremely efficient because they typically use one character each (although in some cases, more). Once we extract emojis, we will get their "names" (represented by short phrases); this allows us to view the images as text so we can run normal text analyses on them. For example, here are some familiar emojis and their corresponding names: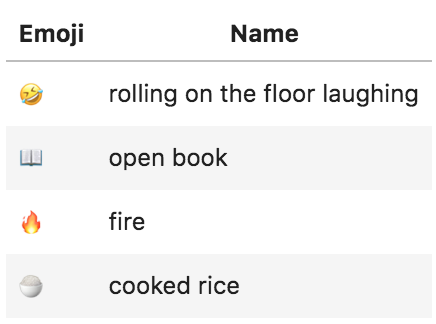 Emoji examples and their names
2. Word Counting (Absolute and Weighted):
One of the basic things to be done in text mining is counting words (and phrases). A simple count would easily tell us what the text list about. However, we can do more in online marketing. Text lists usually come with numbers that describe them so we can do a more precise word count.
Let's say we have a set of Facebook posts that consists of two posts: "It's raining" and "It's snowing". If we count the words, we will see that 50% of the posts are about raining and the other 50% are about snow — this is an example of an absolute word count.
Now, what if I told you that the first post was published by a page that has 1,000 fans/followers, and the other was published by a page that has 99,000? Counting the words we get a 50:50 ratio, but if we take into consideration the relative number of people who are reached by the posts, the ratio becomes 1:99 — this is a weighted word count.
So what we can do is count each word of each post not once, but by the number of fans/followers that it is expected to reach, thereby giving us a better idea of the importance of each post with weighted word counting.
Here are some other examples to make the point clearer:
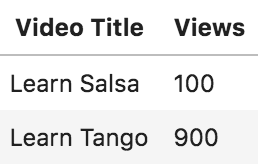
Assume we have a YouTube channel that teaches dancing, and we have two videos:
 Video titles and views
It is evident that the ratio of salsa to tango is 50:50 on an absolute word-count basis, but on a weighted basis, it is 10:90.
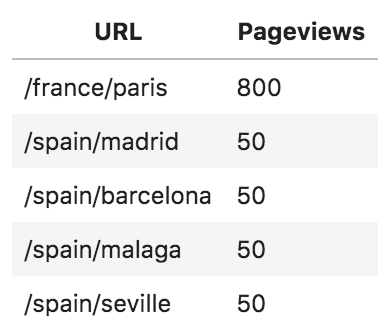
Another illustration is a travel website that has several pages about different cities:
 Pageviews per city sample report
Although 80% of the content is about Spanish cities, one French city generates 80% of the site's traffic. If we were to send a survey to the site's visitors and ask them what the website is about, 80% of them are going to remember Paris. In other words, in the eyes of the editorial team, they are a "Spanish" website, but in the eyes of readers, they are a "French" website.
The weighted word-count metric could be anything, such as sales, conversions, bounce rates, or whatever you think is relevant to your case.
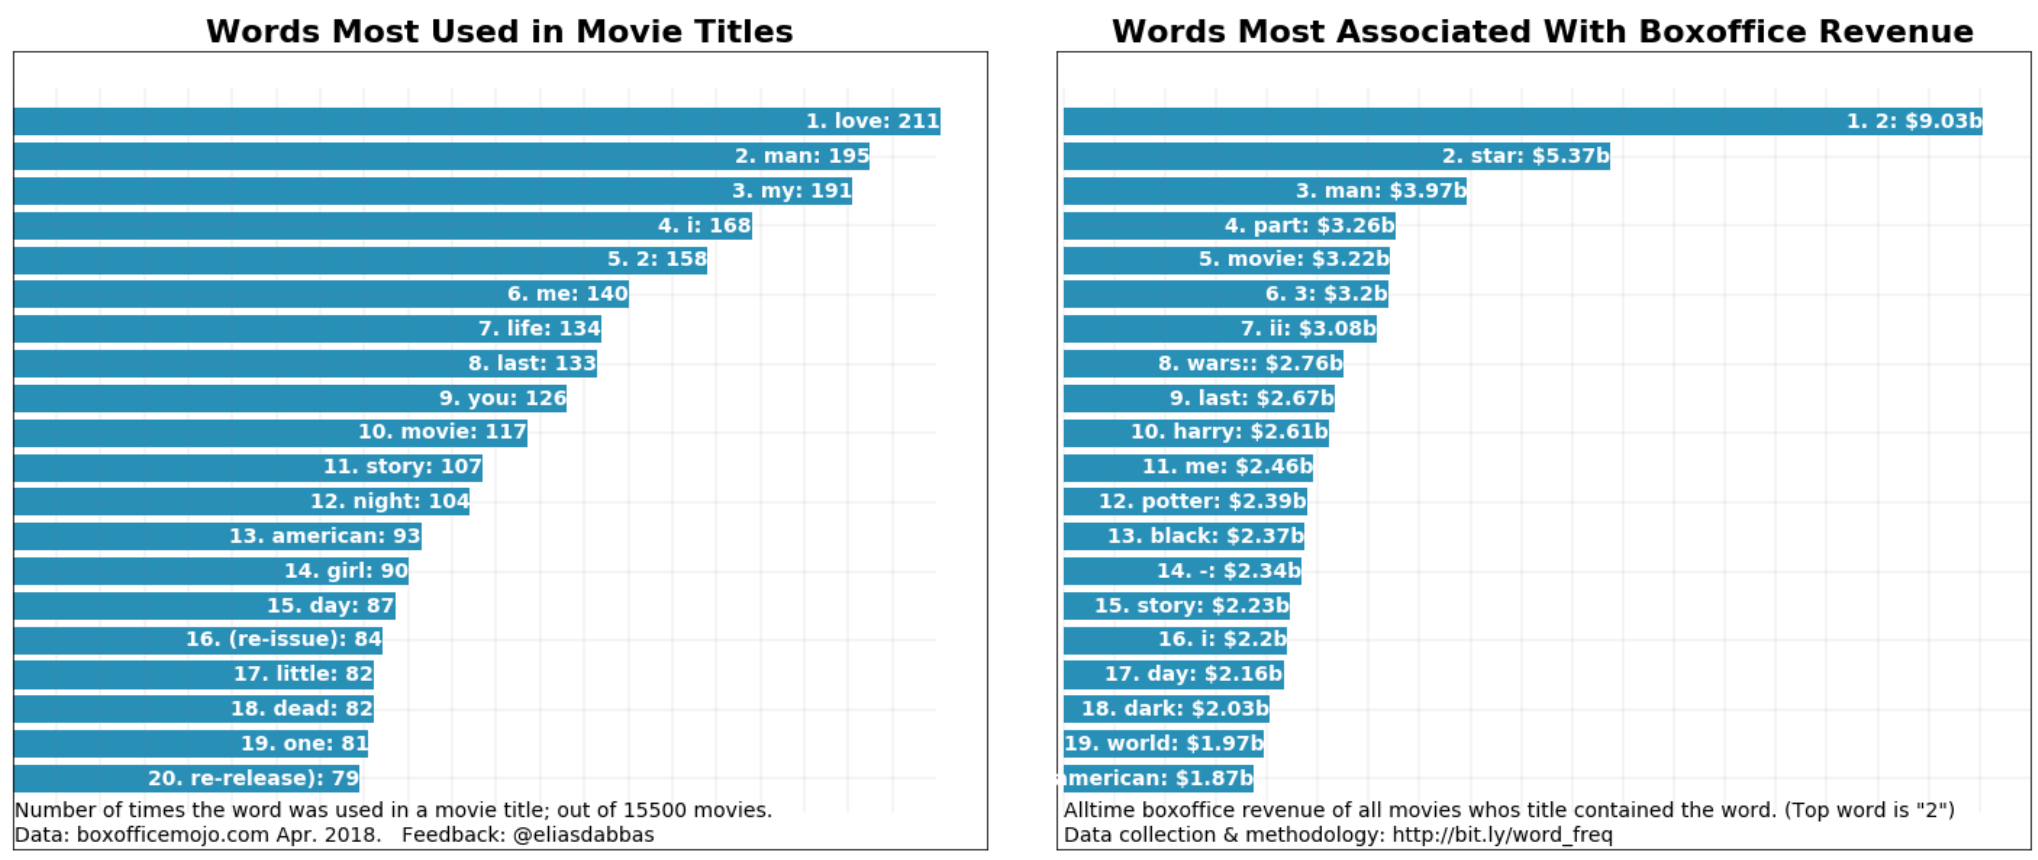
Finally, here is a real-life example of an analysis I ran on Hollywood movie titles:
 Movie titles word frequency analysis
Out of 15,500 movie titles, the most frequently used word is "love", but that word is nowhere to be found in the top 20 list showing the words most associated with box-office revenue (it actually ranks 27th). Of course, the title of the movie is not what caused the revenue to be high or low as there are many factors. However, it does show that Hollywood movie producers believe that adding "love" to a title is a good idea. On the other hand, "man" also seems to be popular with producers, and frequently appears in movies that generated a lot of money.
Twitter Setup
For this example, I will be using a set of tweets and its corresponding metadata. The tweets will be about the 61st Grammy Awards. The tweets were requested as containing the hashtag #Grammys. The tweets were requested about ten days before the awards.
To be able to send queries and receive responses from the Twitter API, you will need to do the following:
Apply for access as a developer: Once approved, you will then need to get your account credentials. Create an app: So you will be able to get the app's credentials. Get credentials by clicking on "Details" and then "Keys and tokens": You should see your keys where they are clearly labeled: API key; API secret key; Access token; and Access token secret.Now you should be ready to interact with the Twitter API. There are several packages that help with this. For illustrative purposes, I will be using the Twitter module of the advertools package as it combines several responses into one, and provides them as a DataFrame that is ready to analyze; this will enable you to request a few thousand tweets with one line of code so you can start your analysis immediately.
A DataFrame is simply a table of data. It is the data structure used by the popular data science languages and refers to a table that contains a row for every observation and a column for every variable describing the observations. Each column would have one type of data in it (dates, text, integers, etc.) — this is typically what we have when we analyze data or export a report for online marketing.
Overview of the Third-Party Python Packages Used
In my previous SEMrush article, Analyzing Search Engine Results Pages on a Large Scale, I discussed the programming environment for my analysis. In this analysis, I employ the same third-party Python packages:
Advertools: This package provides a set of tools for online marketing productivity and analysis. I wrote and maintain it, and it can be used for: Connecting to Twitter and getting the combined responses in one DataFrame. Extracting entities with the "extract_" functions. Counting words with the "word_frequency" function. Pandas: This is one of the most popular and important Python packages, especially for data science applications. It is mainly used for data manipulation: sorting; filtering; pivot tables; and a wide range of tools required for data analysis. Matplotlib: This tool will be used primarily for data visualization.You can follow along through an interactive version of this tutorial if you want. I encourage you to also make changes to the code and explore other ideas.
First, we set up some variables and import the packages. The variables required will be the credentials we got from the Twitter apps dashboard.
%config InlineBackend.figure_format = 'retina' import matplotlib.pyplot as plt import advertools as adv import pandas as pd pd.set_option('display.max_columns', None)app_key = 'YOUR_APP_KEY' app_secret = 'YOUR_APP_SECRET' oauth_token = 'YOUR_OAUTH_TOKEN' oauth_token_secret = 'YOUR_OAUTH_TOKEN_SECRET' auth_params = { 'app_key': app_key, 'app_secret': app_secret, 'oauth_token': oauth_token, 'oauth_token_secret': oauth_token_secret} adv.twitter.set_auth_params(**auth_params)
The first few lines above make available the packages that we will be using, as well as define some settings. The second part defines the API credentials as variables with short names and sets up the login process. Keep in mind that whenever you make a request to Twitter, the credentials will be included in your request and allow you to get your data.
At this point, we are ready to request our main data set. In the code below, we define a variable called Grammys that will be used to refer to the DataFrame of tweets that contain the keywords that we want. The query used is "#Grammys -filter:retweets".
Note that we are filtering out retweets. The reason I like to remove retweets is that they are mainly repeating what other people are saying. I am usually more interested in what people actively say as it is a better indication of what they feel or think. (Although there are cases where including retweets definitely makes sense.)
We also specify the number of tweets that we want. I specified 5,000. There are certain limits to how many you can retrieve, and you can check these out from Twitter's documentation.
grammys = adv.twitter.search(q='#Grammys -filter:retweets', lang='en', count=5000, tweet_mode='extended')Now that we have our DataFrame, let's start by exploring it a little.
grammys.shape(2914, 78)
The "shape" of a DataFrame is an attribute that shows the number of rows and columns respectively. As you can see, we have 2,914 rows (one for each tweet), and we have 78 columns. Let's see what these columns are:
grammys.columns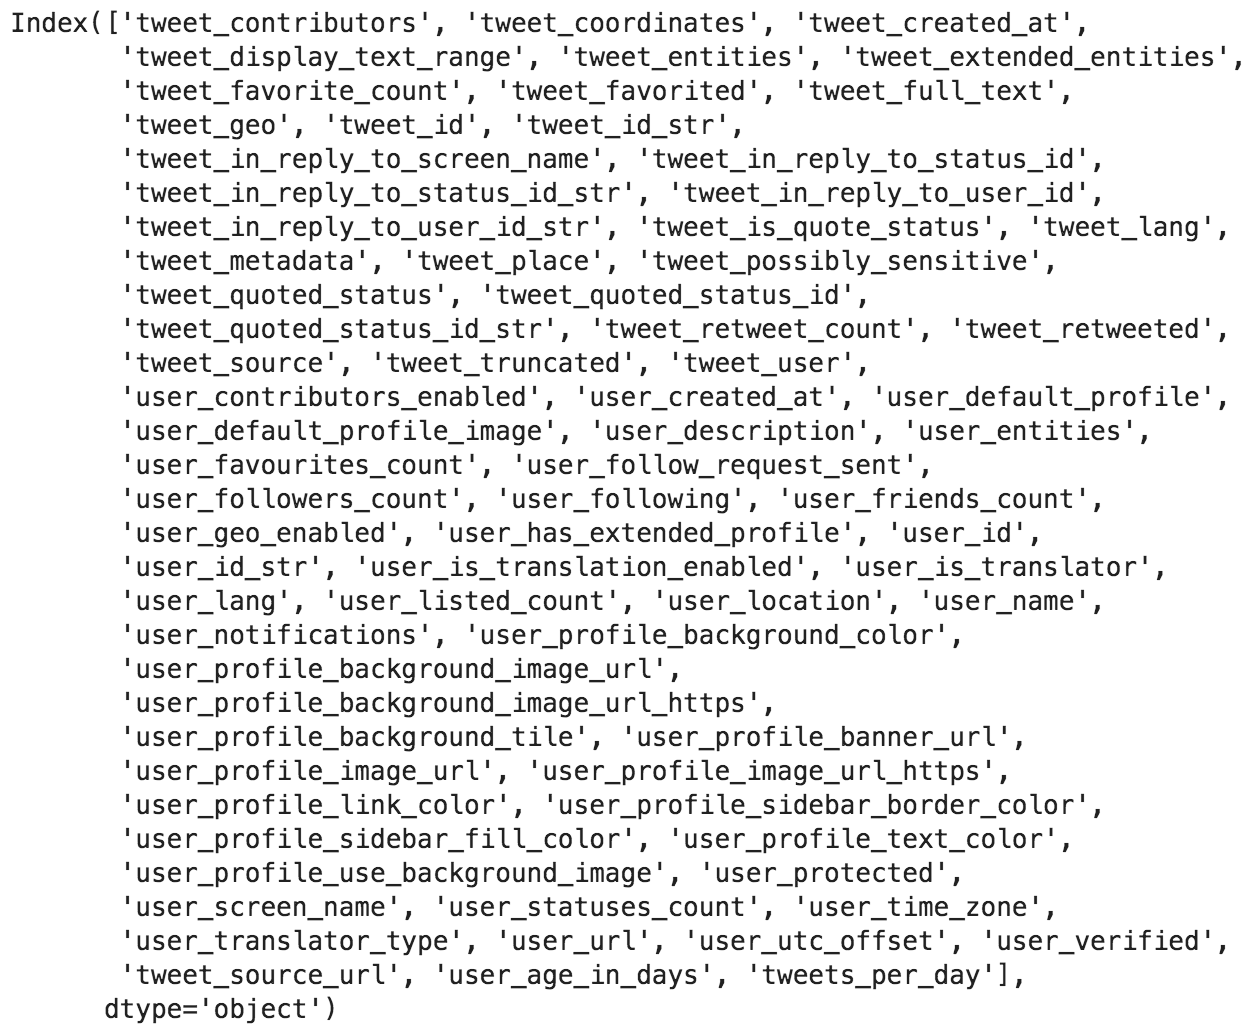 DataFrame column names (Twitter API)
Out of these columns, there are maybe 20 to 30 that you probably would not need, but the rest can be really useful. The names of columns start with either "tweet_" or "user_". — this means that the column contains data about the tweet itself, or about the user who tweeted that tweet, respectively. Now, let's use the "tweet_created_at" column to see what date and time range our tweets fall into.
(grammys['tweet_created_at'].min(), grammys['tweet_created_at'].max(), grammys['tweet_created_at'].max() - grammys['tweet_created_at'].min())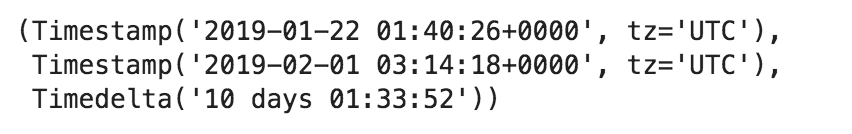 Tweets min and max datetimes - government shutdown
We took the minimum and maximum date/time values and then got the difference. The 2,914 tweets were tweeted in ten days. Although we requested five thousand, we got a little more than half that. It seems not many people are tweeting about the event yet. Had we requested the data during the awards, we would probably get 5,000 every fifteen minutes. If you were following this event or participating in the discussion somehow, you would probably need to run the same analysis, every day during the week or two before the event. This way, you would know who is active and influential, and how things are progressing.
Now let's see who the top users are.
The following code takes the grammys DataFrame, selects four columns by name, sorts the rows by the column "user_followers_count", drops the duplicated values, and displays the first 20 rows. Then it formats the followers' numbers by adding a thousand separator, to make it easier to read:
(grammys [['user_screen_name', 'user_name', 'user_followers_count', 'user_verified']] .sort_values('user_followers_count', ascending=False) .drop_duplicates('user_screen_name') .head(20) .style.format({'user_followers_count': '{:,}'}))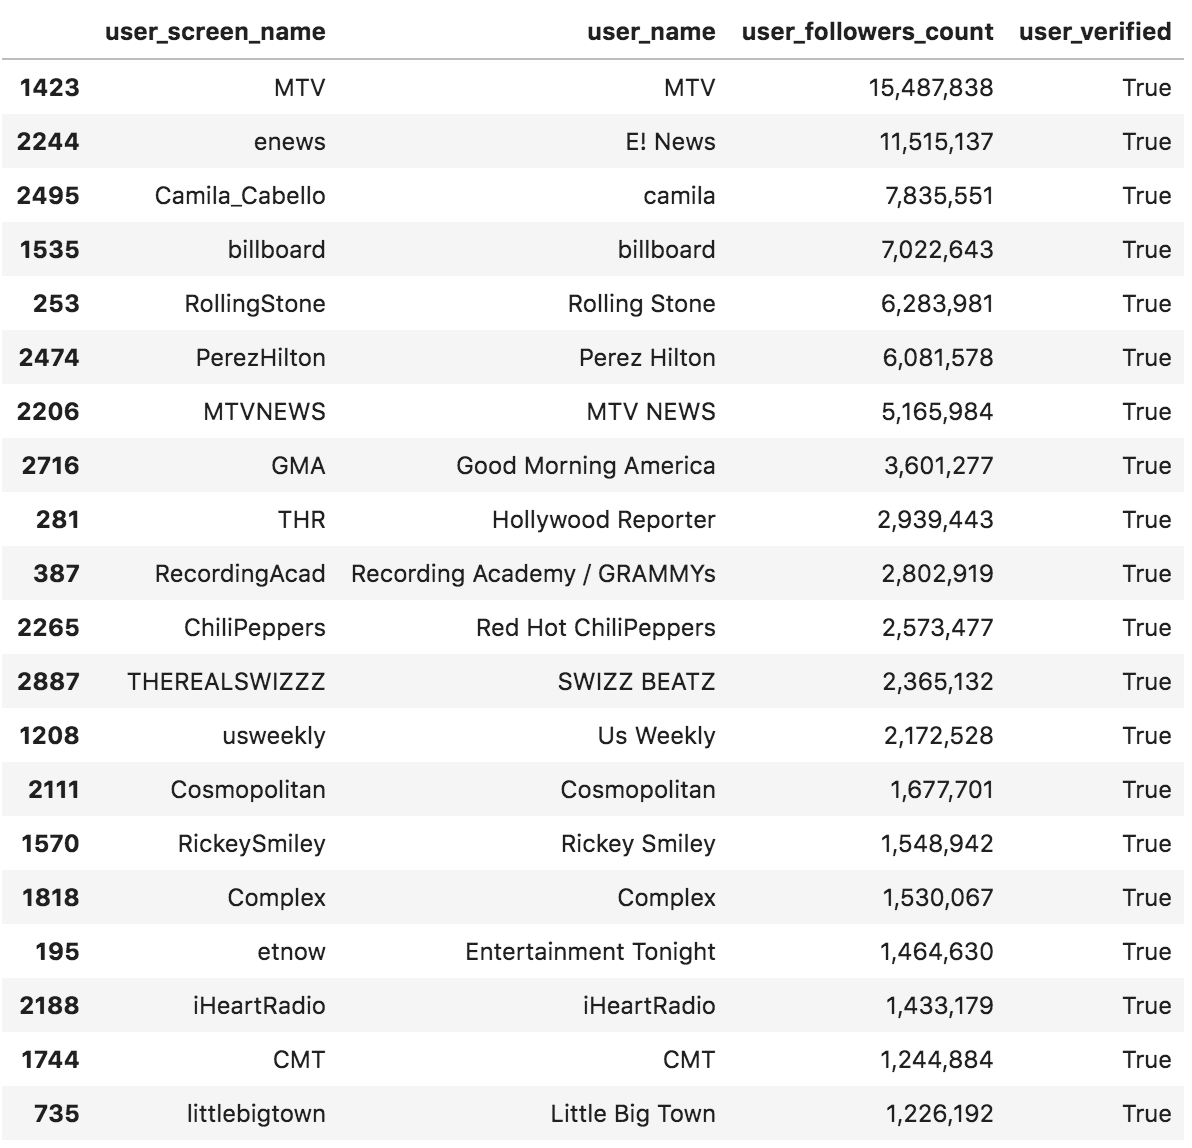
It seems the largest accounts are mainly mainstream media and celebrities accounts, and all of them are verified accounts. We have two accounts with more than ten million followers, which have the power to tilt the conversation one way or the other.
Verified Accounts
The values in the column user_verified, take one of two possible values; True or False. Let's see how many of each we have to look at to determine how "official" those tweets are.
grammys.drop_duplicates('user_screen_name')['user_verified'].value_counts()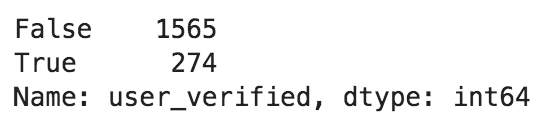 Number of verified accounts
The data: 274 out of 1,565+274=1,839 accounts (around 15%) are verified. That is quite high and is expected for such a topic.
Twitter Apps
Another interesting column is the tweet_source column. It tells us what application the user used to make that tweet. The following code shows the counts of those applications in three different forms:
Number: the absolute number of tweets made with that application. Percentage: the percentage of tweets made with that application (17.5% were made with the Twitter Web Client for example). Cum_percentage: the cumulative percentage of tweets made with applications up to the current row (for example, web, iPhone, and Android combined were used to make 61.7% of tweets). (pd.concat([grammys['tweet_source'].value_counts()[:15].rename('number'), grammys['tweet_source'].value_counts(normalize=True)[:15].mul(100).rename('percentage'), grammys['tweet_source'].value_counts(normalize=True)[:15].cumsum().mul(100).rename('cum_percentage')], axis=1) .reset_index() .rename(columns={'index': 'tweet_source'}))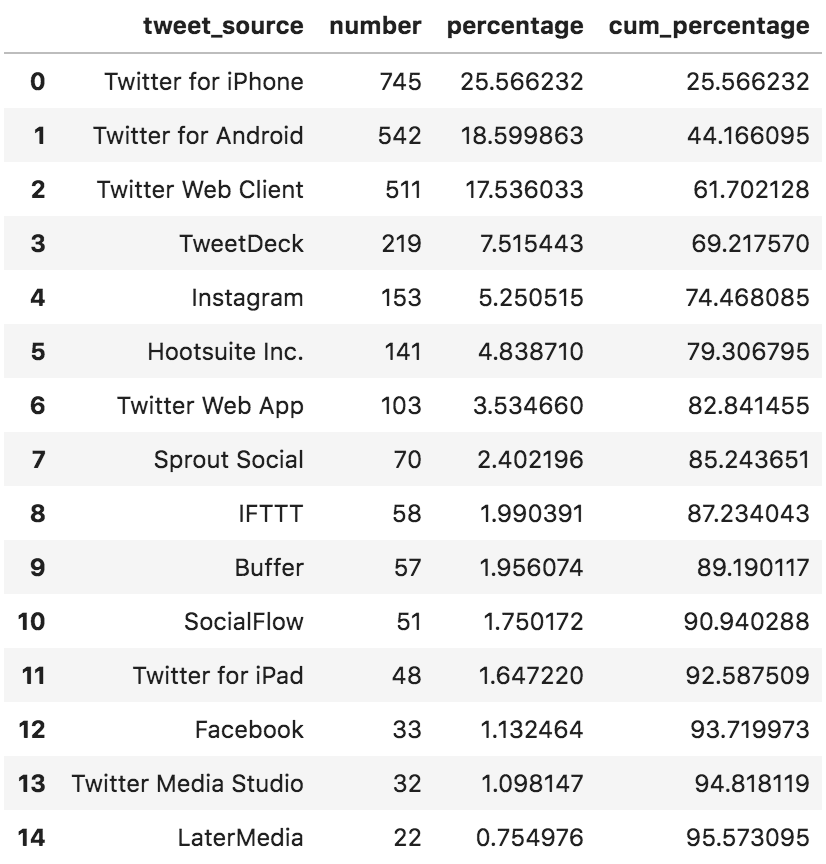 Applications used to publish tweets.
So, people are mostly tweeting with their phones; the iPhone app was used in 25.5% of the tweets, and Android in 18.6%. In case you didn't know, IFTTT (If This Then That on row 8) is an app that automates many things, which you can program to fire specific events when particular conditions are satisfied. So with Twitter, a user can probably retweet any tweet that is tweeted by an individual account and containing a specific hashtag for example. In our data set, fifty-eight tweets are from IFTTT, so these are automated tweets. TweetDeck and Hootsuite are used by people or agencies who run social media account professionally and need the scheduling and automation that they provide.
This information gives us some hints about how our users are tweeting, and might also provide some insights into the relative popularity of the apps themselves and what kind of accounts use them. There are more things that can be explored, but let's start extracting the entities and see what we can find.
Emoji
There are currently three "extract_" functions, which work pretty much the same way and produce almost the same output. extract_emoji, extract_hashtags, and extract_mentions all take a text list, and return a Python "dictionary". This dictionary is similar to a standard dictionary, in the sense that it has keys and values, in place of words and their meanings, respectively. To access the value of a particular key from the dictionary, you can use dictionary[key], and that gives you the value of the of the key saved in the dictionary. We will go through examples below to demonstrate this. (Note: This is technically not a correct description of the Python dictionary data structure, but just a way to think about it if you are not familiar with it.)
emoji_summary = adv.extract_emoji(grammys['tweet_full_text'])We create a variable emoji_summary, which is a Python dictionary. Let's quickly see what its keys are.
emoji_summary.keys()Emoji summary dictionary keys
We will now explore the most important ones.
emoji_summary['overview']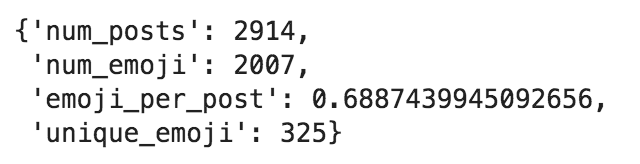 Emoji summary overview
The overview key contains a general summary of the emoji. As you can see, we have 2,914 posts, with 2007 occurrences of emoji. We have around 69% emoji per post, and the posts contain 325 unique emoji. The average is around 69%, but it is always useful to see how the data are distributed. We can have a better view of that by accessing the emoji_freq key — this shows how frequently the emoji were used in our tweets.
emoji_summary['emoji_freq']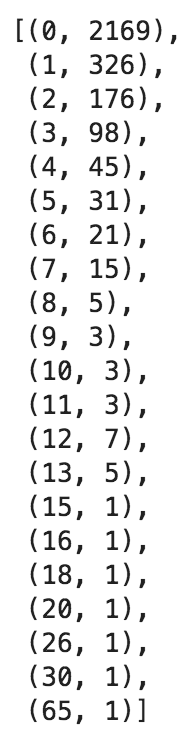 Emoji frequency: emoji per tweet
We have 2,169 tweets with zero emojis, 326 tweets with one emoji, and so on. Let's quickly visualize the above data.
fig, ax = plt.subplots(facecolor='#eeeeee') fig.set_size_inches((14, 6)) ax.set_frame_on(False) ax.bar([x[0] for x in emoji_summary['emoji_freq'][:15]], [x[1] for x in emoji_summary['emoji_freq'][:15]]) ax.tick_params(labelsize=14) ax.set_title('Emoji Frequency', fontsize=18) ax.set_xlabel('Emoji per tweet', fontsize=14) ax.set_ylabel('Number of emoji', fontsize=14) ax.grid() fig.savefig(ax.get_title() + '.png', facecolor='#eeeeee',dpi=120, bbox_inches='tight') plt.show()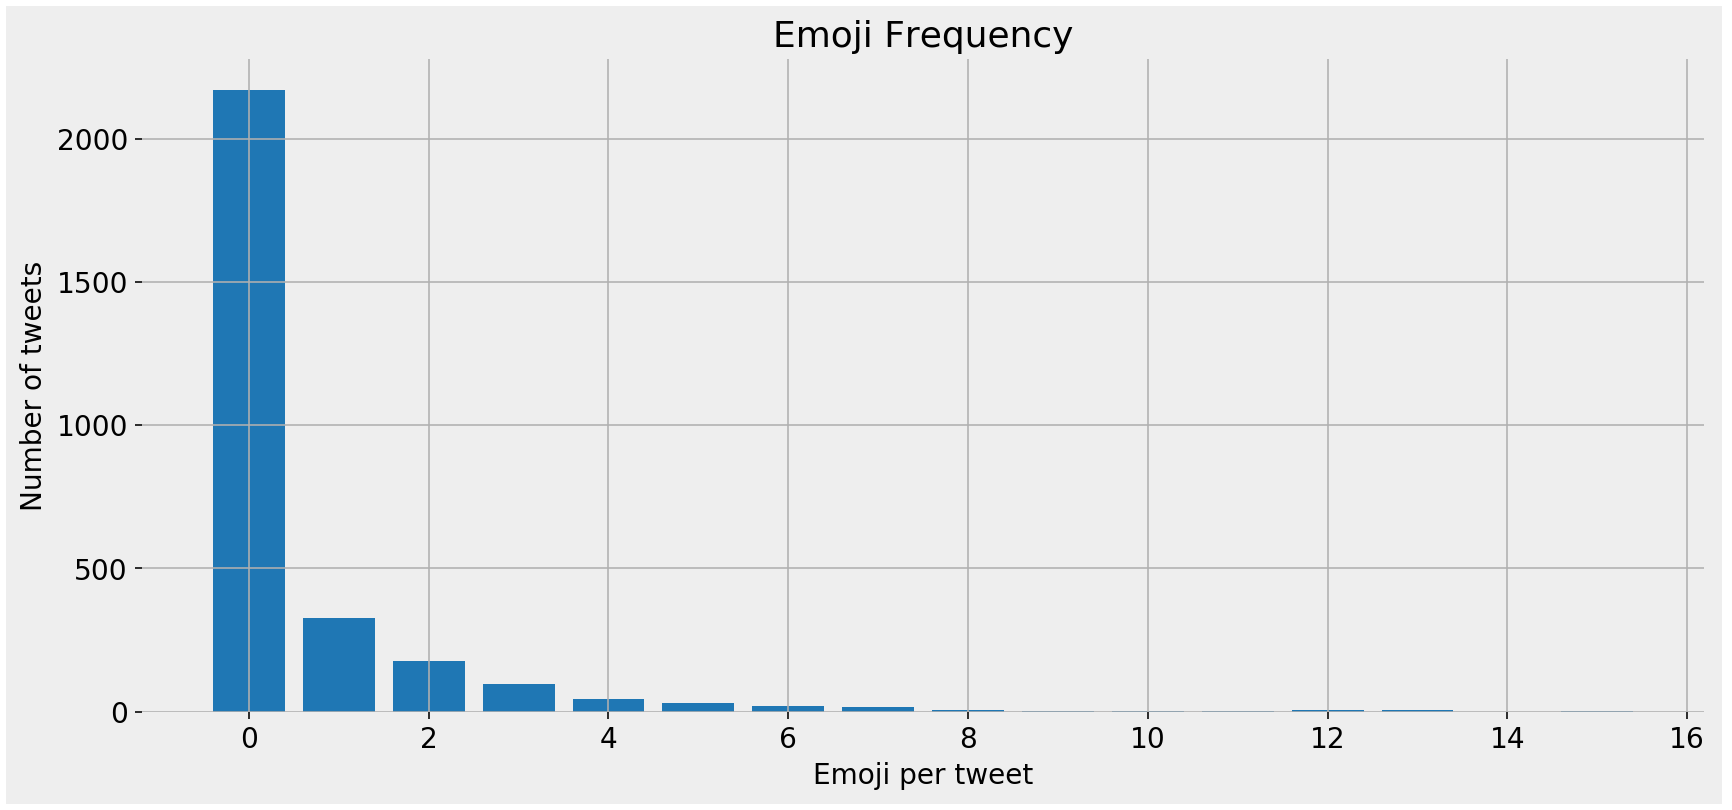 Emoji frequency - bar chart
You are probably wondering what the top emoji were. These can be extracted by accessing the top_emoji key.
emoji_summary['top_emoji'][:20]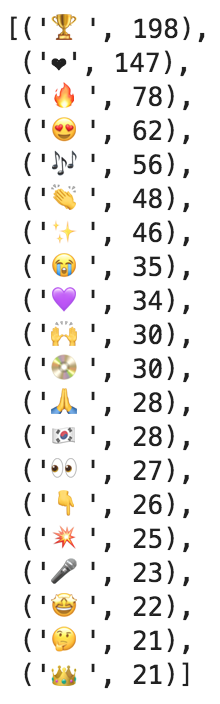 Top emoji
Here are the names of the top twenty emoji.
emoji_summary['top_emoji_text'][:20]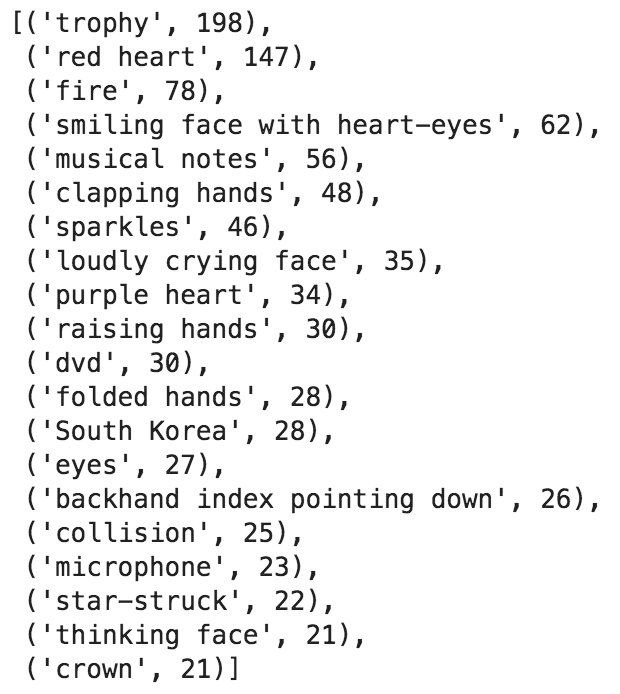 Top emoji names
There seems to be a bug somewhere, causing the red heart to appear as black. In tweets, it appears red, as you will see below. Now we simply combine the emoji with their textual representation together with their frequency.
for emoji, text in (zip([x[0] for x in emoji_summary['top_emoji'][:20]], emoji_summary['top_emoji_text'][:20], )): print(emoji,*text, sep='')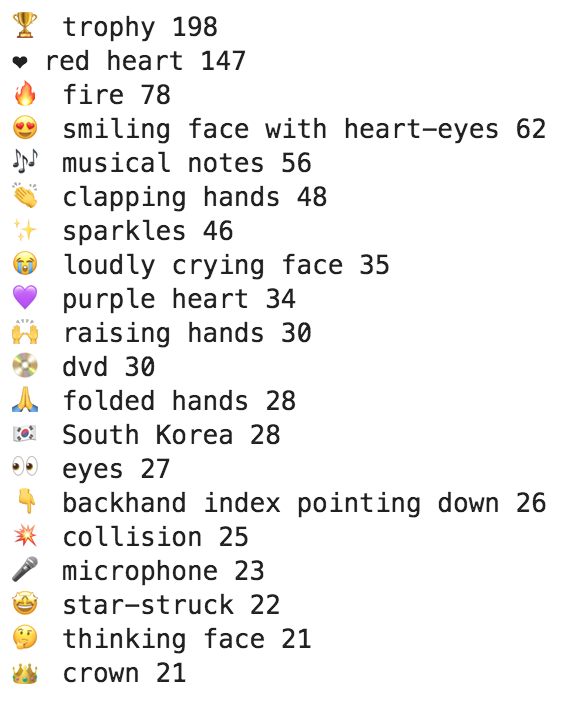 Top emoji characters, names, & frequency
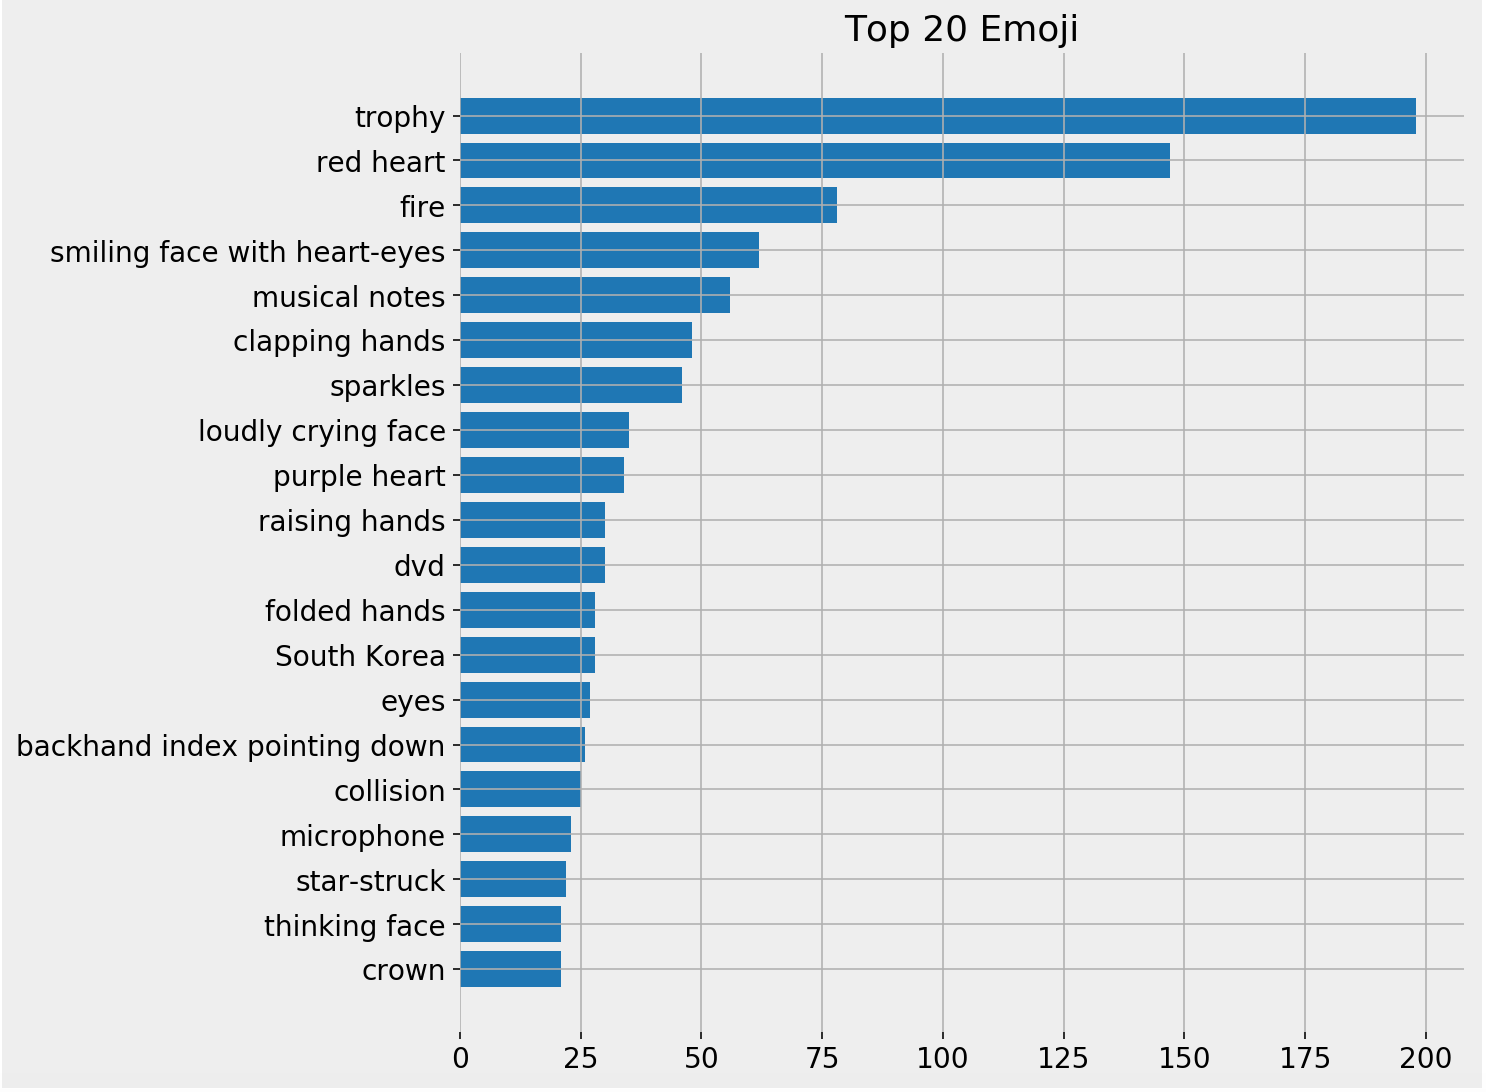 Top emoji bar chart
The trophy and red heart emojis seem to be by far the most used. Let's see how people are using them. Here are the tweets containing them.
[x for x in grammys[grammys['tweet_full_text'].str.contains('?')]['tweet_full_text']][:4]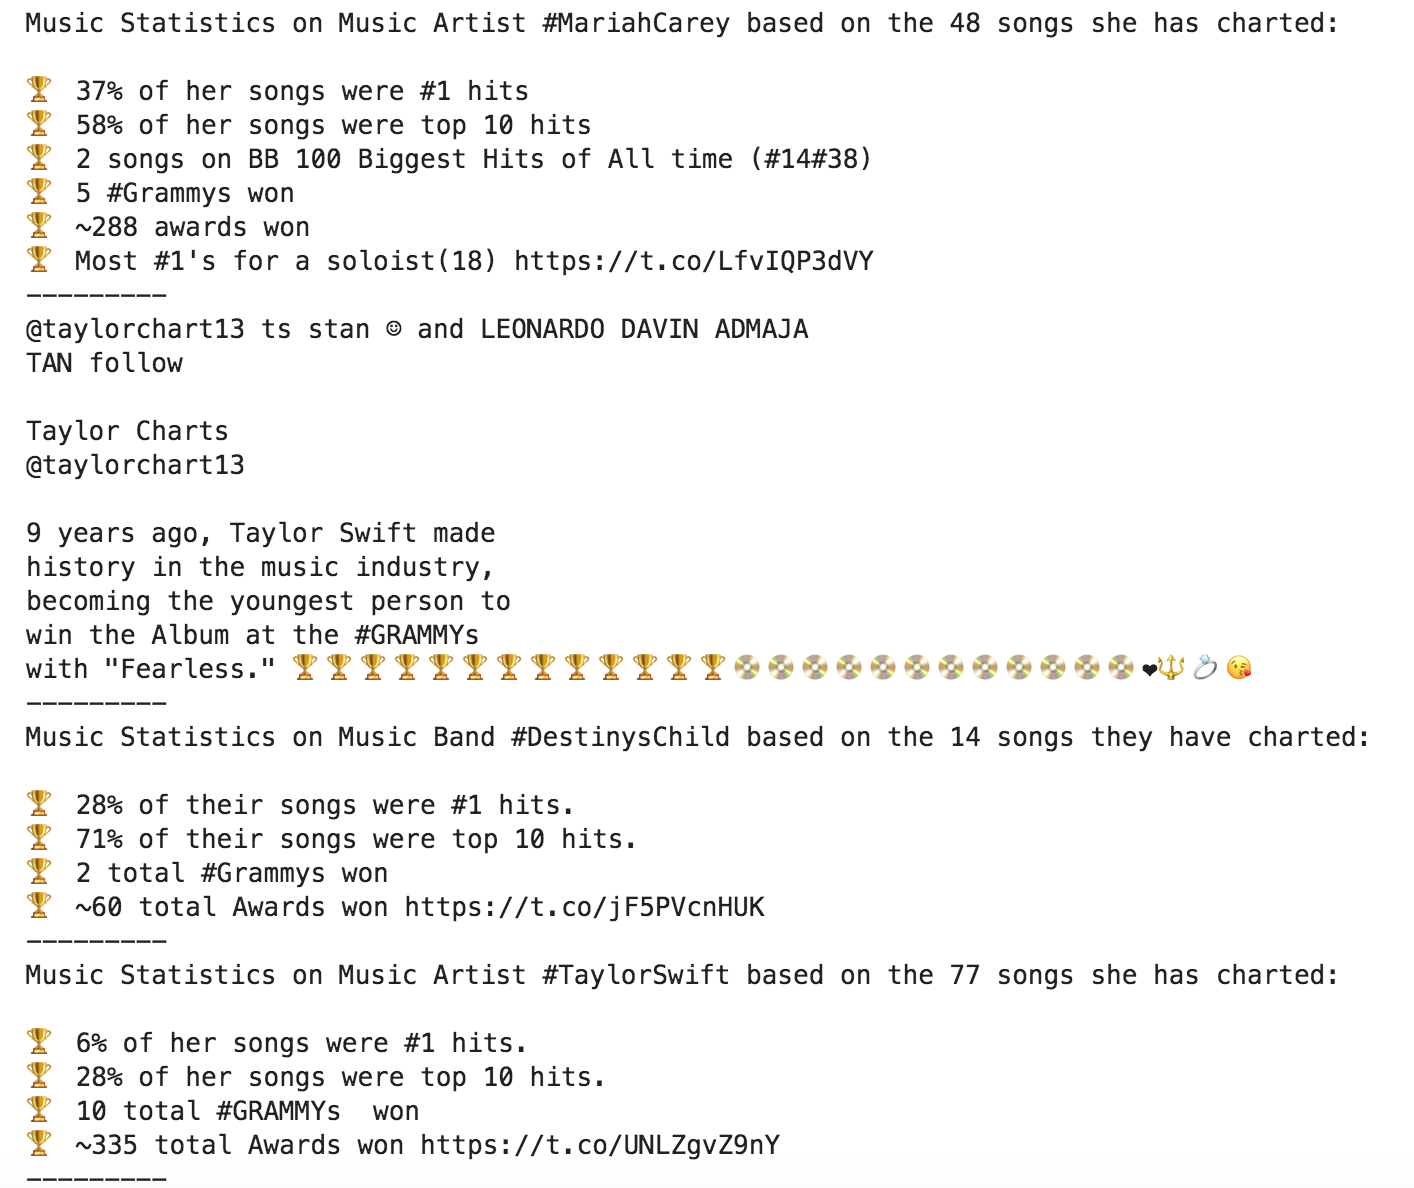 Tweets containing trophy emoji
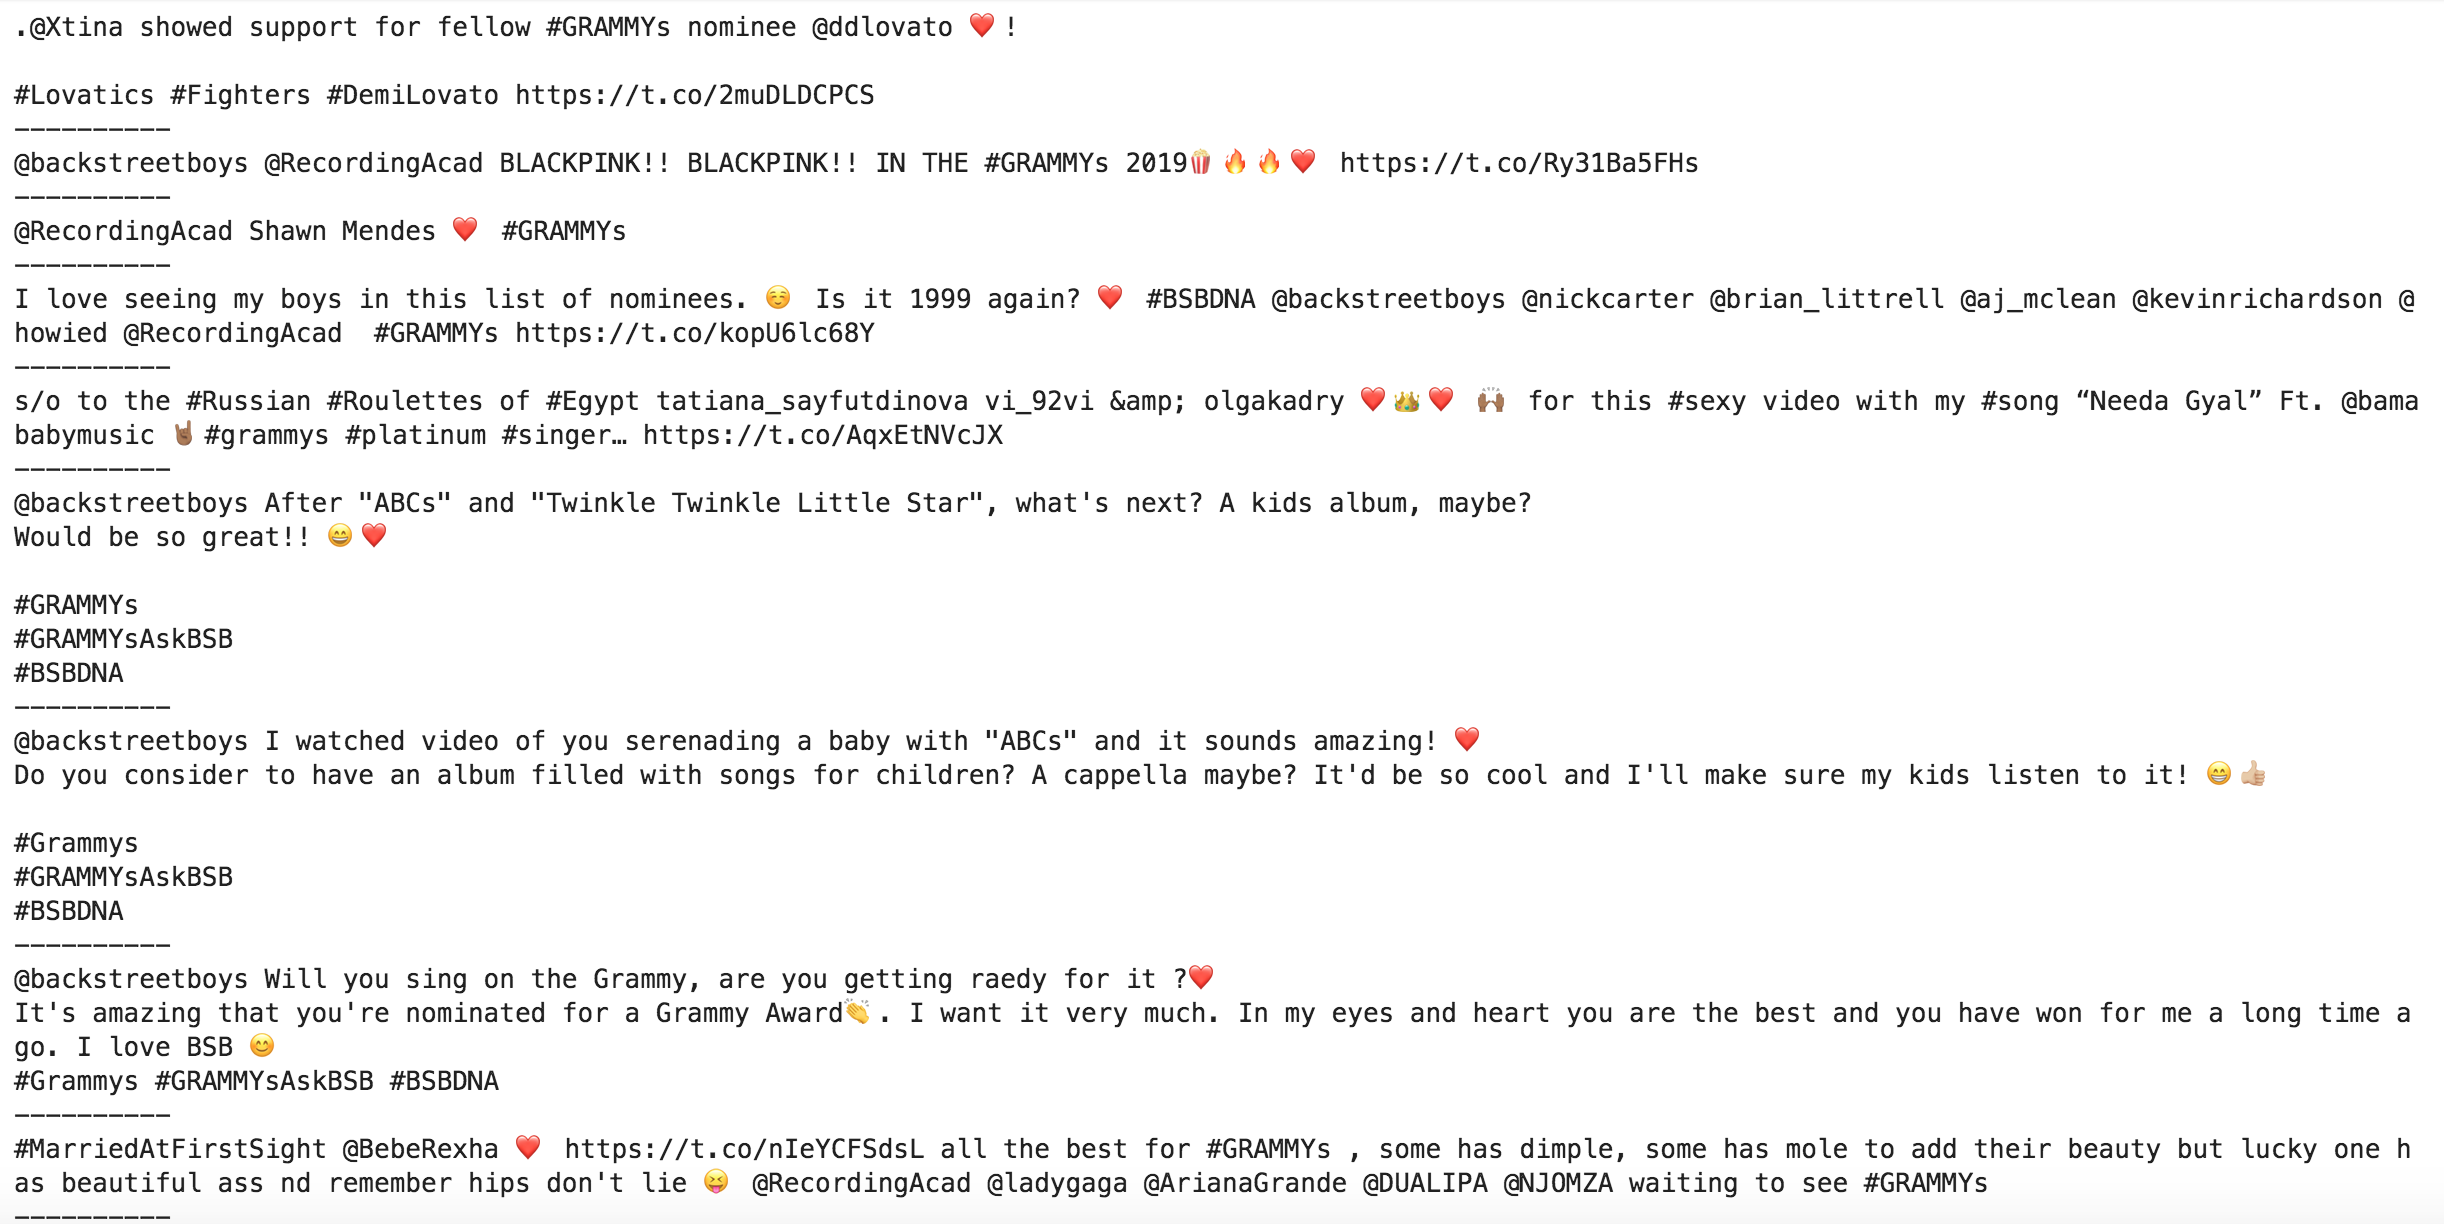 Tweets containing the heart emoji
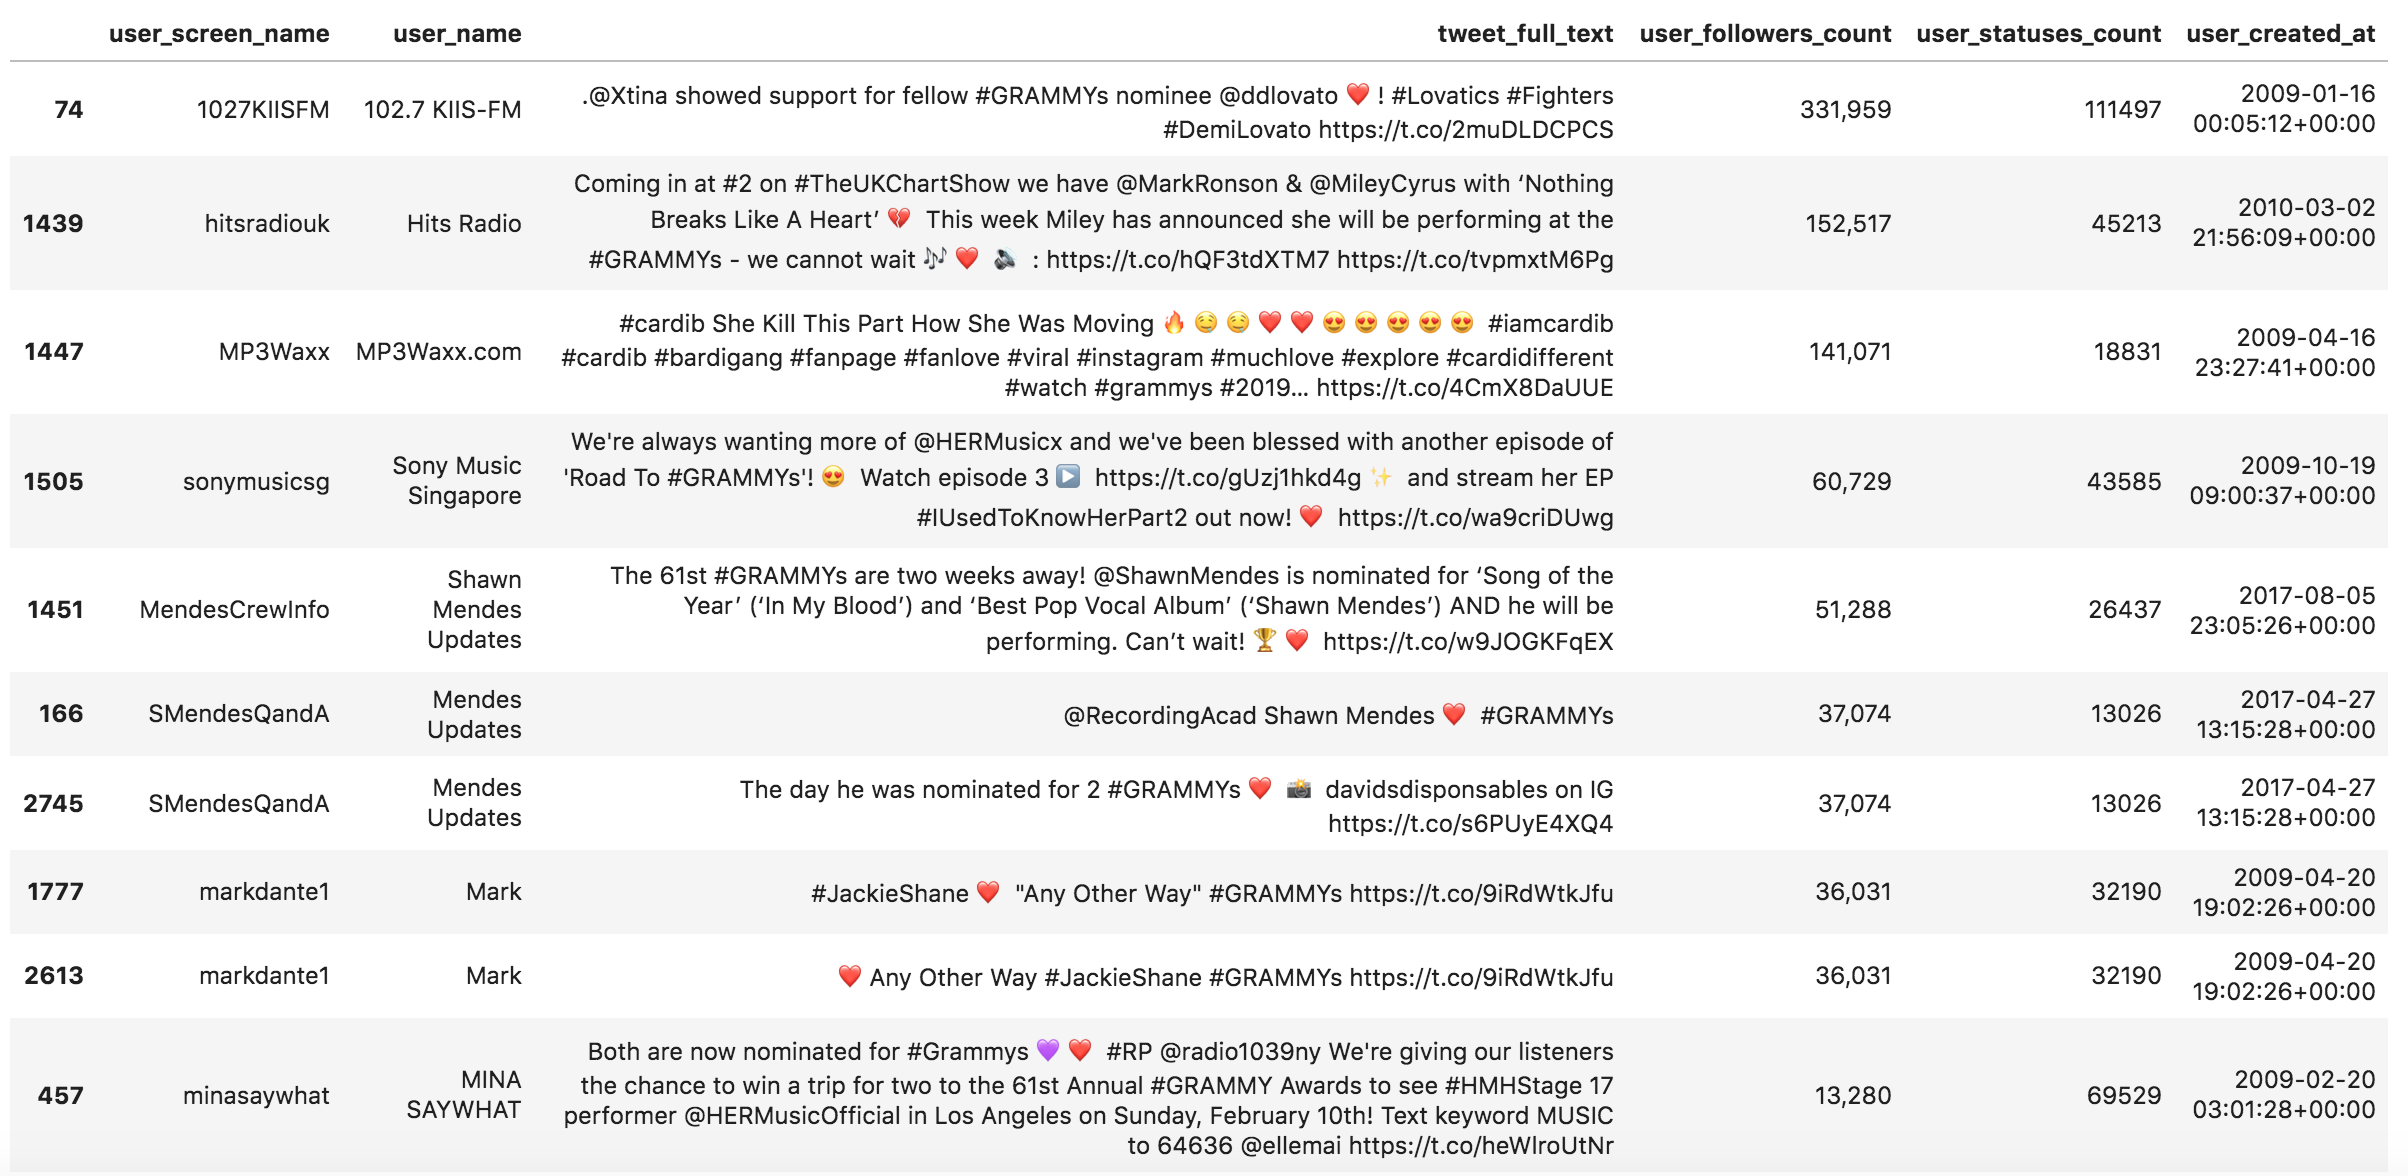
Let's learn a little more about the tweets and users who made those tweets. The following filters tweets containing the trophy sorts them in descending order and shows the top ten (sorted by the users' followers).
pd.set_option('display.max_colwidth', 280) (grammys[grammys['tweet_full_text'].str.count('?') > 0] [['user_screen_name', 'user_name', 'tweet_full_text', 'user_followers_count', 'user_statuses_count', 'user_created_at']] .sort_values('user_followers_count', ascending=False) .head(10) .style.format({'user_followers_count': '{:,}'}))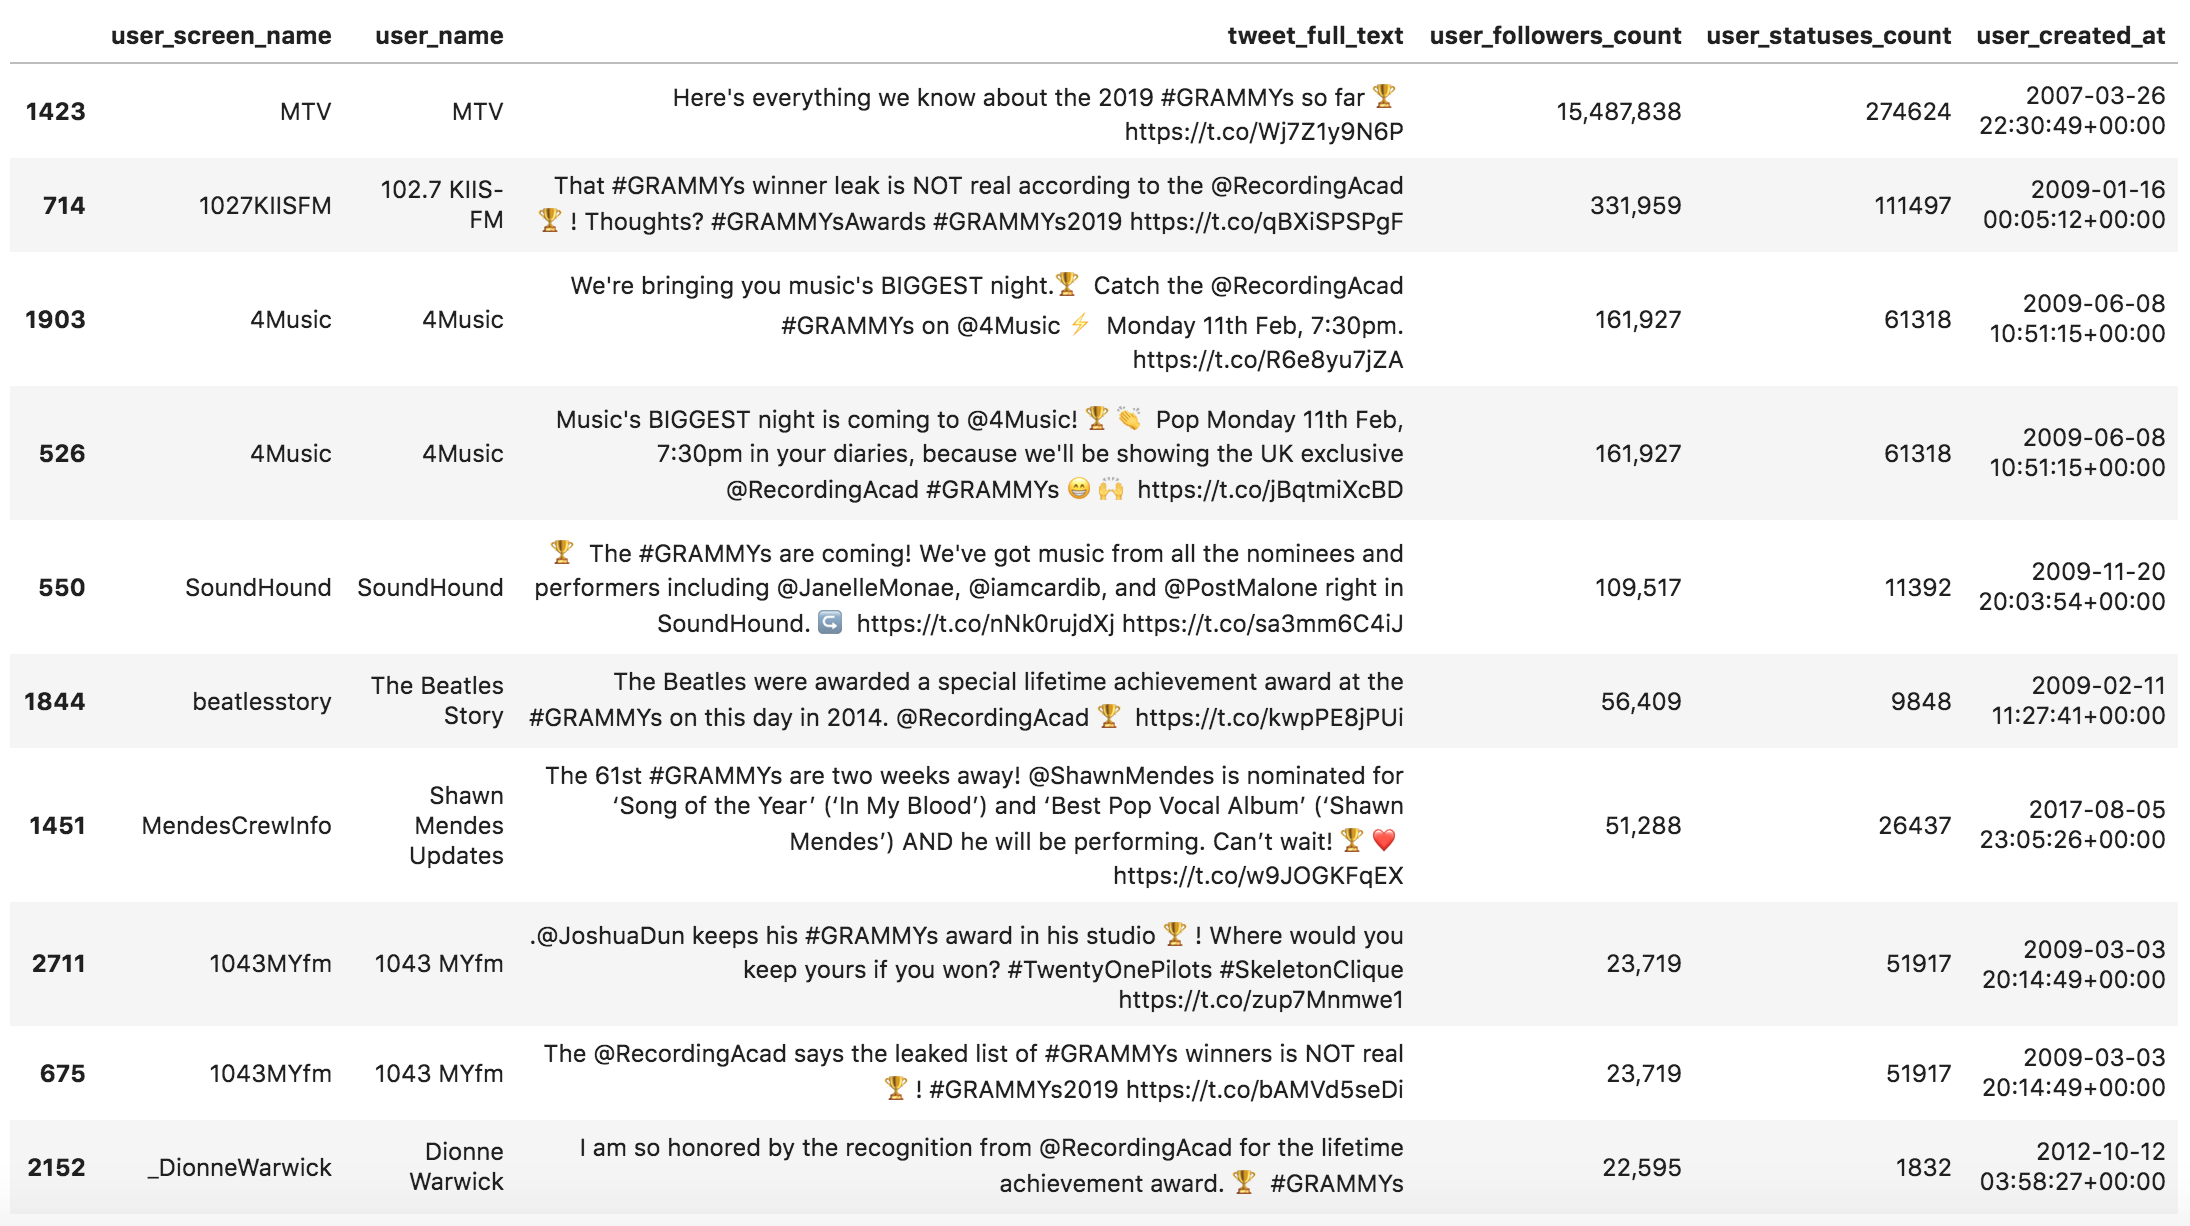 Tweets containing the trophy emoji with user data
 Tweets containing the heart emoji with user data
Hashtags
We do the same thing with hashtags.
hashtag_summary = adv.extract_hashtags(grammys['tweet_full_text'])hashtag_summary['overview']
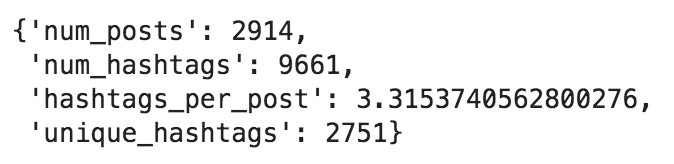 Hashtag summary overview
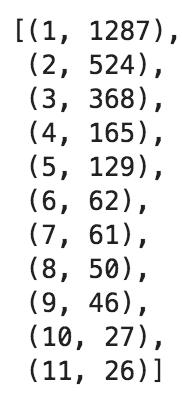 Hashtag frequency
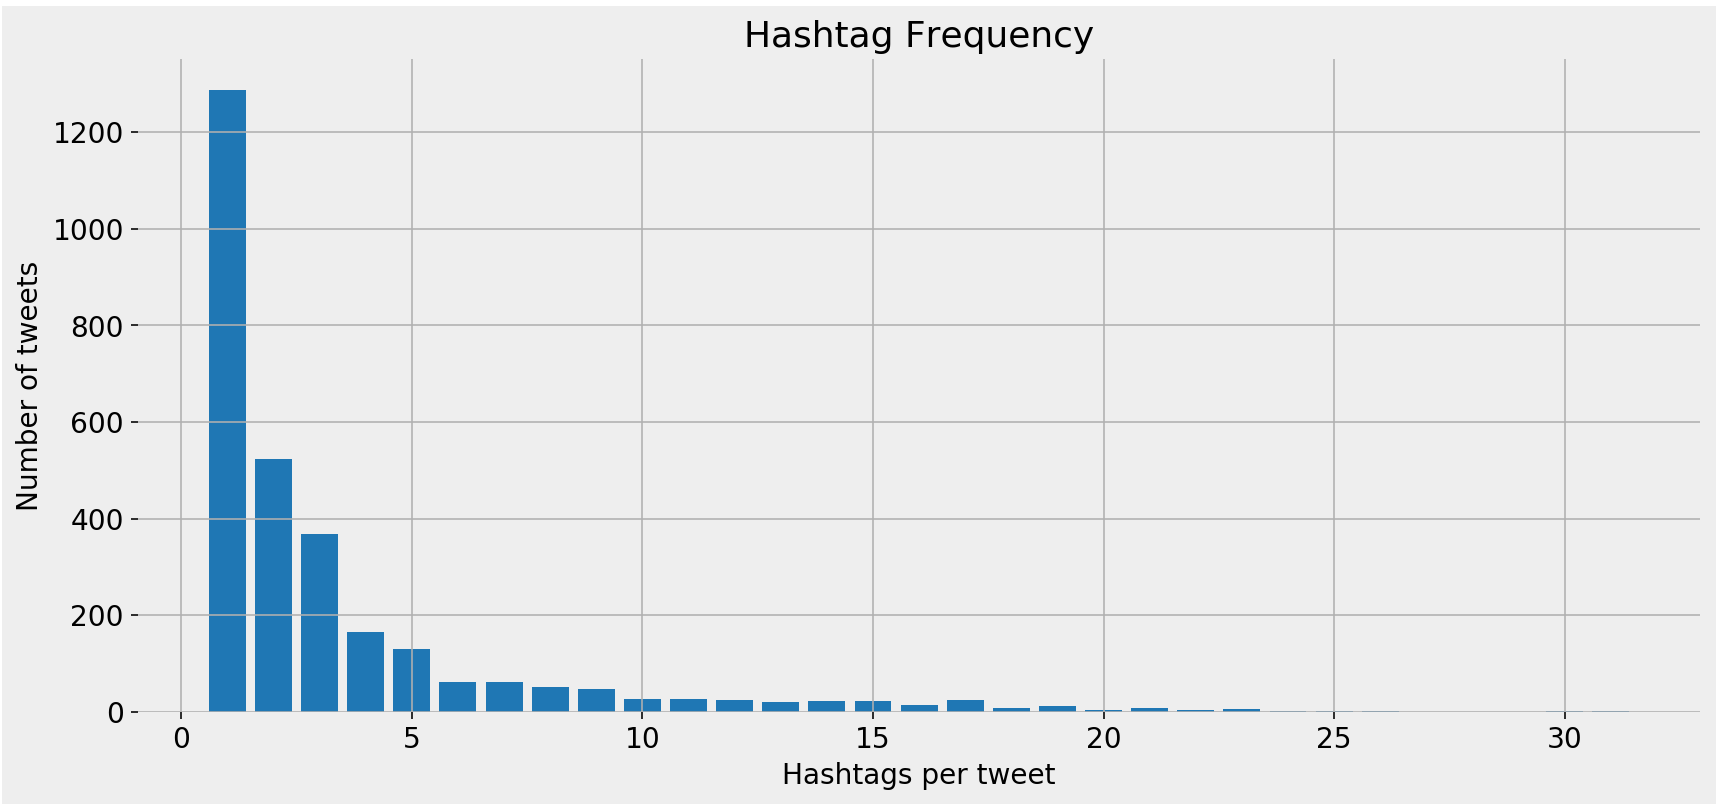 Hashtag frequency bar chart
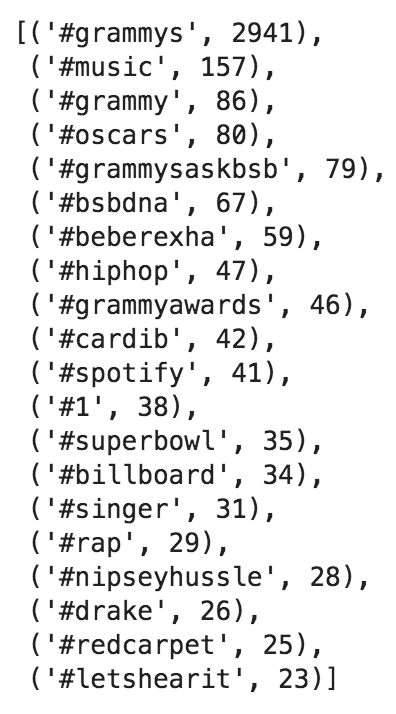 Top hashtags
I like to think of this as my own customized "Trending Now" list. Most of those would probably not be trending in a particular city or country, but because I am following a specific topic, it is useful for me to keep track of things this way. You might be wondering what #grammysaskbsb is. It seems the Grammys are allowing people to submit questions to celebrities. In this hashtag, it is for "bsb" which is the Backstreet Boys. Let's see who else they are doing this for. The following code selects the hashtags that contain "grammysask".
[(hashtag, count) for hashtag, count in hashtag_summary['top_hashtags'] if 'grammysask' in hashtag]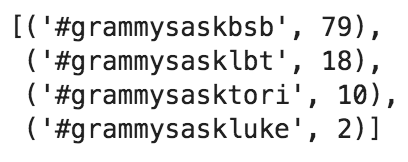 Hashtags containing "grammysask"
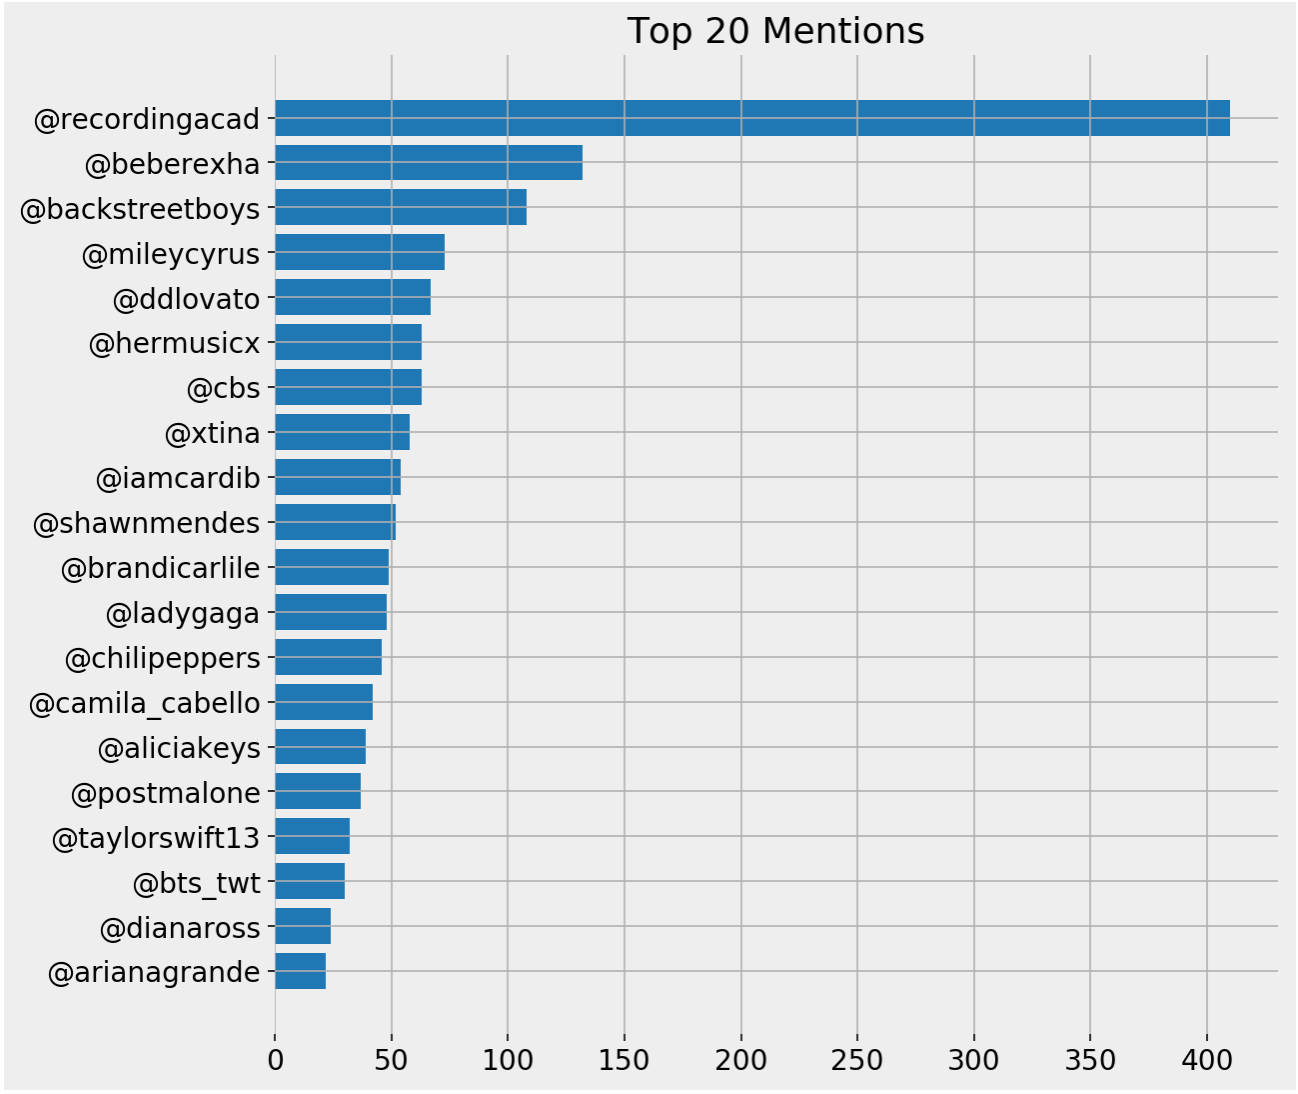
Here are the hashtags visualized, excluding #Grammys, since by definition, all tweets contain it.
fig, ax = plt.subplots(facecolor='#eeeeee') fig.set_size_inches((9, 9)) ax.set_frame_on(False) ax.barh([x[0] for x in hashtag_summary['top_hashtags'][1:21]][::-1], [x[1] for x in hashtag_summary['top_hashtags'][1:21]][::-1]) ax.tick_params(labelsize=14) ax.set_title('Top 20 Hashtags', fontsize=18) ax.text(0.5, .98, 'excluding #Grammys', transform=ax.transAxes, ha='center', fontsize=13) ax.grid() plt.show()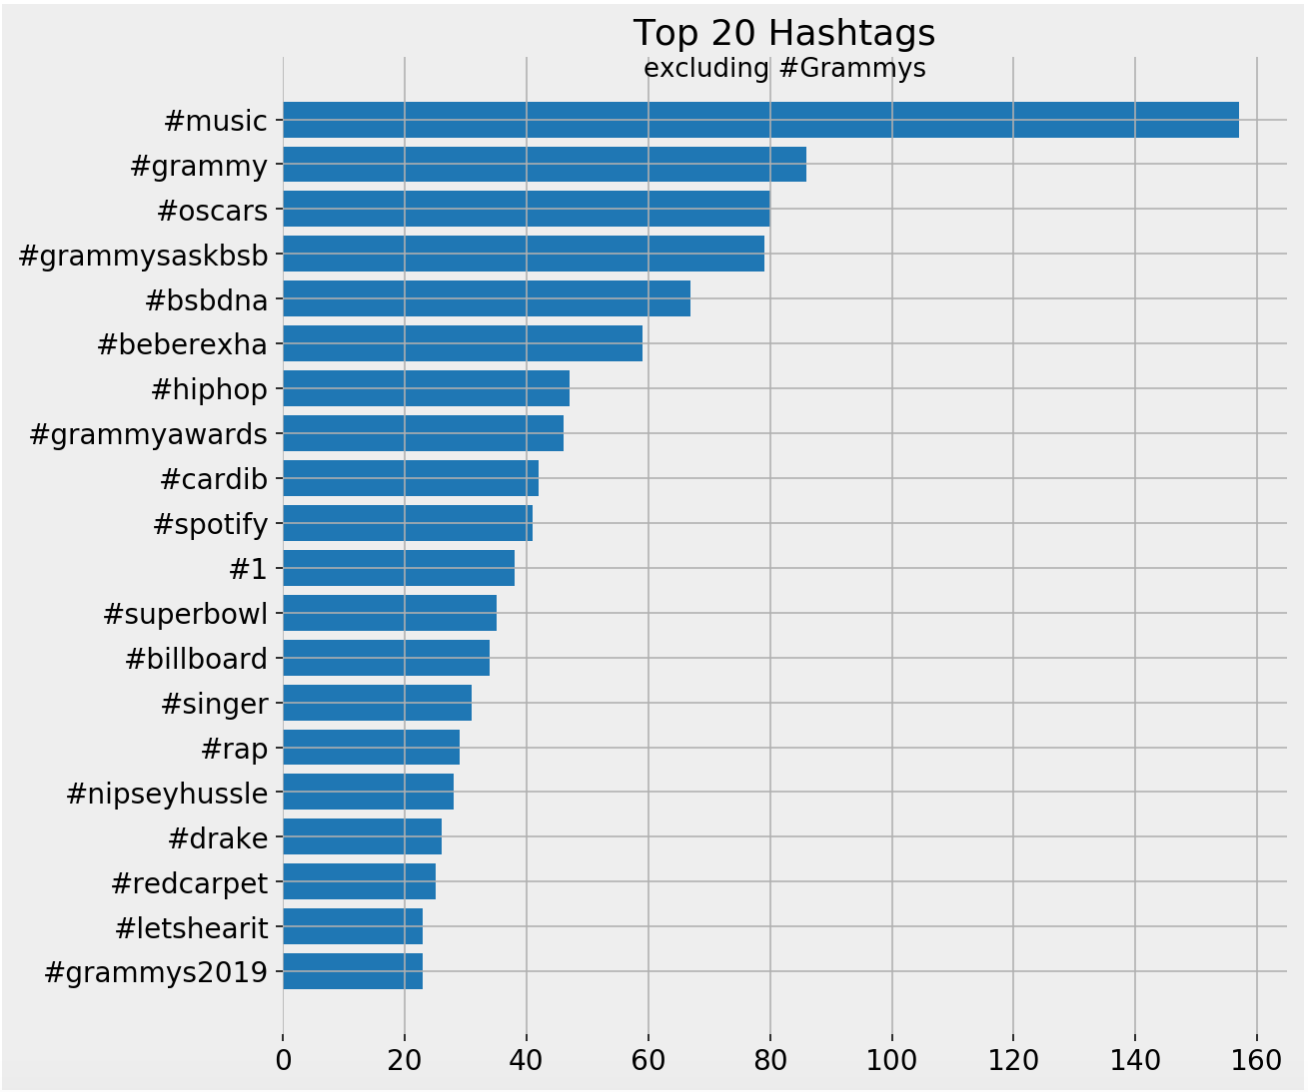 Top hashtags bar chart
It is interesting to see #oscars in the top hashtags. Let's look at the tweets containing it. Note that the code is pretty much the same as the one above, except that I changed the hashtag. So it is very easy to come up with your own filter and analyze another keyword or hashtag.
(grammys [grammys['tweet_full_text'].str.contains('#oscars', case=False)] [['user_screen_name', 'user_name', 'user_followers_count','tweet_full_text', 'user_verified']] .sort_values('user_followers_count', ascending=False) .head(20) .style.format({'user_followers_count': '{:,}'}))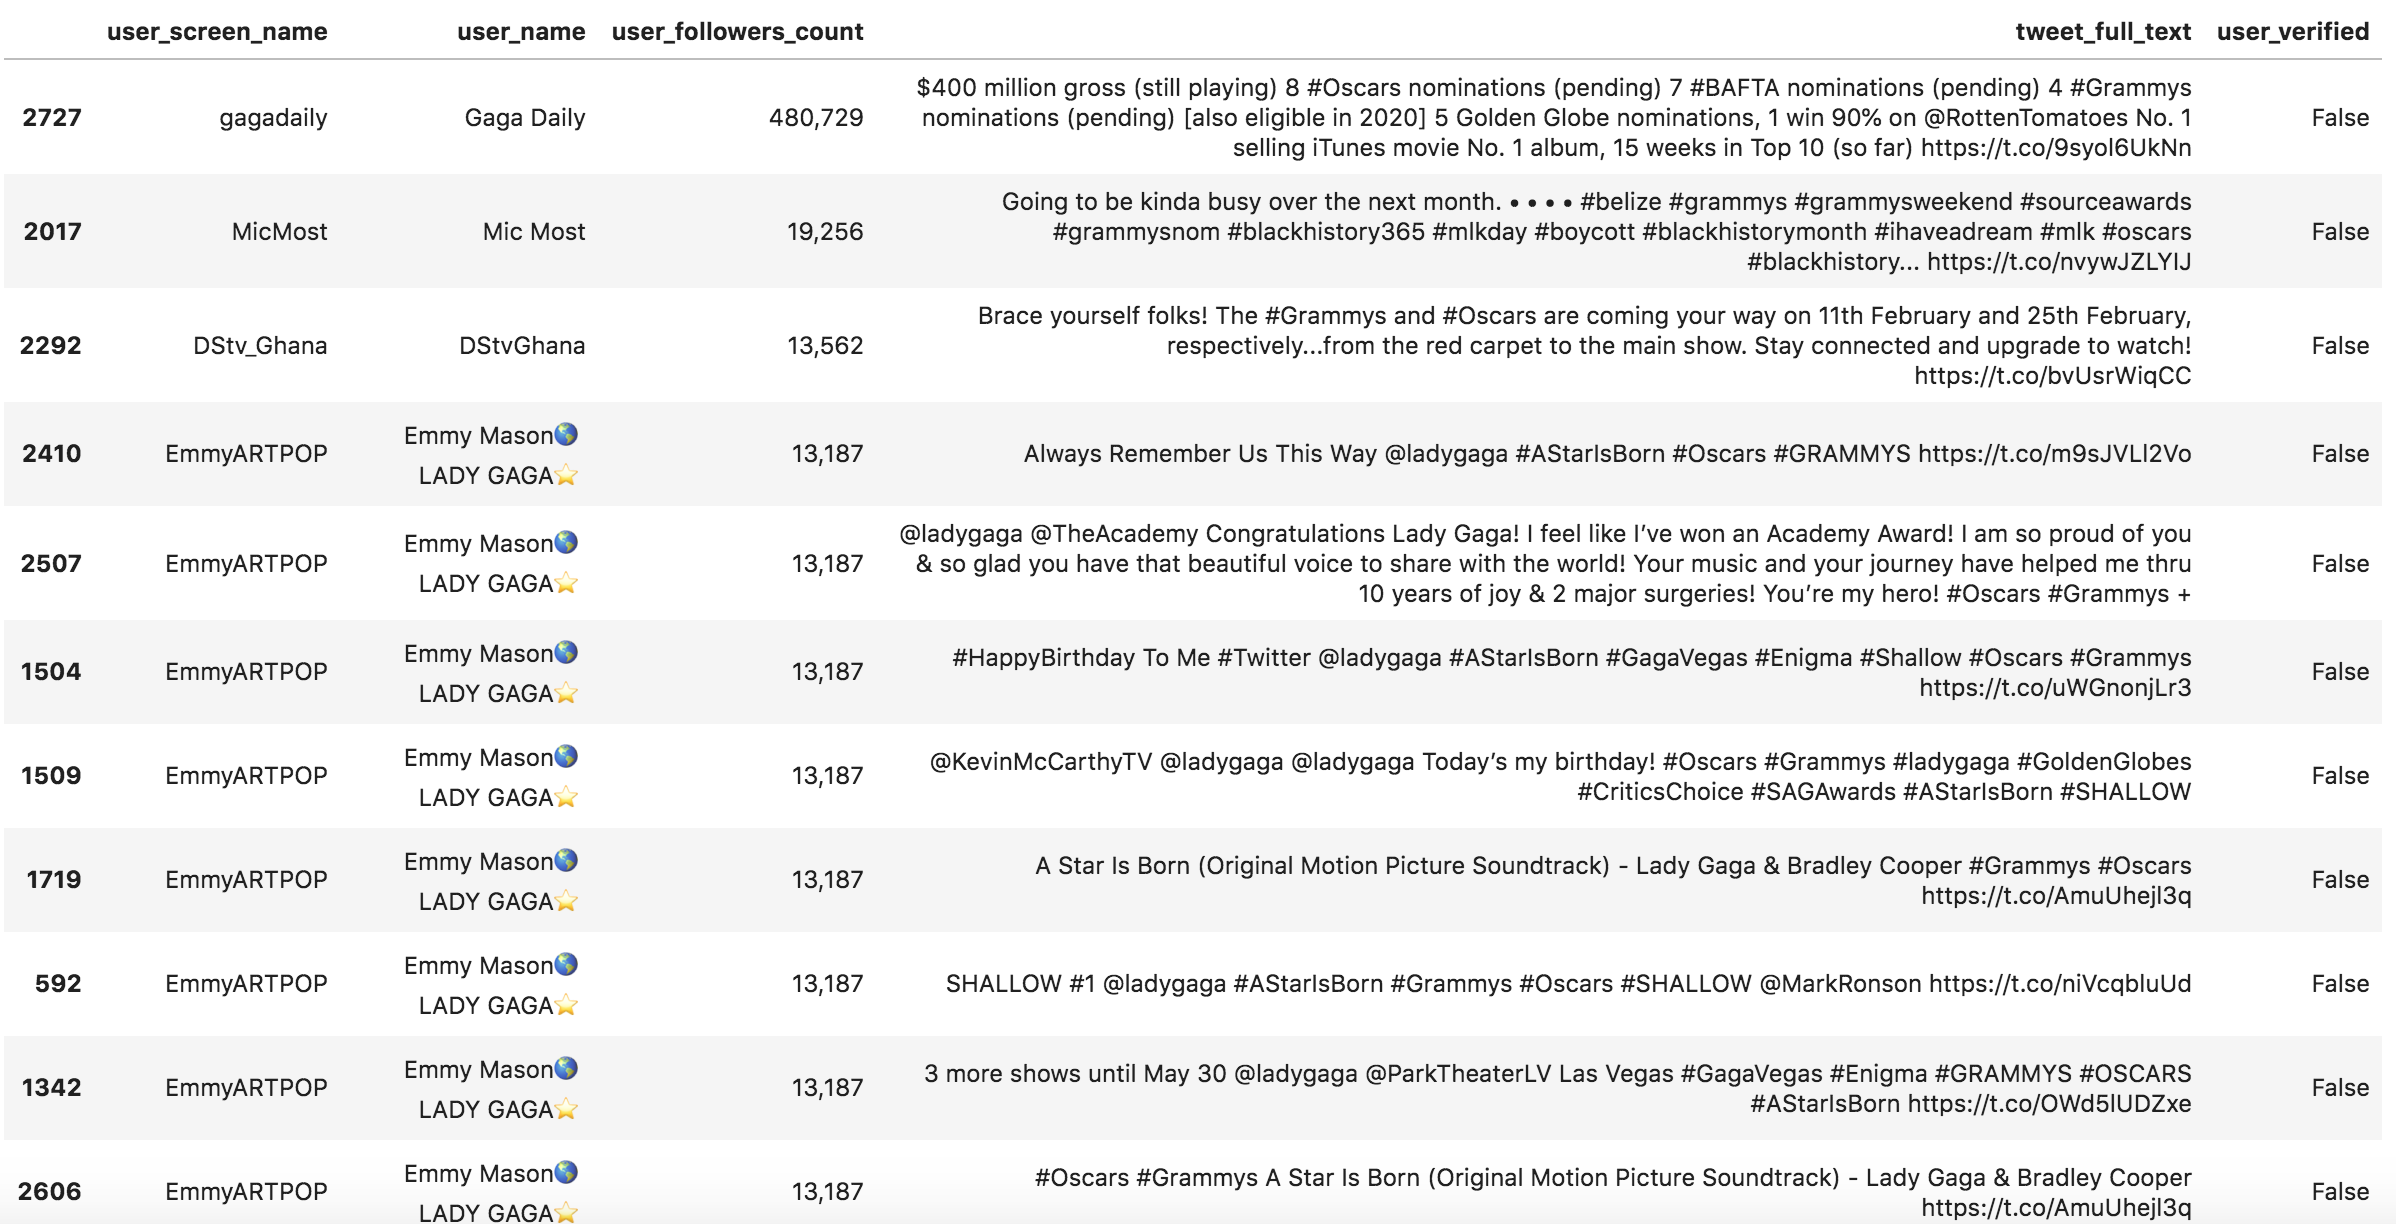 Tweets containing "#oscars"
So, one user has been tweeting a lot about the Oscars, and that is why it is so prominent.
Mentions
mention_summary = adv.extract_mentions(grammys['tweet_full_text'])mention_summary['overview']
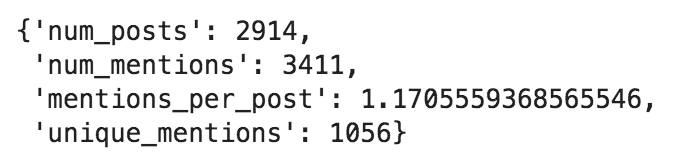 Mentions summary overview.
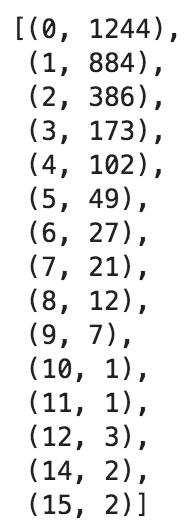 Mentions frequency
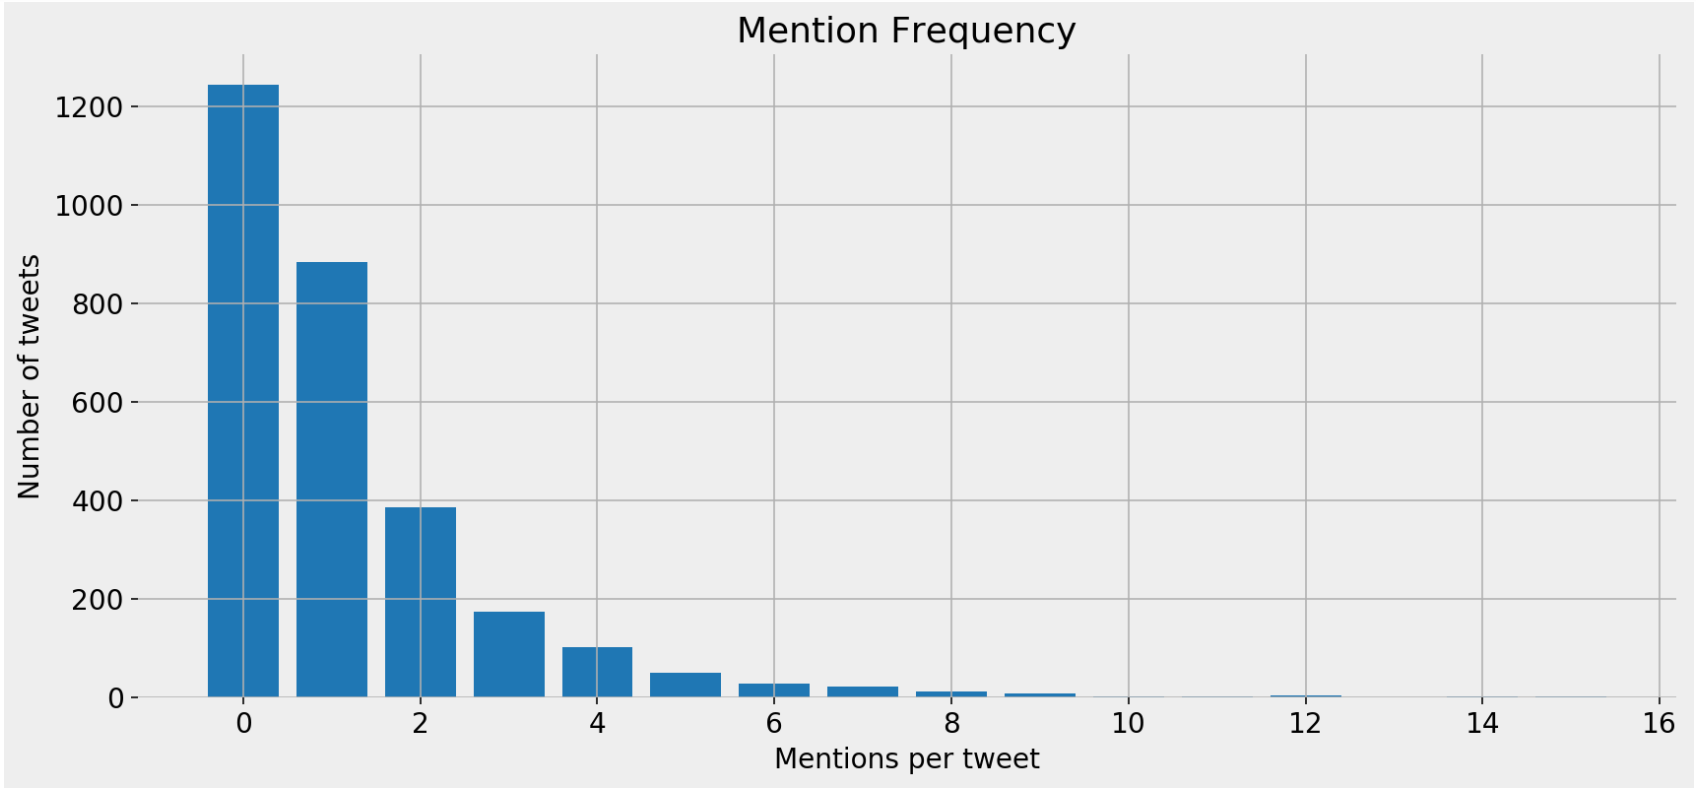 Mentions frequency bar chart
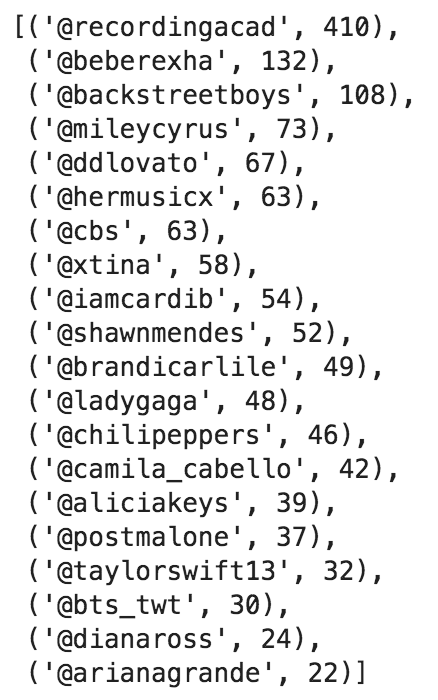 Top mentions
 Top mentions bar chart
It is expected to have the official account as one of the top mentioned accounts, and here are the top tweets that mention them.
(grammys [grammys['tweet_full_text'].str.contains('@recordingacad', case=False)] .sort_values('user_followers_count', ascending=False) [['user_followers_count', 'user_screen_name', 'tweet_full_text', 'user_verified']] .head(10) .style.format({'user_followers_count': '{:,}'}))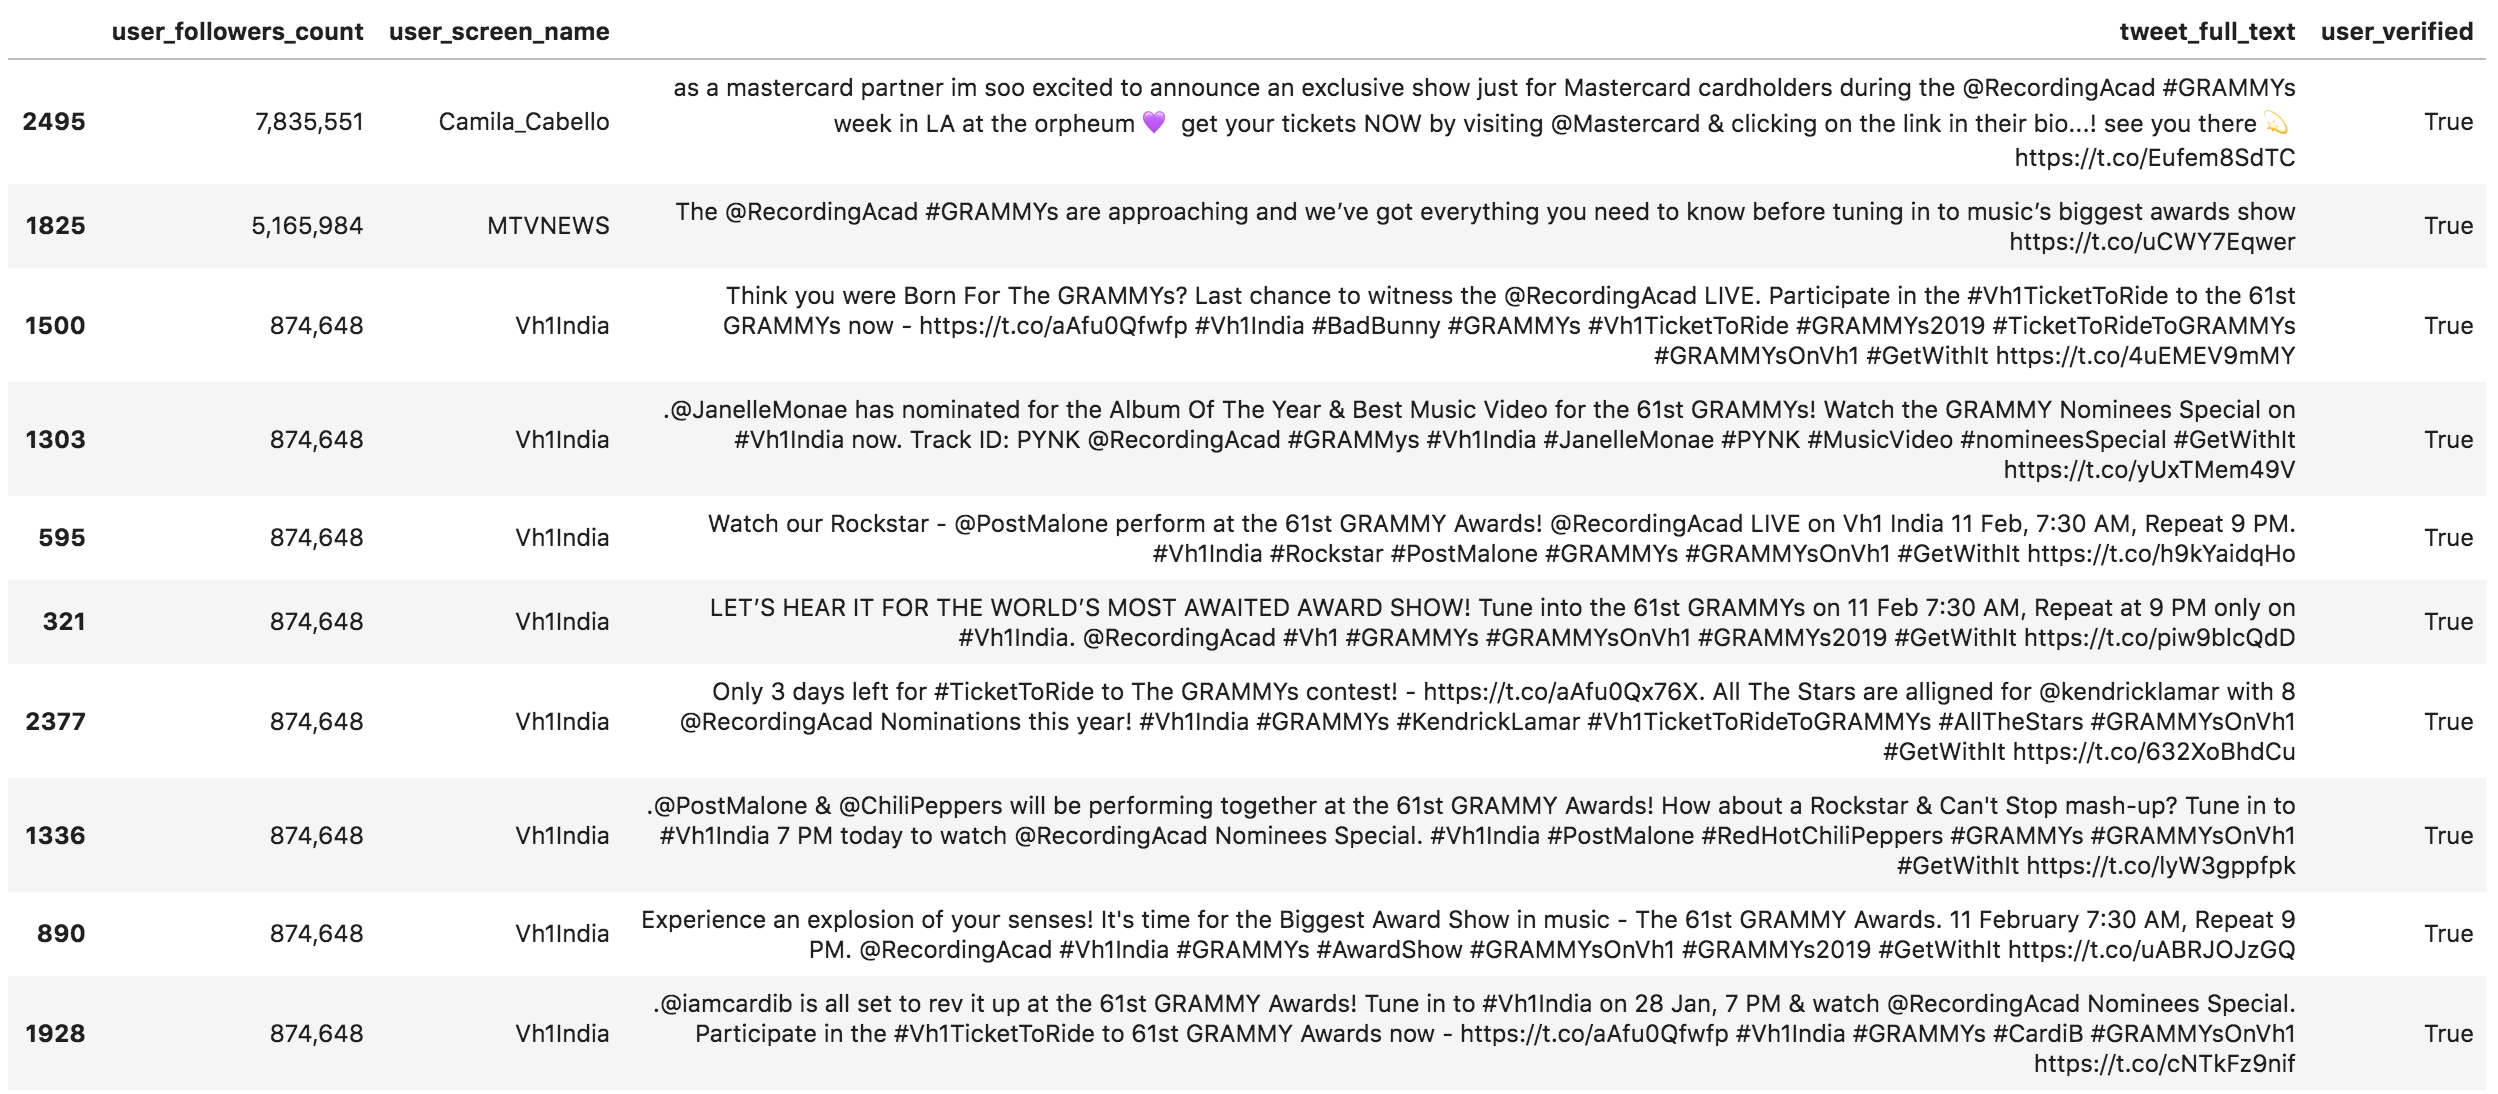 Tweets mentioning @recordingacad
Here are the tweets mentioning @BebeRexha, the second account
pd.set_option('display.max_colwidth', 280) (grammys [grammys['tweet_full_text'].str.contains('@beberexha', case=False)] .sort_values('user_followers_count', ascending=False) [['user_followers_count', 'user_screen_name', 'tweet_full_text']] .head(10) .style.format({'user_followers_count': '{:,}'}))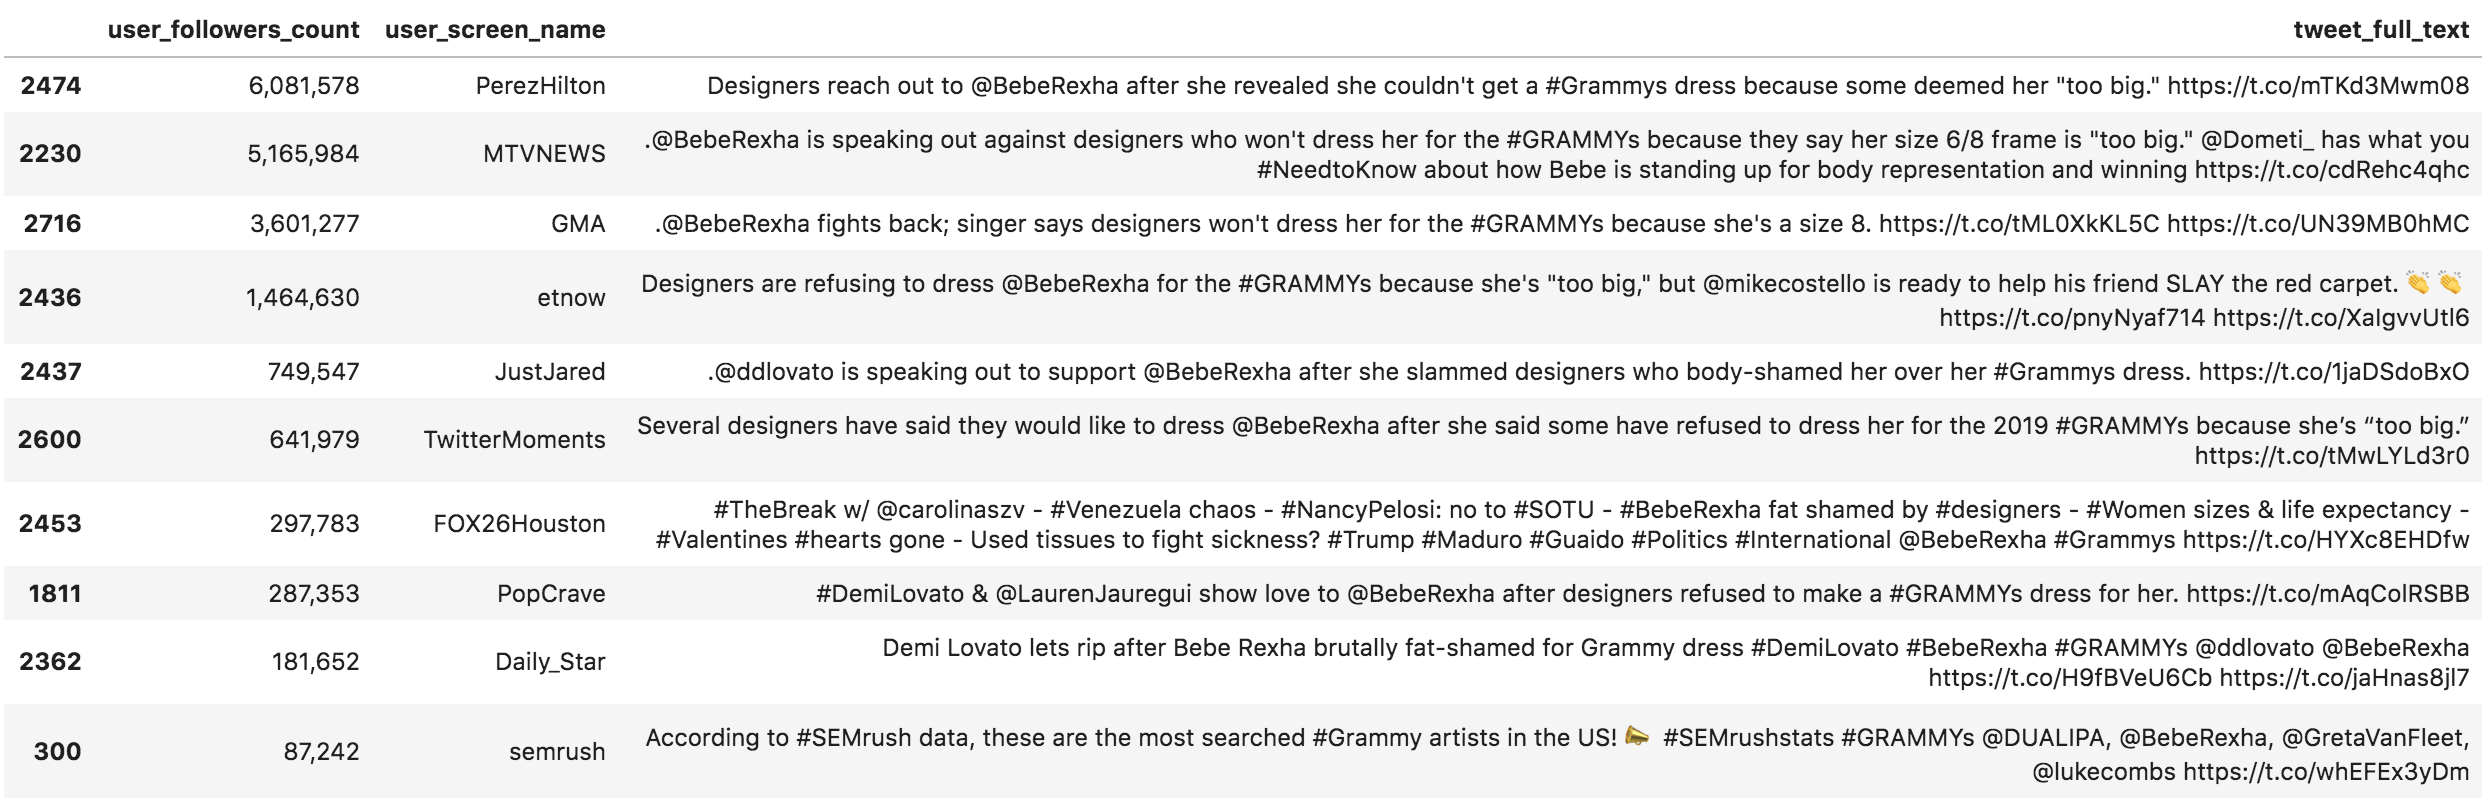 Tweets mentioning @beberexha
Now we can check the effect of the questions and answers on @BackstreetBoys.
(grammys [grammys['tweet_full_text'].str.contains('@backstreetboys', case=False)] .sort_values('user_followers_count', ascending=False) [['user_followers_count', 'user_screen_name', 'tweet_full_text']] .head(10) .style.format({'user_followers_count': '{:,}'}))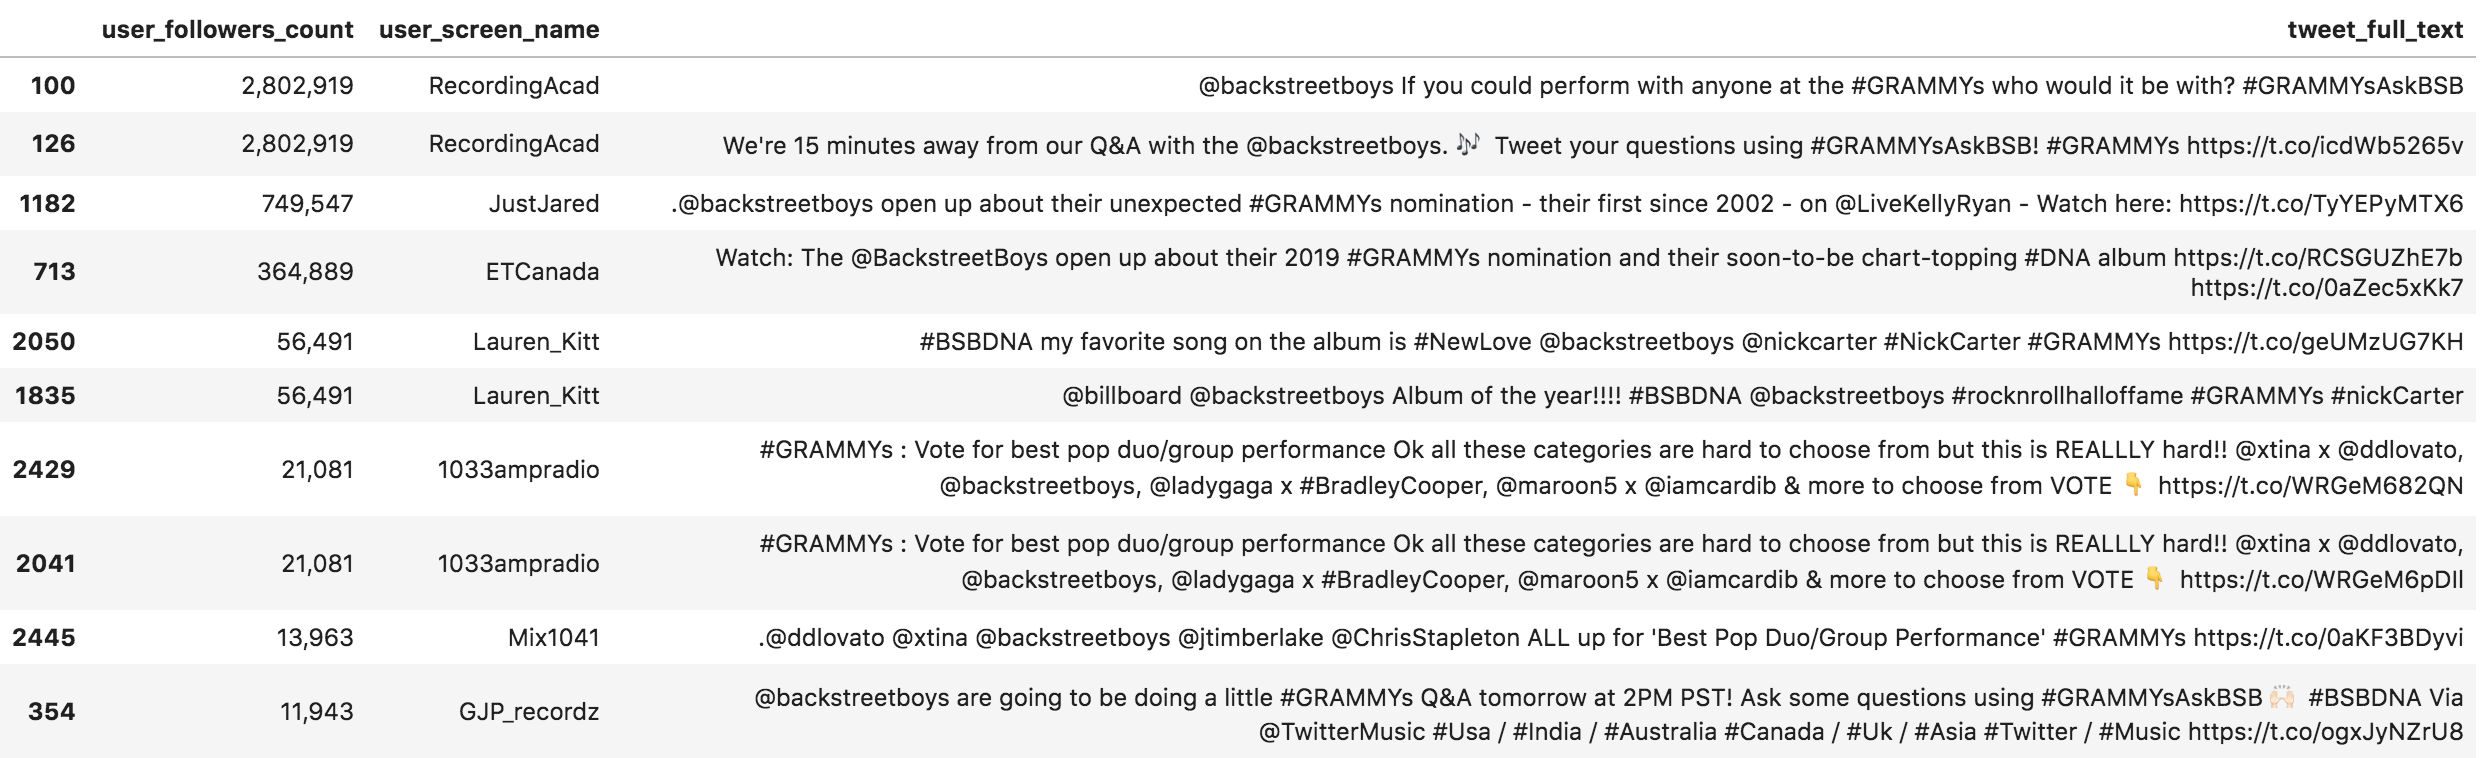 Tweets mentioning @backstreetboys
Word Frequency
Now let's start counting the words and try to see what were the most used words on an absolute and a weighted count basis. The word_frequency function takes a text list and a number list as its main arguments. It excludes a list of English stop-words by default, which is a list that you can modify as you like. Advertools provides lists of stop-words in several other languages, in case you are working in a language other than English. As you can see below, I have used the default set of English stop-words and added my own.
word_freq = adv.word_frequency(grammys['tweet_full_text'], grammys['user_followers_count'], rm_words=adv.stopwords['english'] + [ '&',]) word_freq.head(20).style.format({'wtd_freq': '{:,}', 'rel_value': '{:,}'})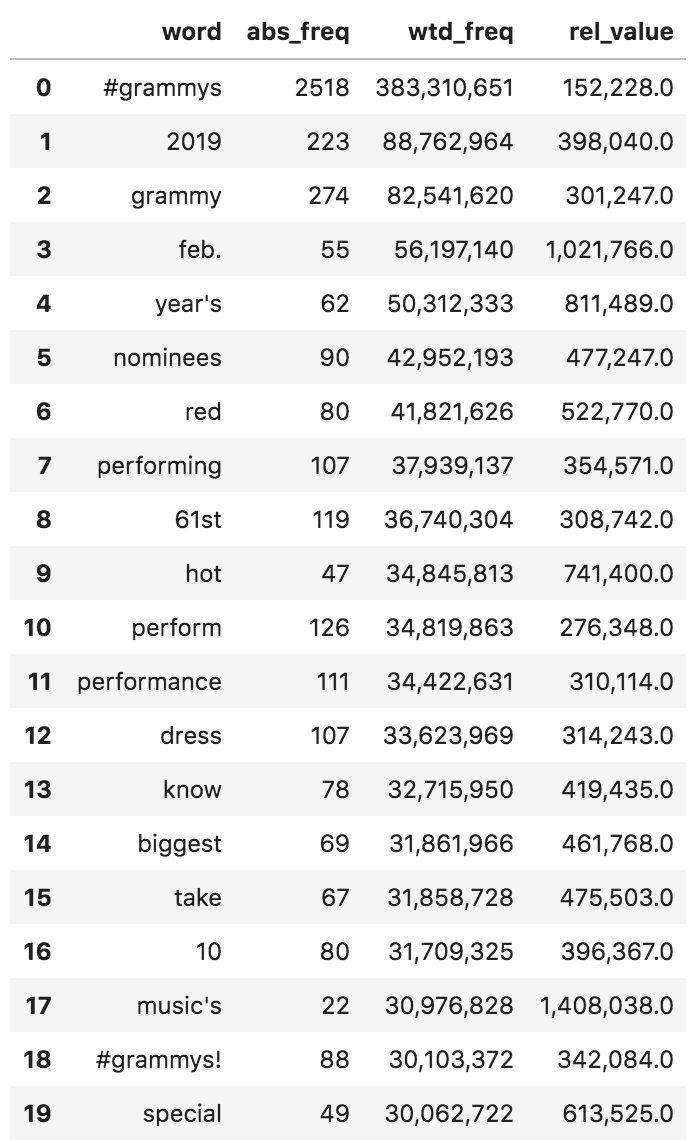 Word frequency - Grammys tweets
You can see that the most used words are not necessarily the same when weighted by the number of followers. In some cases, like the top three, these words are the most frequent on both measures. In general, these are not interesting because we already expect a conversation about the Grammys to include such words. Evaluating each occurrence of a word is done by the last column rel_value, which basically divides the weighted by the absolute frequency, to come up with a per-occurrence value of each word. In this case "music's" and "Feb." have very high relative values. The first six words are expected, but "red" seems interesting. Let's see what people have to say.
(grammys [grammys['tweet_full_text'] .str.contains(' red ', case=False)] .sort_values('user_followers_count') [['user_screen_name', 'user_name', 'user_followers_count', 'tweet_full_text']] .sort_values('user_followers_count', ascending=False) .head(10) .style.format({'user_followers_count': '{:,}'}))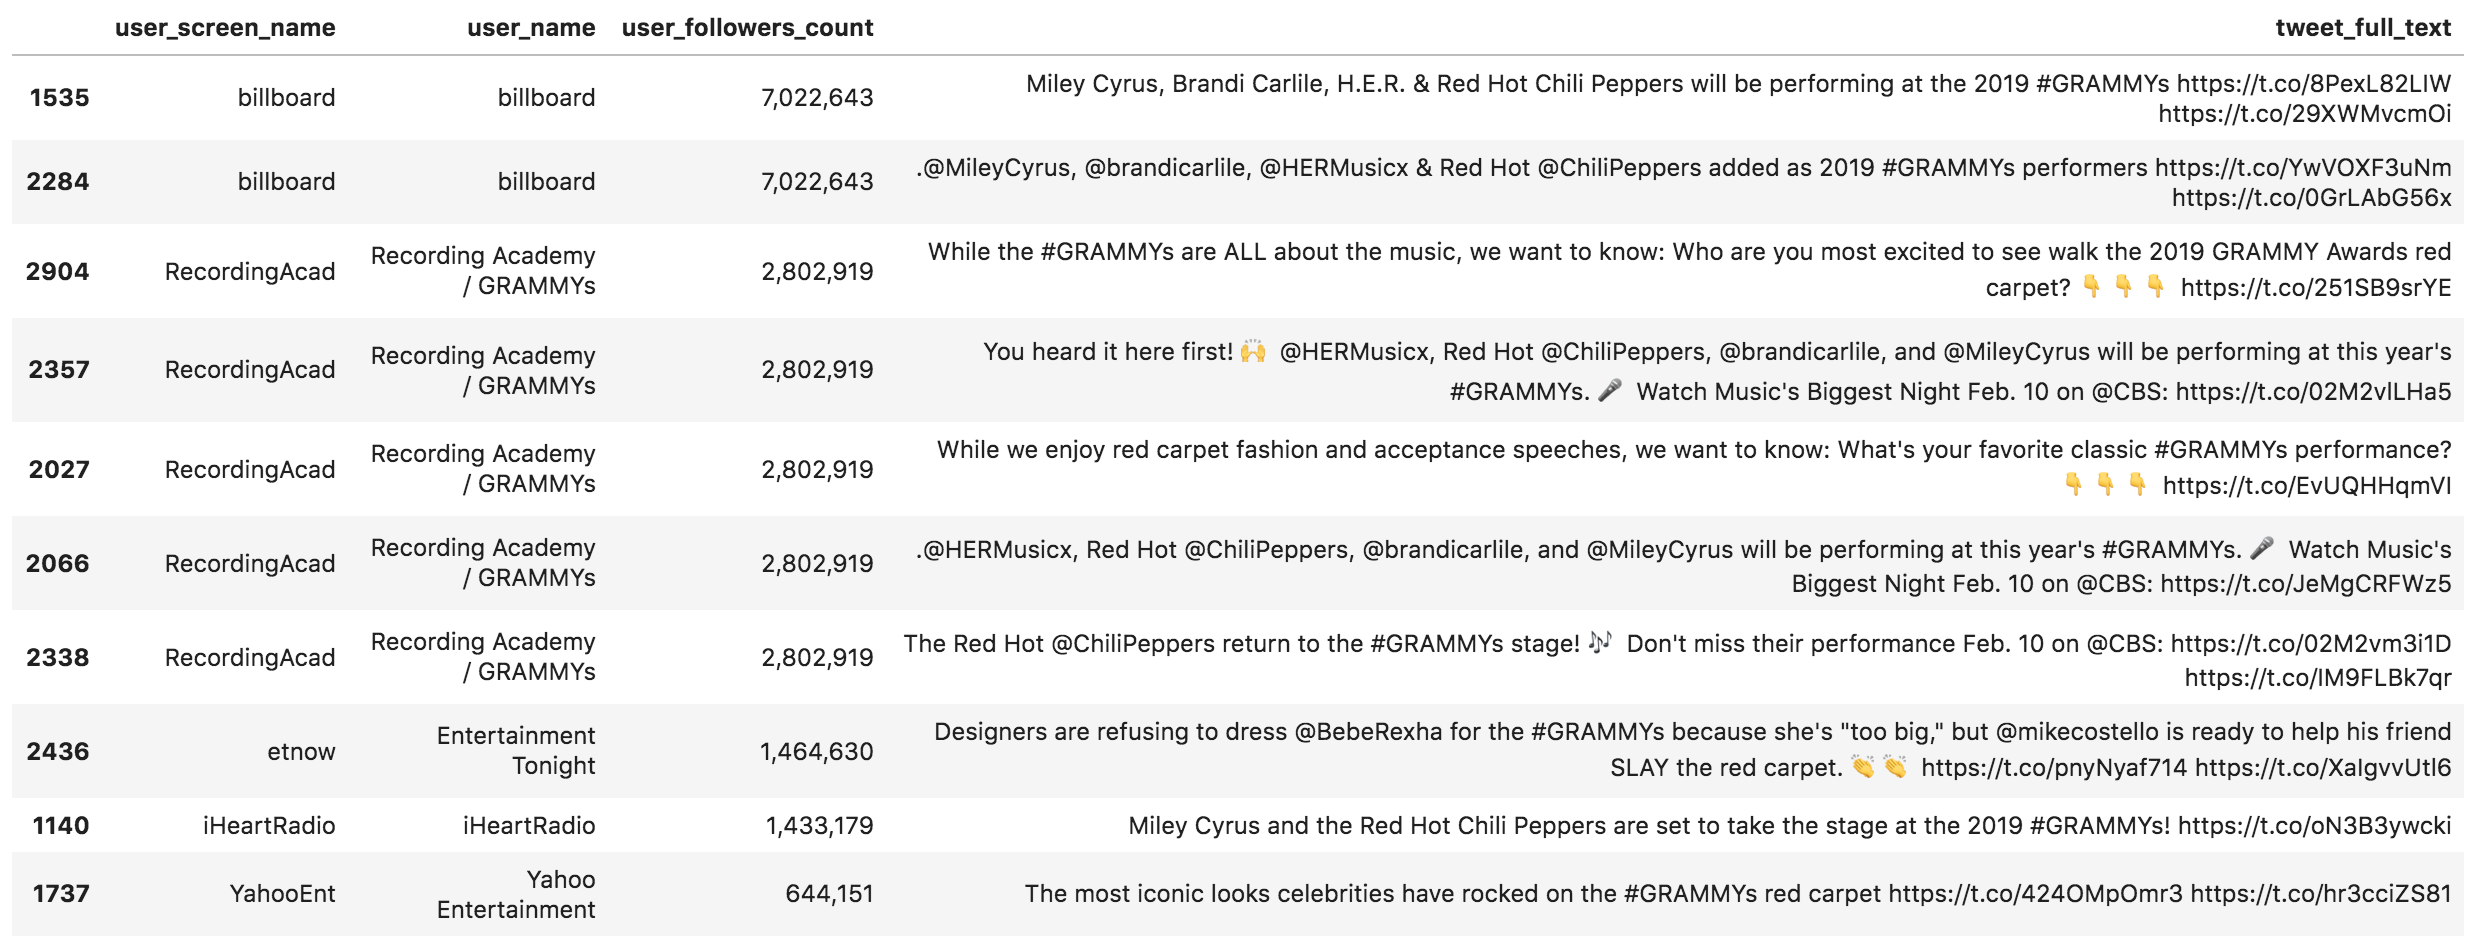 Tweets containing "red"
Mostly Red Hot Chili Peppers, and some red carpet mentions. Feel free to replace "red" with any other word you find interesting and make your observations.
Entity Frequency
Now let's combine both topics. We will run word_frequency on the entities that we extracted and see if we get any interesting results. The below code creates a new DataFrame that has the usernames and follower counts. It also has a column for each of the extracted entities, which we will count now. It is the same process as above, but we will be dealing with entity lists as if they were tweets.
entities = pd.DataFrame({ 'user_name': shutdown['user_name'], 'user_screen_name': shutdown['user_screen_name'], 'user_followers': shutdown['user_followers_count'], 'hashtags': [' '.join(x) for x in hashtag_summary['hashtags']], 'mentions': [' '.join(x) for x in mention_summary['mentions']], 'emoji': [' '.join(x) for x in emoji_summary['emoji']], 'emoji_text': [' '.join(x) for x in [[y.replace(' ', '_') for y in z] for z in emoji_summary['emoji_text']]], }) entities.head(15)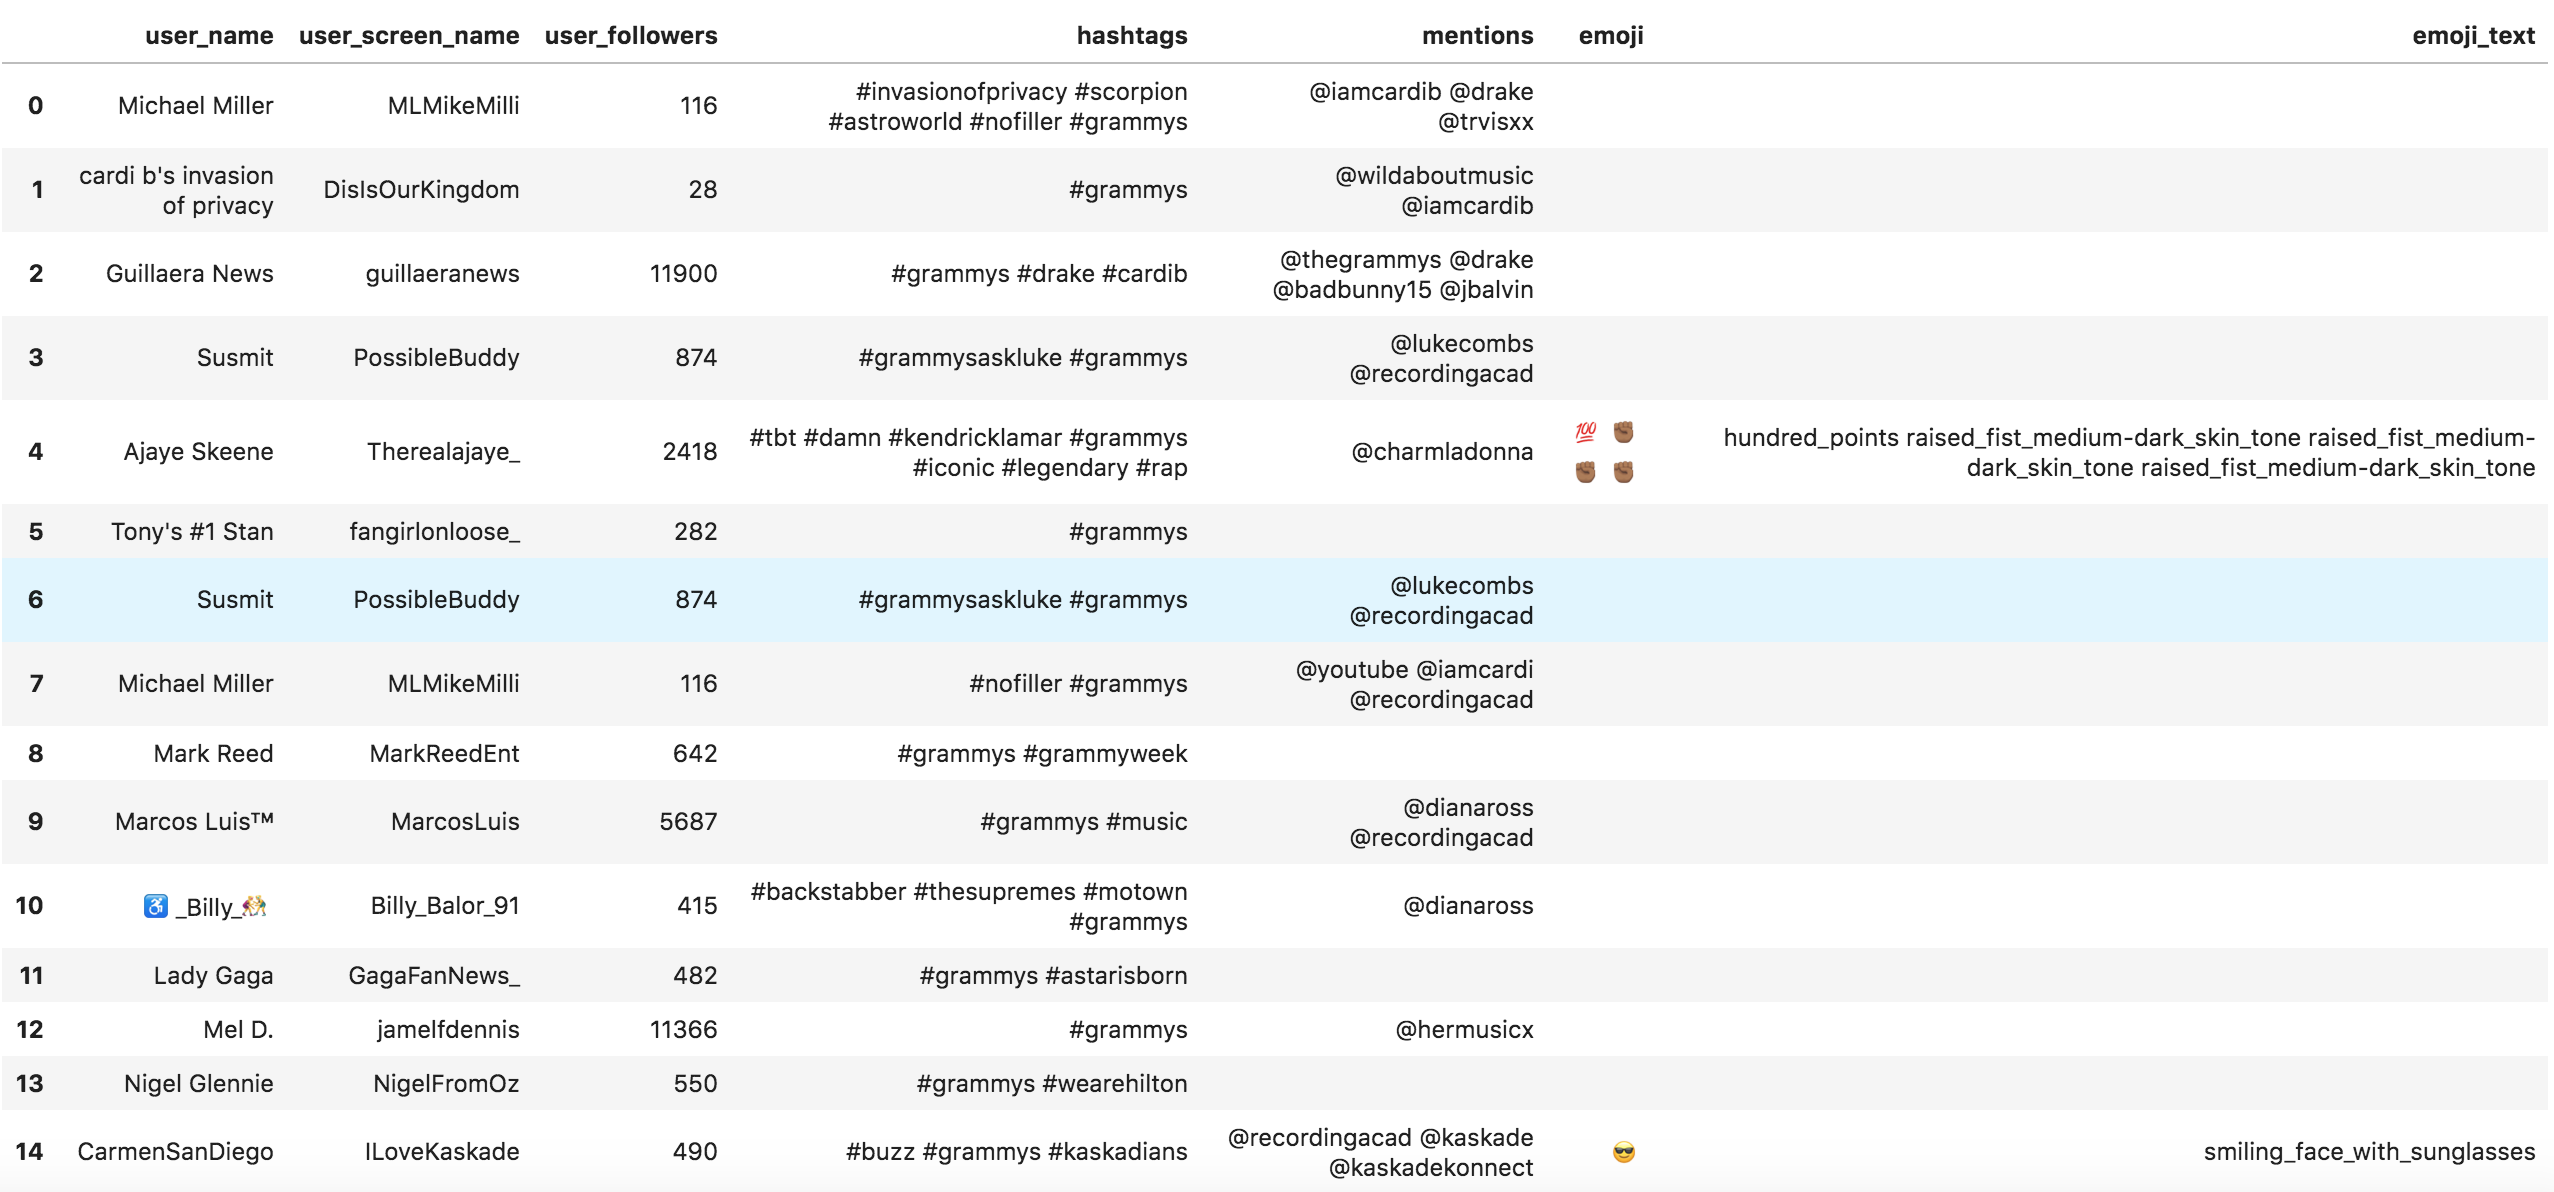 Entities DataFrame
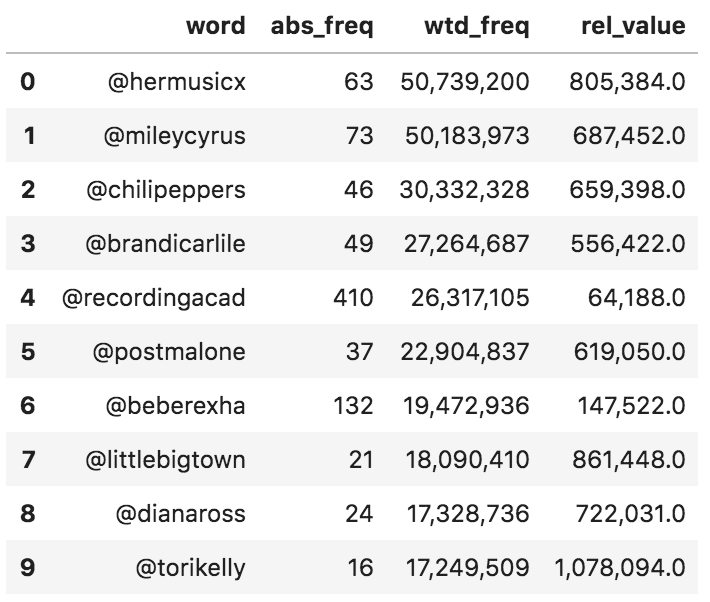 Mentions frequency - absolute and weighted
Now we get a few hidden observations that would have been difficult to spot had we only counted mentions on an absolute basis. @recordingacad, the most mentioned account, ranks fifth on a weighted basis, although it was mentioned more than six times the mentions of @hermusicx. Let's do the same with hashtags.
(adv.word_frequency(entities['hashtags'], entities['user_followers']) .head(10) .style.format({'wtd_freq': '{:,}', 'rel_value': '{:,}'}))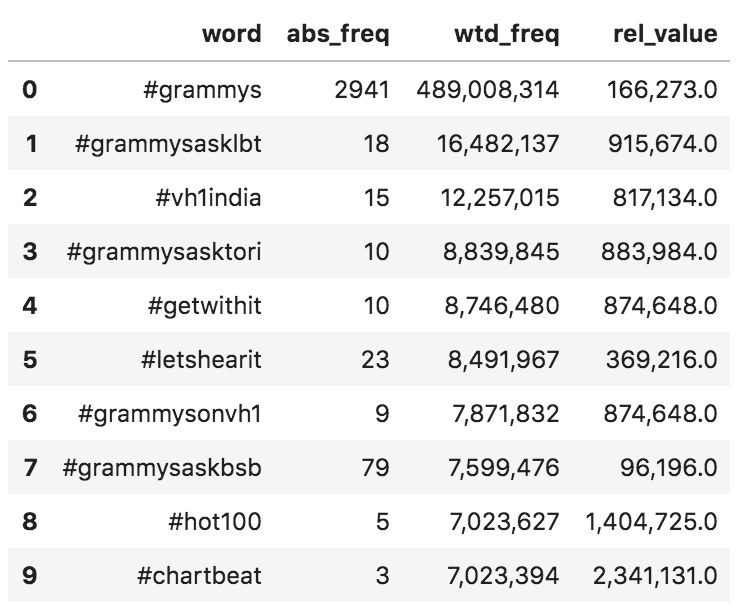 Hashtag frequency - absolute and weighted
#grammysasklbt appears to be much more popular than #grammysaskbsb on a weighted basis, and the #Grammysasks hashtags are all in the top eight.
(adv.word_frequency(entities['emoji'], entities['user_followers']) .head(10) .style.format({'wtd_freq': '{:,}', 'rel_value': '{:,}'}))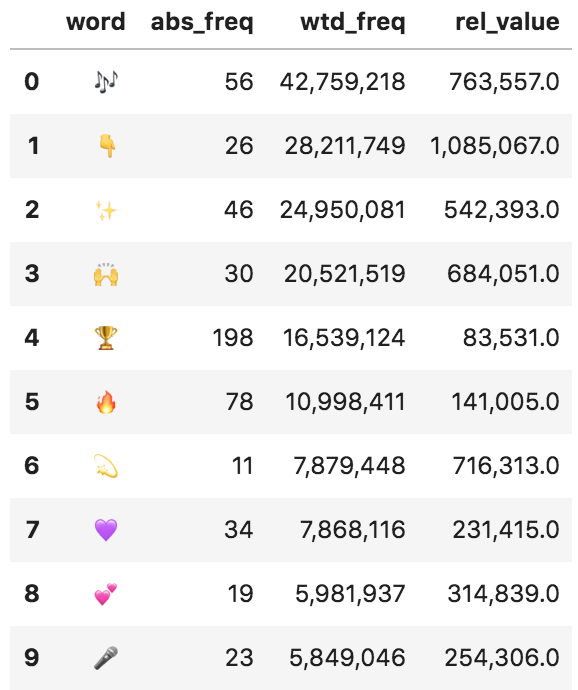 Emoji frequency - absolute and weighted
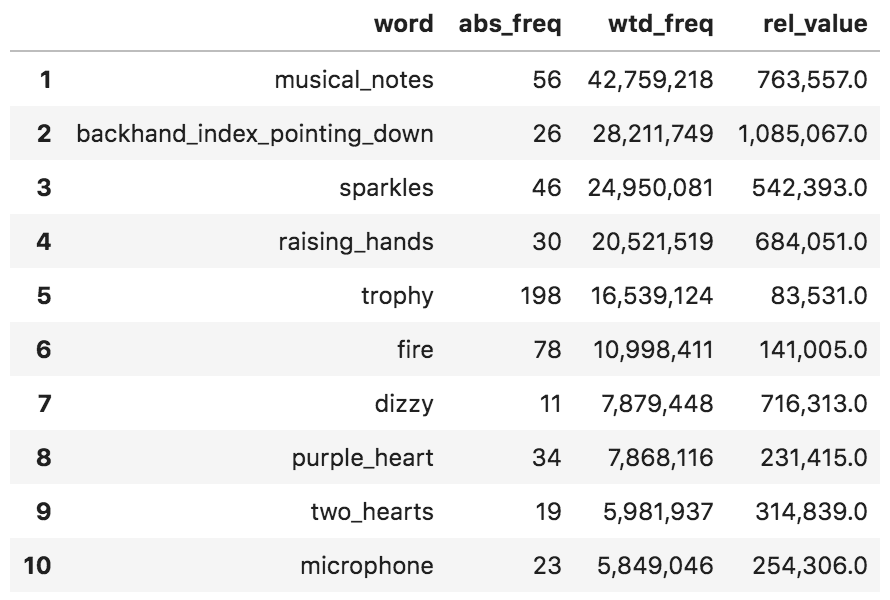 Emoji names frequency - absolute and weighted
Now that we have ranked the occurrences of emoji by followers, the trophy ranks sixth, although it was used almost four times more than musical notes.
Summary
We have explored two main techniques to analyze text and used tweets to see how they can be implemented practically. We have seen that it is not easy to get a fully representative data set, as in this case, because of the timing. But once you get a data set that you are confident is representative enough, it is very easy to get powerful insights about word usage, counts, emoji, mentions, and hashtags. Counting by weighing the words with a specific metric makes it more meaningful and makes your job easier. These insights can be easily extracted with very little code.
Here are some recommendations for text analysis while using the above techniques:
Domain knowledge: No amount of number crunching or data analysis technique is going to help you if you don't know your topic. In your day to day work with your or your client's brand, you are likely to know the industry, its main players, and how things work. Make sure you have a good understanding before you make conclusions, or simply use the findings to learn more about the topic at hand. Long periods / more tweets: Some topics are very timely. Sports events, political events, music events (like the one discussed here), have a start and end date. In these cases you would need to get data more frequently; once a day, and sometimes more than once a day (during the Grammys for instance). In cases where you are handling a generic topic, like fashion, electronics, or health, things tend to be more stable, and you wouldn't need to make very frequent requests for data. You can judge best based on your situation. Run continuously: If you are managing a social media account for a particular topic, I suggest that you come up with a template, like the process we went through here, and do it every day. If you want to run the same analysis on a different day, you don't have to write any code; you can simply run it again and build on the work I did. The first time takes the most work, and then you can tweak things as you go; this way you would know the pulse of your industry every day by running the same analysis in the morning, for example. This strategy can help a lot in planning your day to quickly see what is trending in your industry, and who is influential on that day. Run interactively: An offline data set is almost never good enough. As we saw here, it is still premature to judge what is going on regarding the Grammys on Twitter, because it is still days away. It might also make sense to run a parallel analysis of similar hashtags and/or some of the main accounts. Engage: I tried to be careful in making any conclusions, and I tried to show how things can be affected by one user or one tweet. At the same time, remember that you are an online marketer and not a social scientist. We are not trying to understand society from a bunch of tweets, nor are we trying to come up with new theories (although that would be cool). Our typical challenges are figuring out what is important to our audiences these days, who is influential, and what to tweet about. I hope the techniques outlined here make this part of your job a little easier, and help you to better engage with your audience.Innovative SEO services
SEO is a patience game; no secret there. We`ll work with you to develop a Search strategy focused on producing increased traffic rankings in as early as 3-months.
A proven Allinclusive. SEO services for measuring, executing, and optimizing for Search Engine success. We say what we do and do what we say.
Our company as Semrush Agency Partner has designed a search engine optimization service that is both ethical and result-driven. We use the latest tools, strategies, and trends to help you move up in the search engines for the right keywords to get noticed by the right audience.
Today, you can schedule a Discovery call with us about your company needs.
Source:


