

Google Analytics is one of the many tools that Google provides to help people understand what visitors are doing on their website. The tool allows you to track and analyze critical data on your site and site visitors. The big question people ask, “Is Google Analytics Free?” — Yes, and it is one of the most popular free tools available.
The volume of data Google Analytics provides makes it an essential component of any website manager's or marketer's online toolbox. In this Google Analytics guide for beginners, we will cover some of the crucial things you need to know about the tool, including:
What Is Google Analytics? Why You Need Google Analytics How to Set Up Google Analytics Google Analytics DashboardWhat Is Google Analytics?
Google Analytics is the premier analytics platform for tracking site or app performance. It is part of a range of tools provided by Google that include Google Search Console and Google Tag Manager. Check out this article, where you can find supporting tools that use Google Analytics.
The platform provides you with a full picture of how your site is performing. It collects a vast amount of data and processes it intelligently. It then generates reports to display that data to you. Those reports are what you can use to gain critical insight into your site and the people who visit it.
Data Collection
The first element of Google Analytics is data collection. The platform can gather a broad range of data about your site and how visitors use it. The exact nature of the data collected will be discussed in depth later. It includes, most notably:
How many visitors your pages get.
Where visitors come to your pages from.
How those visitors progress through your site.
What visitors do on your pages.
How visitors interact with elements on your pages.
How long visitors spend on your pages.
At what stage of a visit users leave your site.
Google Analytics uses a simple JavaScript code to gather all this data. You get that code when you set up Analytics for your website, as will be explained later. The code is added to every page and puts a cookie in the browser of each site visitor. The cookie then sends a hit to your Google Analytics that reports each interaction the user has with your site.
Which Kinds of Hits Does Google Analytics Track?
Google Analytics works with three different types of hits:
Pageview Hit — A hit that is sent each time someone visits one of your pages. It contains information like what device and browser visitors are using. You can also find out which of your pages they visit.
Event Hit — A hit sent when a visitor does something on your site. They might, for instance, fill in a form, click a link or play a video.
Transaction/Ecommerce Hit — A hit sent when a site visitor buys something. Information such as which pages the visitor went to before buying can be contained in these hits. More straightforward insights, such as which products they bought or how much they spent, are also provided.
Data Processing
Google Analytics doesn’t present you with the raw data the platform collects. It first processes data and then generates reports. The first stage of data processing is the separation of data by users and sessions.
User Data — This is data on different, distinct visitors to your site. Google Analytics creates a unique, random user ID for each new visitor to your site. If the same user revisits your website in the future, Analytics recognizes the user ID.
They will then be logged as a ‘returning’ visitor; this only works if they visit using the same device. The process can be subverted if they clear your cookie from their browser cache.
Session Data — A session is a period of time that a user spends on your site. It begins with a pageview hit when the user first visits the website, and it continues until they ultimately leave the site. During each session, Analytics collects a host of different types of session data.
That session data includes the pages visited, actions taken, and time spent on your site. You can use this data to gain insights into site user behavior. It can be critical to understanding site performance, as we’ll talk about below.
Report Generation
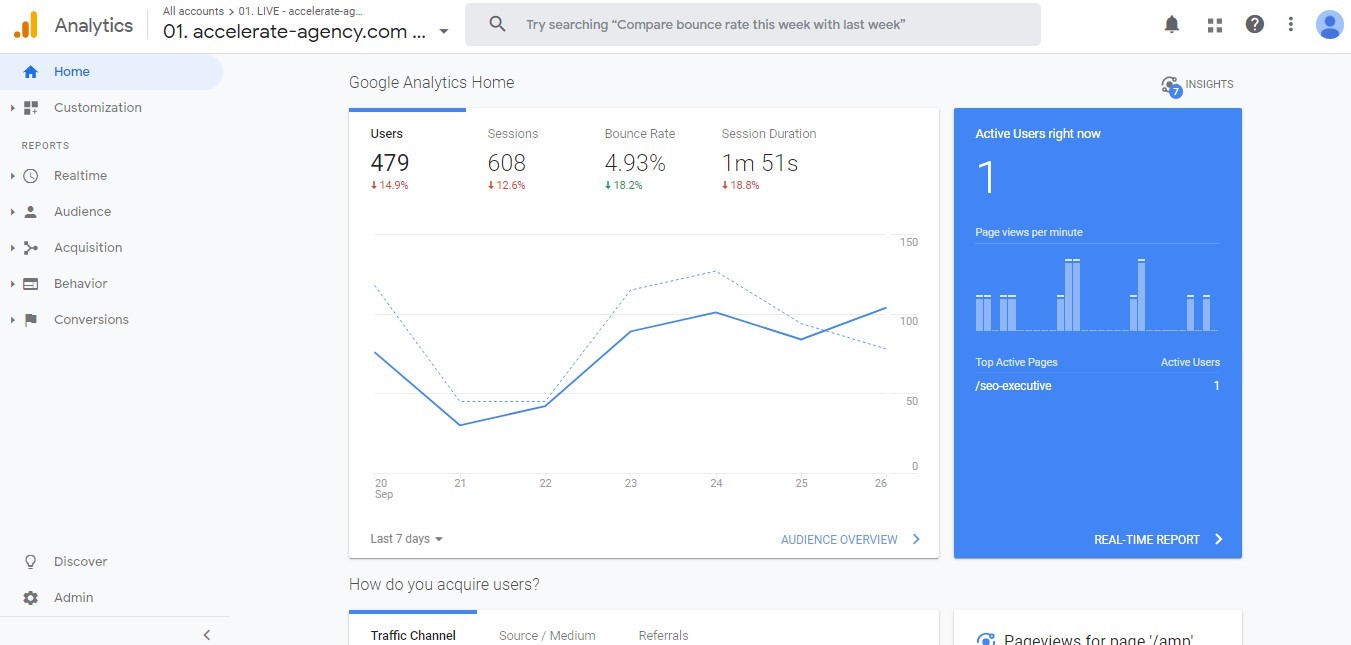
Data Google Analytics processes are presented to you in the form of reports. These are visual representations of the data. They are designed to make it easy to ID patterns and gain insights. Visuals, after all, are known to be more effective at conveying complex ideas. The following, for instance, is a report showing the number of users a site gets over a period of time:
All reports on Google Analytics display a combination of Dimensions and Metrics. It is important to know what each of these is to understand what different reports tell you.
What are Dimensions and Metrics in Google Analytics?
Dimensions — these are basic attributes of the collected data. ‘Country,’ for example, is a dimension that may be provided for user data. It would tell you which countries site users come from.
Metrics — These are quantitative measurements; they tell you the number of something. The ‘Sessions’ metric, for example, tells you how many sessions took place on your site over a period of time.
Google Analytics creates a range of default reports. We will look at many of them in-depth later. You can also create custom reports that combine different dimensions and metrics.
Not all dimensions and metrics can be combined into reports. They each have what is known as a ‘scope’ — that is the level at which their data is collected. The different scopes are ‘user-level,’ ‘session-level,’ and ‘hit-level.’ Only the dimensions and metrics of the same scope can be combined.
Why You Need Google Analytics
You can use Google Analytics for a range of different purposes. In the section below, we will quickly review three of the most common applications of Google Analytics.
Analytics For Marketing
The insights you can gain from Analytics reports can be vital to improving your marketing. Data collected can help you answer a range of questions about your marketing efforts:
How much traffic is driven to your site by different marketing channels?
Which websites refer the most visitors?
Where do your site visitors live?
What is the conversion rate of visitors from different channels?
The answers to those questions will help you better tailor your marketing efforts. They can show you the channels to invest in and those to move away from. They can also help you better define your target audience, amongst many other helpful insights.
Analytics to Improve Site Performance
Analytics reports are also the perfect place to learn about your site and those people who use it. In this area, the questions which the platform help you answer are even more plentiful:
Which of my pages get the most traffic?
Where on my site, do visitors leave?
How quickly do my site’s pages load?
Are load times longer for visitors using mobile devices?
Those kinds of insights give you practical ways forward for improving your site performance. Rather than a vague aim of improving traffic, you can have a more concrete objective. You might, for instance, learn that your blog posts get a lot of traffic — that could tell you that producing more and promoting them well could help boost traffic even further.
Analytics to Aid Your SEO
Google Analytics insights are also invaluable for informing your SEO. The platform helps answer an array of questions about how users find and interact with your site:
How much search traffic is your site getting?
Which of your landing pages gets the most traffic?
What search queries do visitors use to find your site?
What’s your site’s bounce rate for visitors from different sources?
In SEO, as in many things, information is power. The more you know about your site visitors and your target audience, the better. Google Analytics is a platform that provides a plethora of data. Access and assess the right reports, and it can help boost the ROI you see from your SEO efforts.
How to Set Up Google Analytics
Getting started with Analytics is nice and simple. You first need to set up a Google Account. If you already use Gmail, Google Drive, or other tools, you already have one. If not, it is easy to set one up. When you have got an account, log in to it, and you can get started setting up GA and adding Google Analytics to a website.
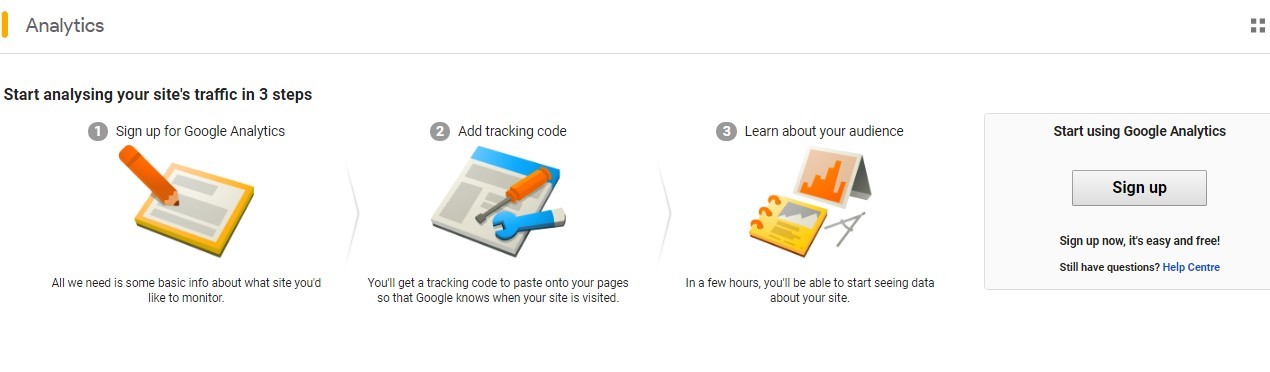
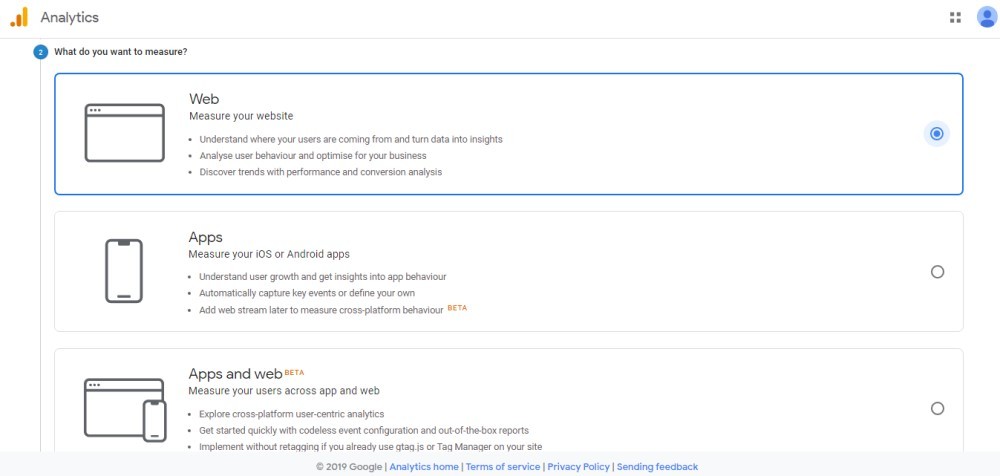
The above graphic is from the Google Analytics homepage. It shows you the easy three-step process for setting up the platform. When you are ready, click the signup button. That will take you to a page where you need to start providing information about yourself and what you will be using Analytics for:
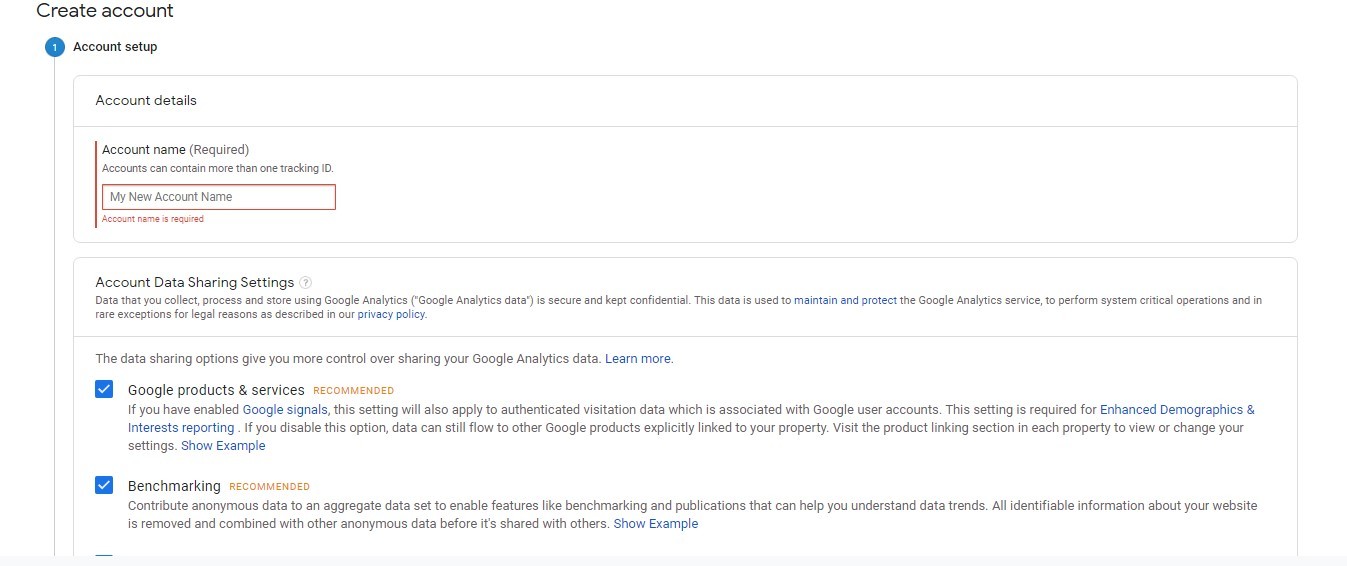
This part of the process is no more complicated than following on-screen instructions. Once you have chosen an account name and made some basic choices, you then select what you want to measure.
The final step in the account setup process is to enter the exact details of the site you need to track. Once you have created your Analytics account, you will be able to add up to 50 different sites to track. For now, though, enter the URL you want to link to your account.
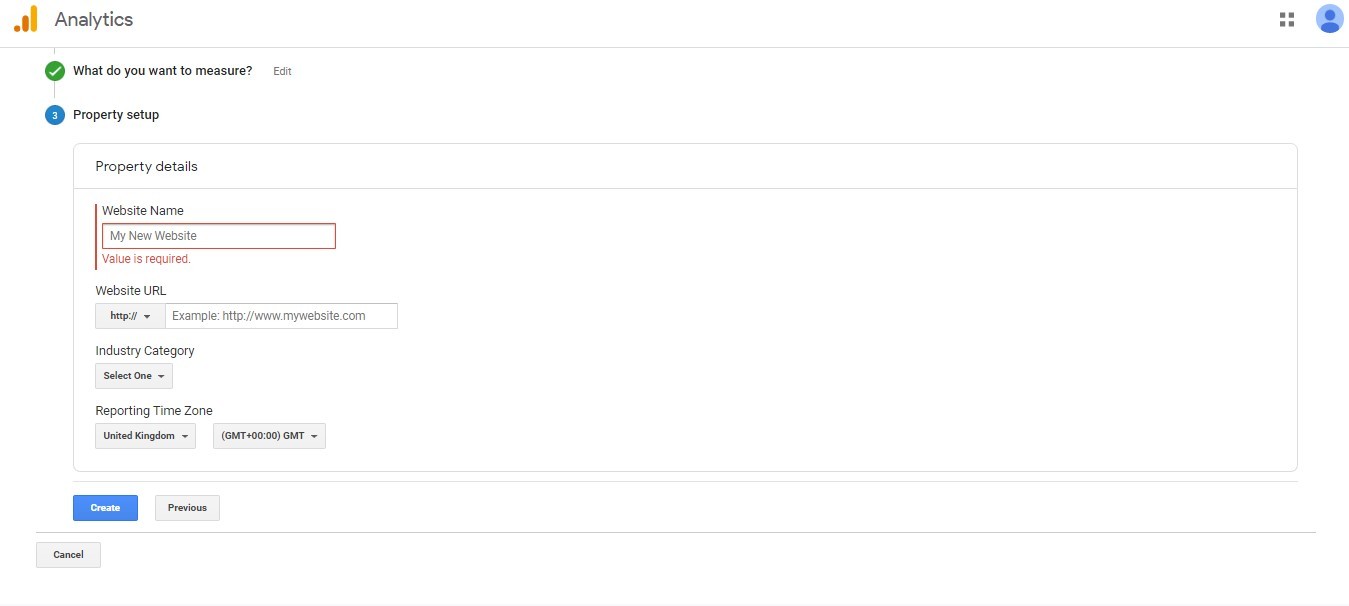
Clicking the create button will get your Analytics account up and running. It will also provide you with your tracking code for the site which you chose to track. That tracking code is what allows Google Analytics to collect data from visitors to your site. Your next job is to add the code to your site.
How to Add Your Tracking Code
You need to add your tracking code to every page of your website. Or at least to every different type of page your site has. By adding the code to the header or footer, you can add the code to your whole site.
The tracking code needs to be added right after the < head > tag of your header file. If you have built your site using HTML files, that will mean adding the tag to those files. If you use a CMS like WordPress, you may also have the option to install Google Analytics via a plugin. If you search the WordPress plugins page for ‘Google Analytics,’ you will find a range of options (read the reviews before you choose). Then, all you need to do is to follow the instructions to install the plugin.
With your Google Analytics account set up and the tracking code added, you are ready to get started. Analytics will begin tracking data straight away. While you wait for site data to build up, there are a couple of other Analytics features that are worth setting up.
How to Set Up Site Search
One of the many valuable yet straightforward features of Analytics is Site Search Tracking. This feature lets you collect and analyze data on how visitors use your site’s search function. Once set up, the feature can give you lots of handy information, including:
Which queries site users search for.
How many times searches are undertaken.
Which pages searches most often lead to
How often a visitor leaves your site straight after performing a search.
Which pages visitors most often start searches from.
Getting site search setup is simple and shouldn’t take more than a couple of minutes. As a starting point, perform a search on your site. You should take note of the URL which gets generated. Then head to your Google Analytics account.
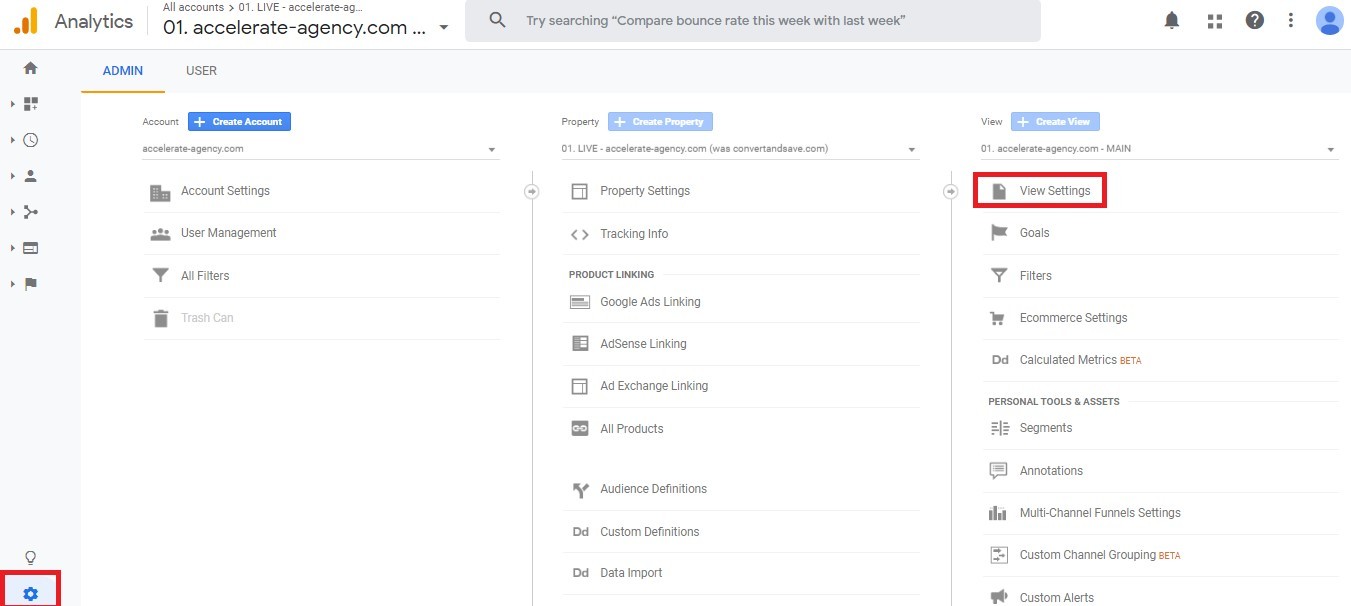
Open the Admin menu by clicking the cog symbol at the bottom left. Then choose the ‘View Settings’ alternative from the ‘View’ column at the right-hand side of the page; that will open a new menu. Scroll down it until you find a section titled ‘Site Search Settings.’
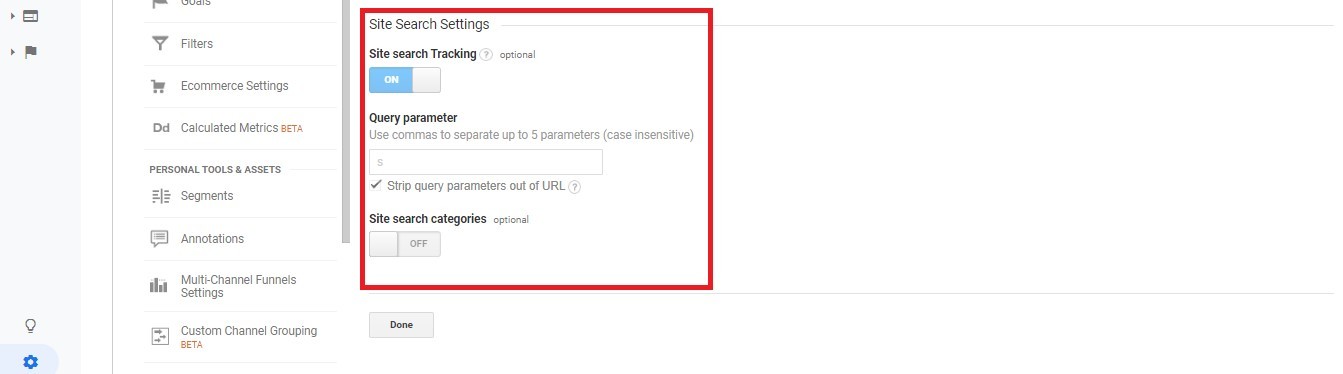
Toggle ‘Site Search Tracking’ to the on position. What you need to do next is to fill in the ‘Query Parameter’ field. That is where the search URL you generated earlier comes in. For example, maybe you entered ‘Google Analytics’ into your site search. If you did, the resulting URL might look like this:
www.website.co.uk/pages/search_results?s=googleanalytics
In the ‘Query Parameter,’ there is an ‘s.’ It’s what indicates the part of the URL which displays the search query. If that was the URL you generated, you would enter ‘s’ into the ‘Query Parameter’ field. Then, all you need do is click ‘Done,’ and the Analytics site search feature is set up.
How to Set Up Goals
Most websites exist with a specific objective in mind. It may be to get them to buy a product. Whatever your site’s goals, Google Analytics Goals provide a way for you to assess how well it fulfills them. That makes it another useful feature to get set up.
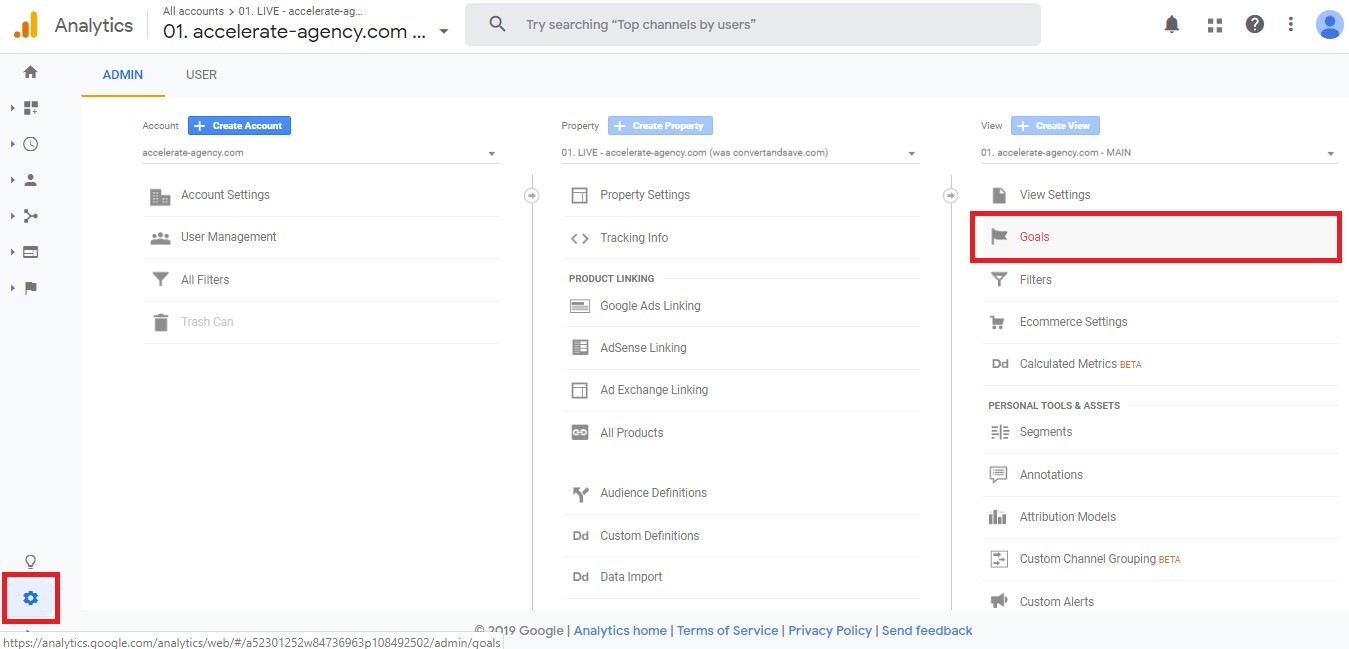
Your first stop is, once again, the Admin panel on Analytics. From there, select the ‘Goals’ option, as shown above. That opens a new page on which you should choose the ‘+ New Goal’ button. You can then decide whether to use an existing goal template or create a custom goal.
Goal templates will satisfy the needs of most site owners. They are designed to let you track all the common goals which sites have. If you wish to create a custom goal, it is pretty easy to do so.
First, name the goal. This name will appear on any reports which include data on the goal, so pick something obvious and memorable. You then need to choose one of the four different types of goals that Analytics allows for:
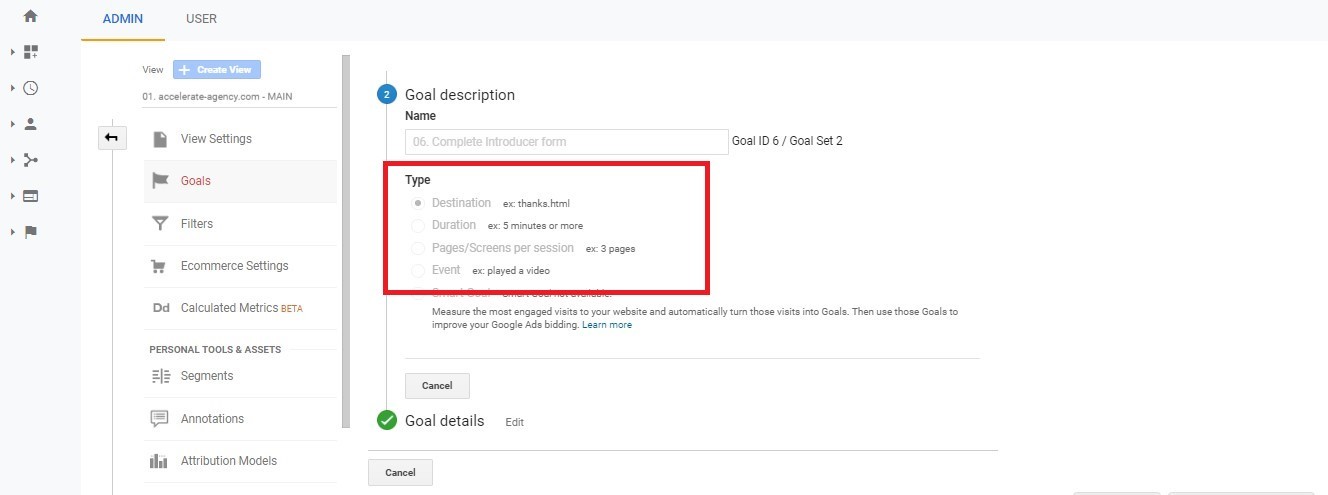
Every Analytics goal records a conversion when a site user performs a specific action. Which action that is, depends on the type of goal you choose.
Destination — When a user visits a defined URL, a conversion is recorded.
Duration — When a user spends a certain amount of time on-site, a conversion is recorded.
Pages/Screens per Session — When a user views a pre-set number of pages in a session.
Event — When a user performs a specific action. For instance, clicking a link or playing a video.
Once you have chosen the type of goal you want to create, there are a couple of further steps. Google Analytics provides on-screen instructions. In general, you have to input the specific details of the goal you want to track. For instance, for a destination goal, you need to provide the URL to which a visit will trigger a conversion:
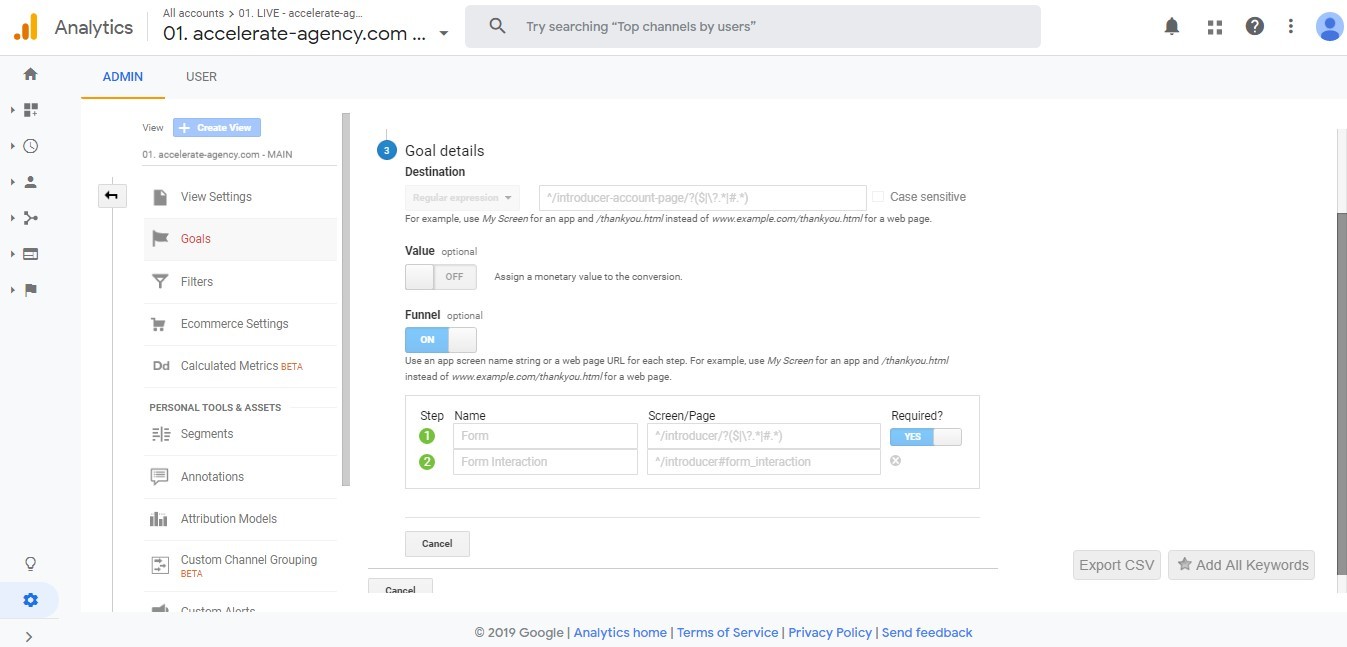
Duration and Pages per Session goals are simple to set up. There are just a few fields to fill in with information about the exact nature of the goals. Event goals are a little different. To set them up, you have to first set up ‘Events’ through Analytics. Google provides a comprehensive guide to doing so.
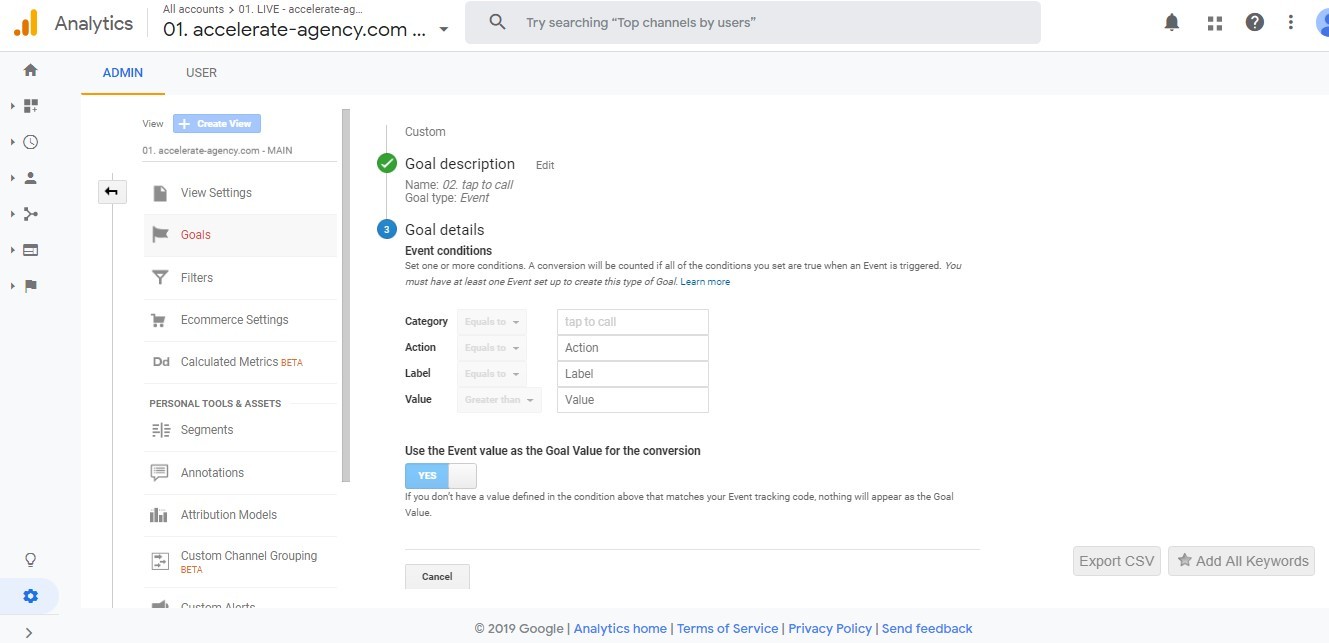
With events set up, things are once again simple. Choose the event you want a goal to refer to and then fill in the other simple fields shown above. Whichever type of goal you’ve set up, clicking on the ‘Create Goal’ button completes the process. Data related to the goal will then start being collected by Analytics.
How to Add Additional Accounts and Properties
One final thing you may wish to know before getting stuck into the Analytics reports is how to add a new account or property. To do this, head to the main Admin menu on Google Analytics.
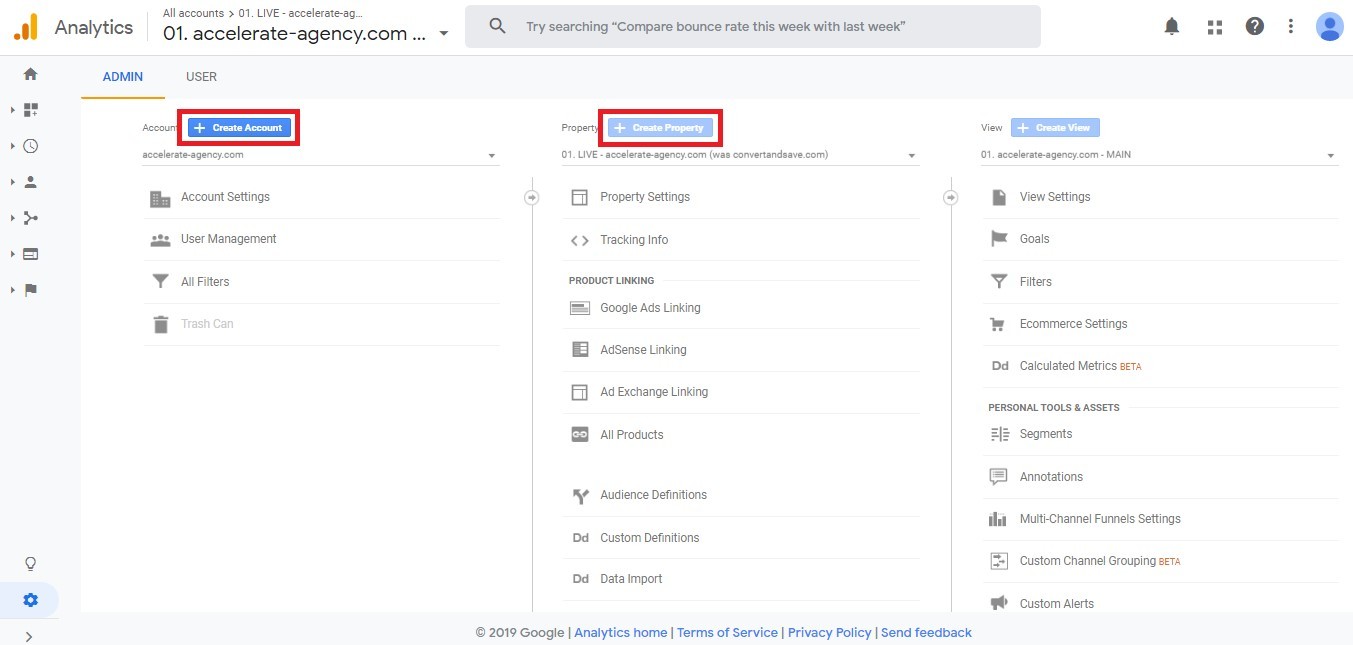
Two of the three blue buttons displayed there are ‘Create Account’ and ‘Create Property.’ Choose whichever is relevant to what you wish to do. You’ll then be taken step-by-step through the process of setting up a new account or new property to track.
Google Analytics Dashboard
Once you’ve got Analytics and its features set up, you can sit back and relax. After 24 hours, the platform should have collected enough data for you to view your first reports.
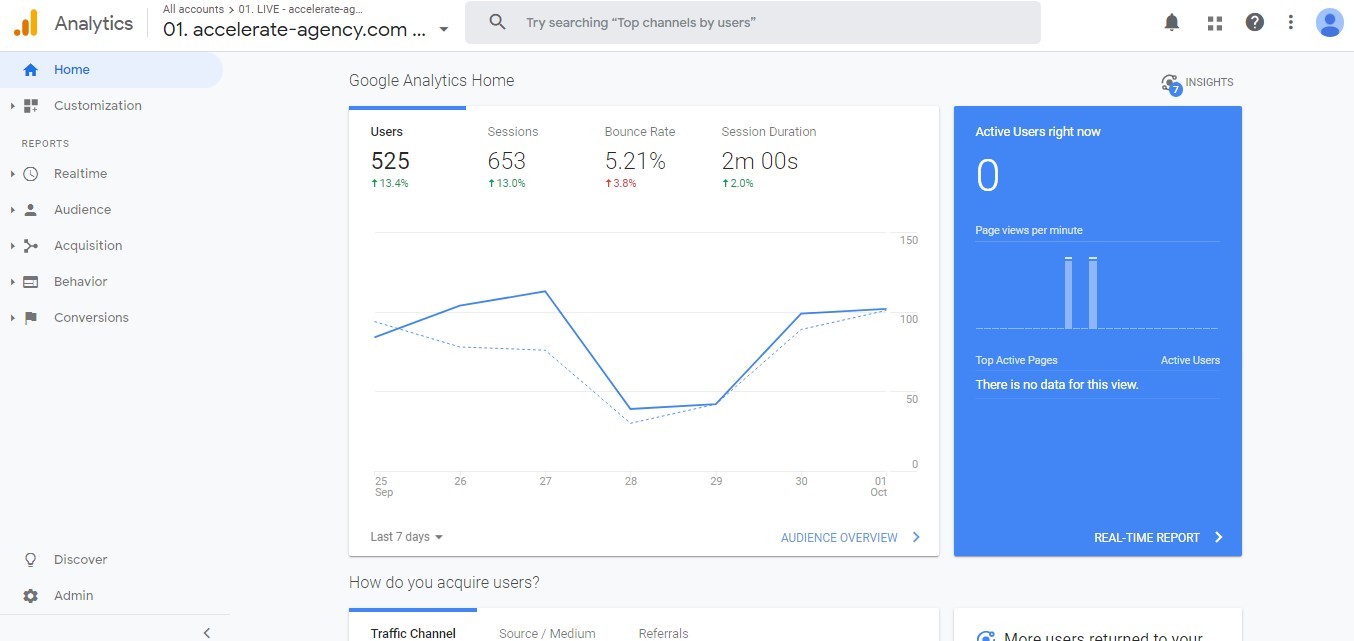
You can access these reports through the Google Analytics dashboard. The home page of that dashboard is shown above and is also known as the Overview dashboard. It’s where each of your visits to Analytics begins. On that page, you’ll find everything you need to navigate through the platform.
Overview Dashboard
You can find links to specific Analytics reports down the left side of the dashboard. We’ll talk about each of the main types of reports in detail later. The right-hand side of the overview dashboard has the first insights into your site data.
Graphs, tables, and other representations of your data are displayed on ‘cards.’ They’re the panels on that right-hand portion of the home page. There are simple options attached to the cards to alter what they show. Typically, you can change the type of data displayed and the time period for which it’s displayed.
You will also often be able to click a link to head to the full report from which the snapshot has been taken. The format of those reports is the same as the homepage. They have cards with tables and graphs, which you can edit to show different information as you see fit.
There are five main categories of a report. Each category has a dashboard. You can access them by clicking the relevant link down the left-hand menu of Analytics. Each one provides you with a range of different reports.
Real-Time Dashboard
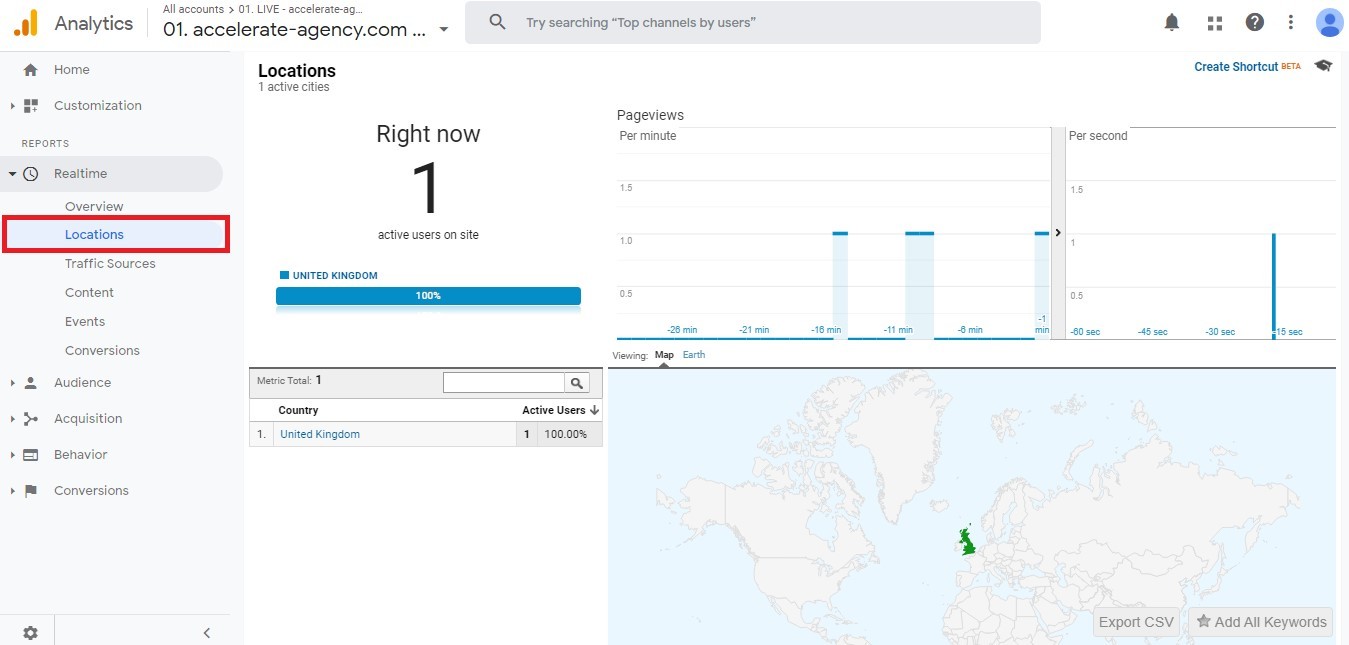
The Real-Time dashboard is the first option on the left-hand menu. It looks similar to the main overview dashboard. The difference is it only displays real-time data visualizations of users currently exploring your site.
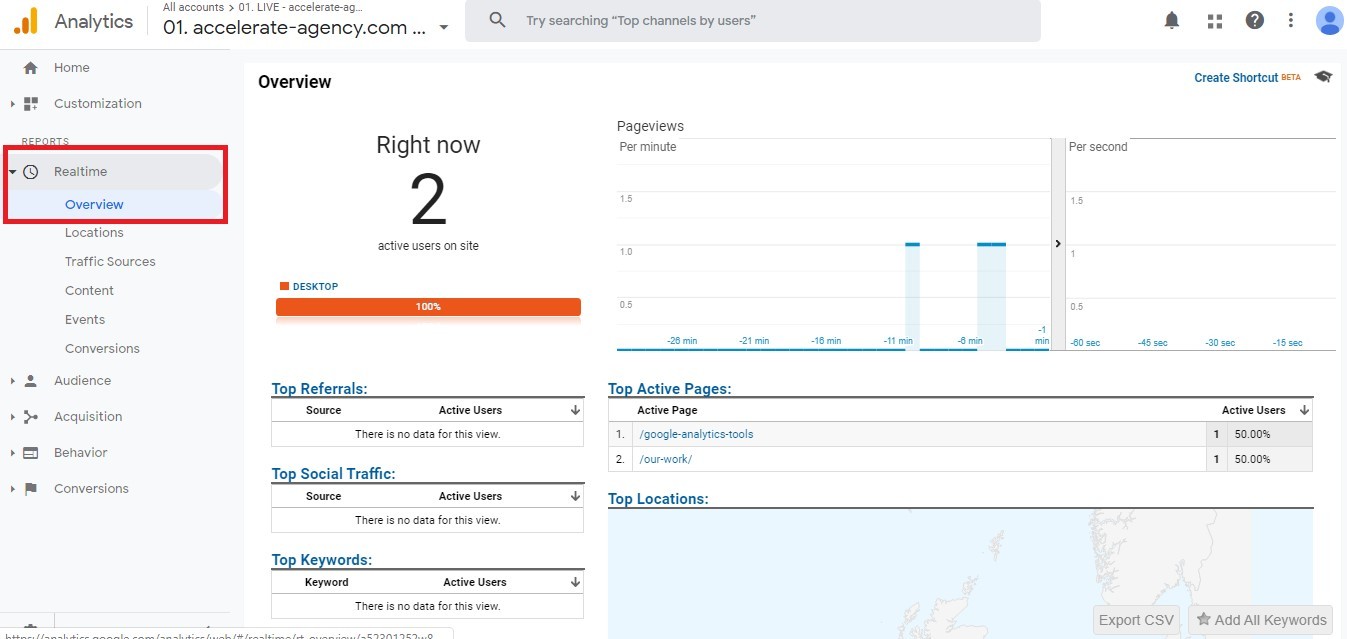
The Real-Time reports update as Analytics receives new hits. The dashboard shows how users are consuming content and provides insights into users. For instance, click the ‘Locations’ option, and you’ll see where current site users are based.
Audience Dashboard
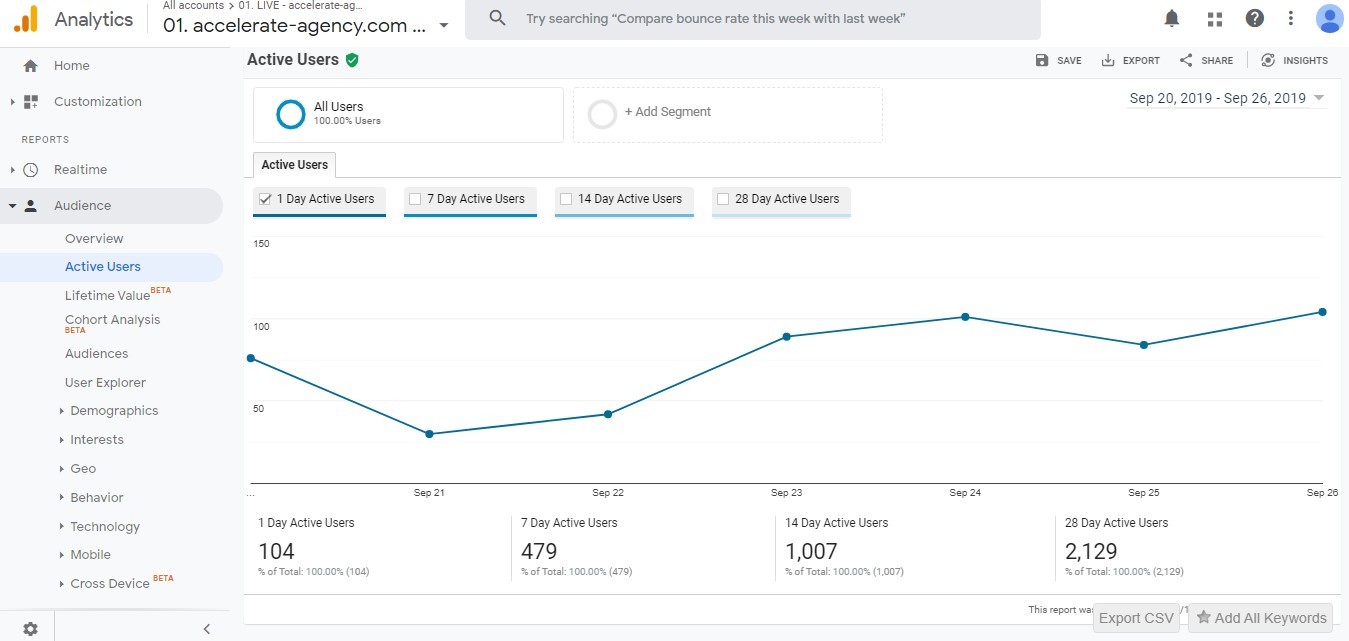
The Audience dashboard is where you go to learn more about your site’s users. Not just those who are on the site now, but all of them. Open up the overview part of the dashboard, and you get a broad view of the data Analytics makes available to you.
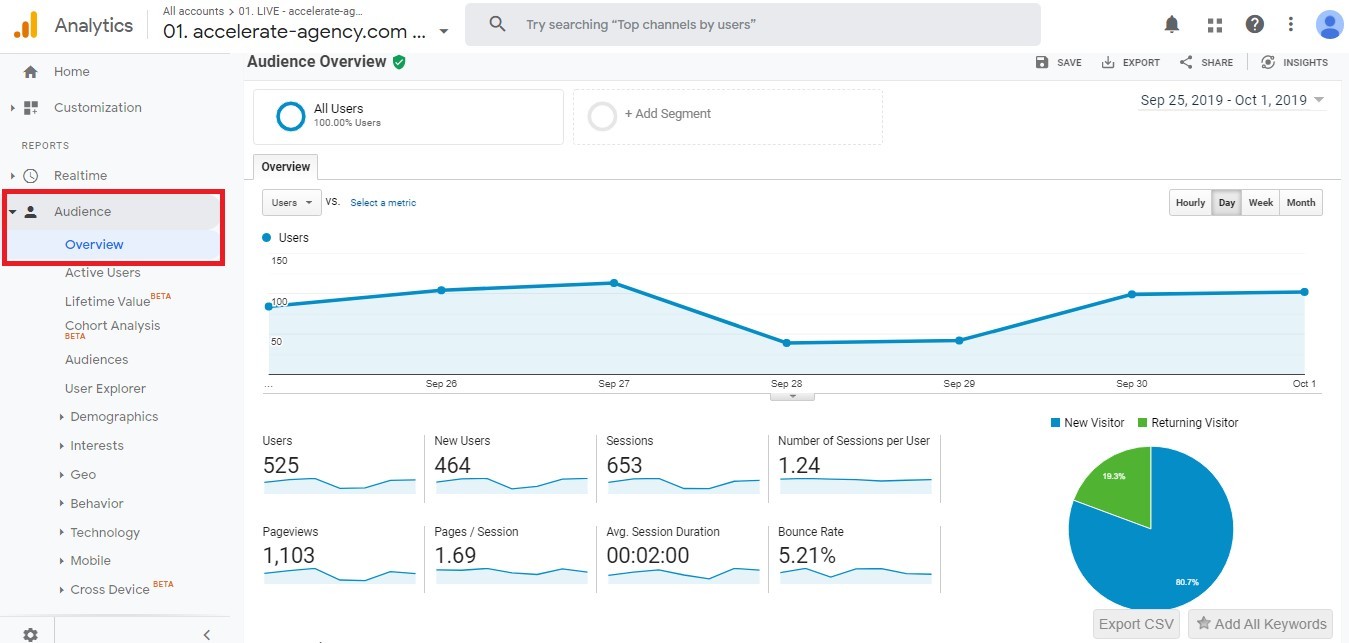
For your chosen time period, you can see how many users and sessions your site has had. You can also view things like how long users stay on your website and how many pages they typically visit. Choosing any of the other reports in the Audience dashboard lets you dig deeper into the user data.
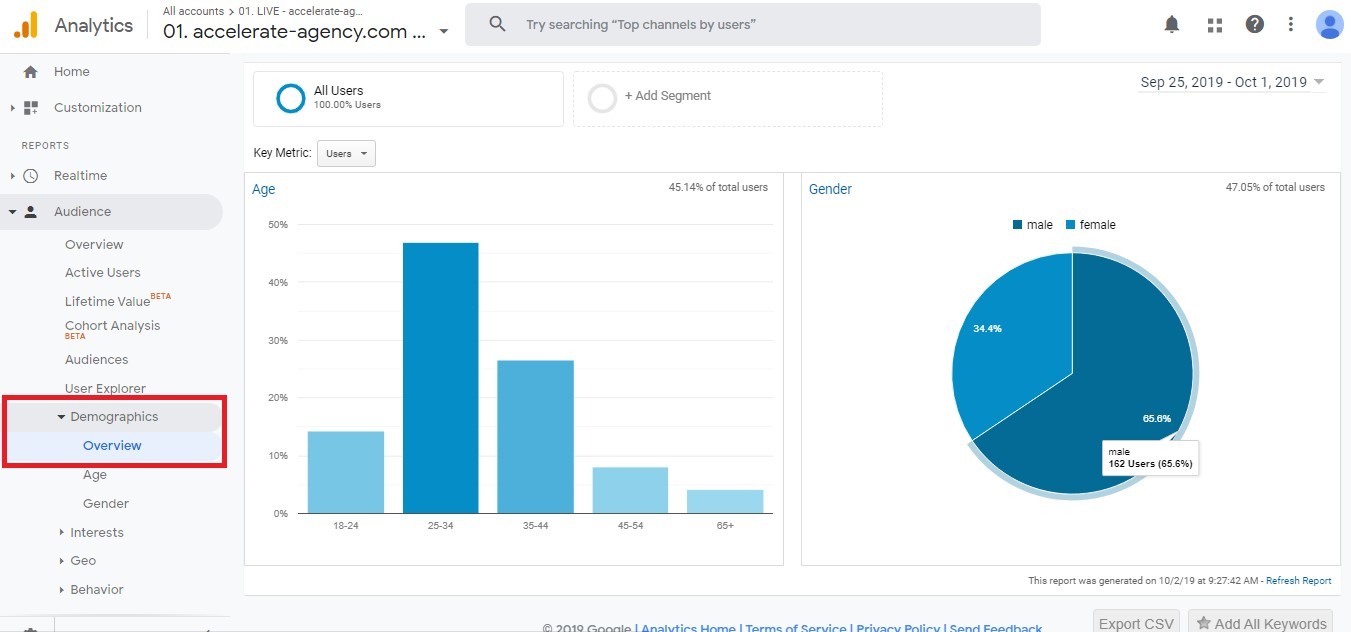
For example, you might choose to visit the Demographics section, as shown above. That report shows you how your site’s audience splits by age and gender. That can be crucial information for a marketing campaign.
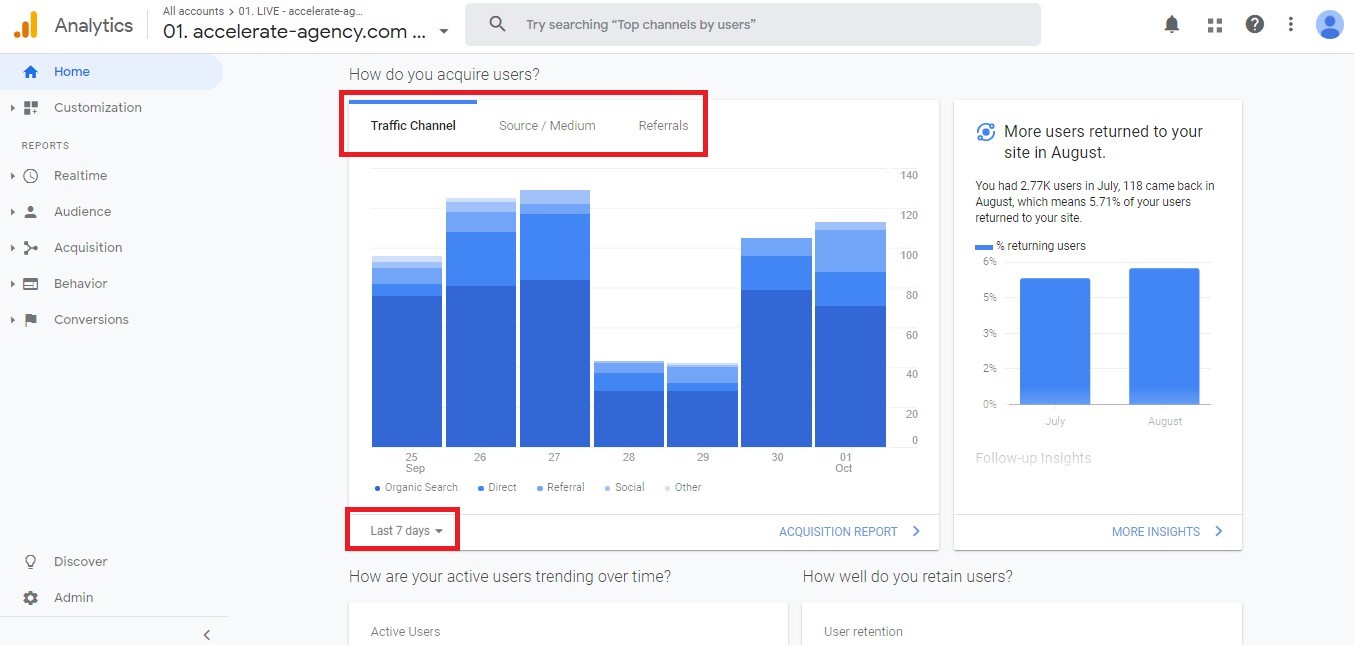
Acquisition Dashboard
The Audience dashboard tells you things about your site’s users. The Acquisitions dashboard gives you insight into how those users found your site. Once again, this part of Analytics begins with an overview report.
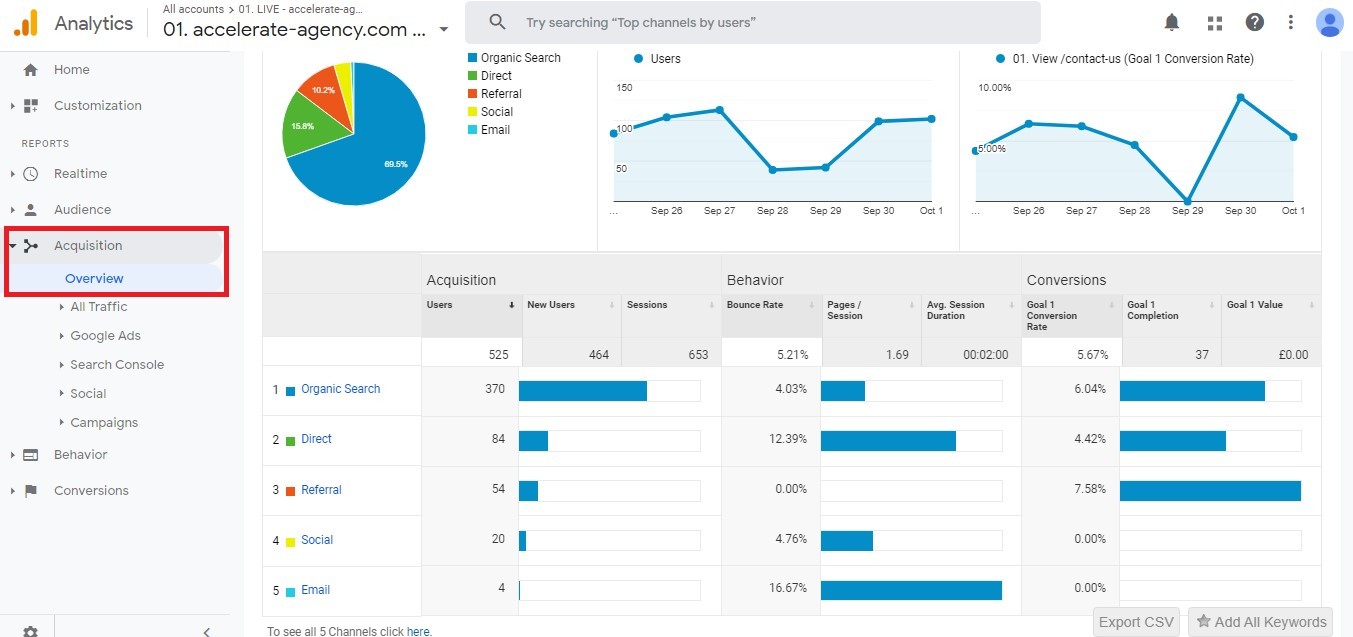
That report displays several dimensions and metrics. The metrics and dimensions are split into three categories; ‘acquisition,’ ‘behavior,’ and ‘conversions.’ ‘Acquisition’ information tells you about the users your site gets from different channels. ‘Behavior’ metrics report on what those users do, while ‘Conversions’ data displays how users from different channels convert.
The other reports in the Acquisitions dashboard let you dissect your data in a range of ways. ‘All Traffic’ is where you’ll find more in-depth reports into the data displayed on the overview report.
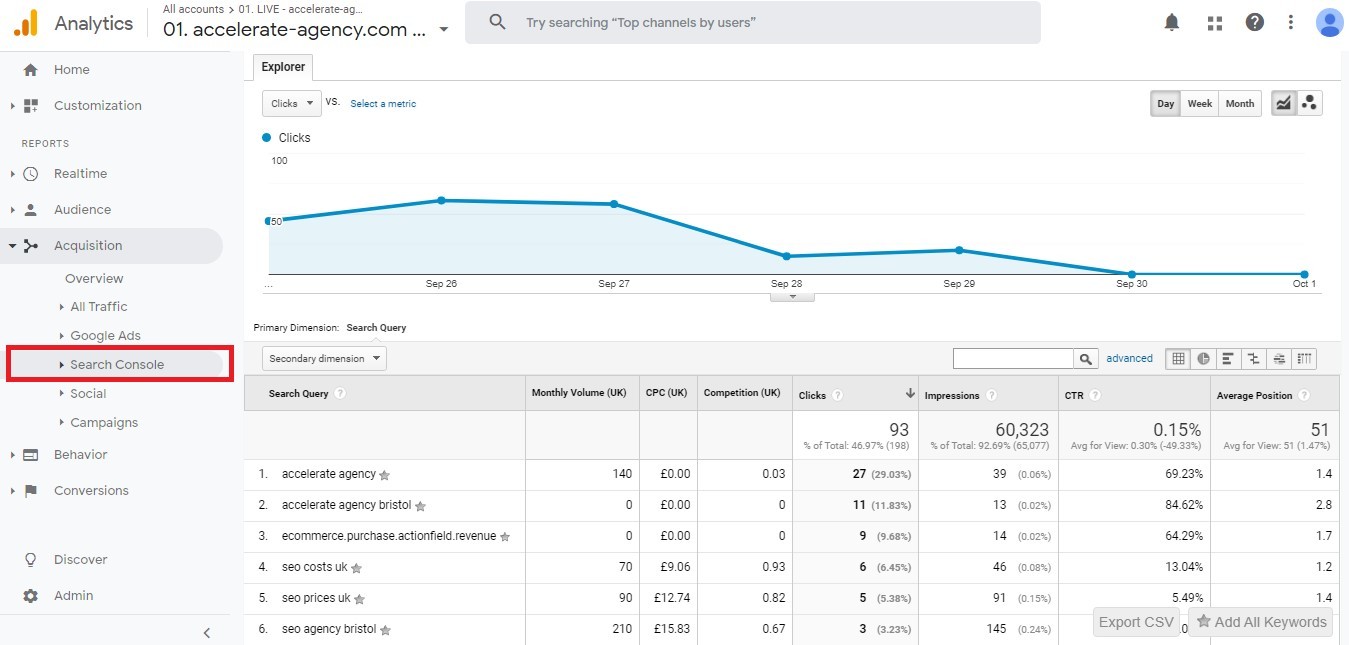
Other options, meanwhile, look specifically at individual acquisition channels. The ‘Search Console’ reports, for example, let you view how users reach your site via organic search. You can find out things like how many users access your site from Google and which search queries they use.
Behavior Dashboard
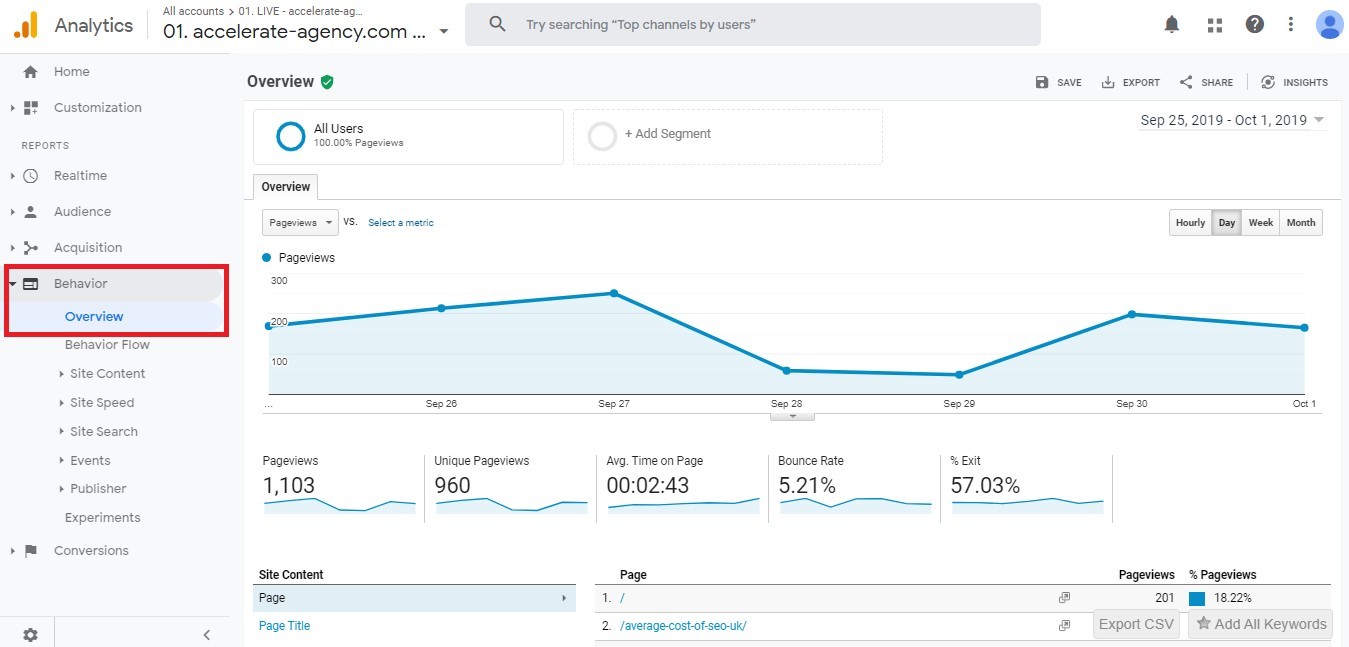
Some of the reports we’ve already mentioned include data on how users interact with your site. The Behavior dashboard is where you go for more comprehensive data in that regard. The overview report shows you information on page views, session duration, and bounce rate, among other details of user behavior.
The Behavior reports are particularly useful for assessing the performance of different pages on your site. The ‘Site Content’ Report is great for this.
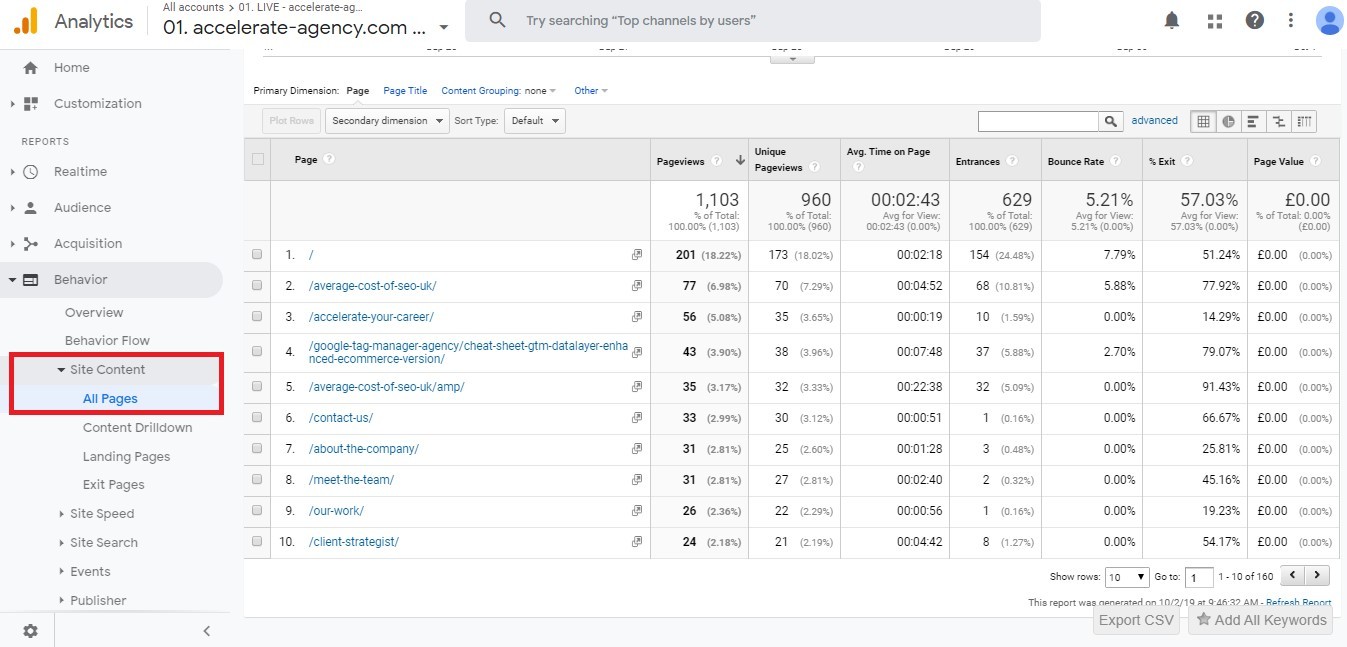
This report displays a wide array of metrics related to the different pages of your site. They include things like page views, average time on page, and bounce rate. These metrics can be really useful. They tell you how popular your pages are.
You can see which get the most views and which keep users’ attention the longest. Those insights tell you what type of content you should focus on producing in the future. They also reveal if you need to improve or even delete some existing pages.
Conversion Dashboard
The last of the main Analytics dashboards is the Conversion dashboard. This part of the platform shows how visitors ‘convert’ when using your site. That means how often they perform the actions you want them to on your site. As such, this dashboard is linked to the goals which you learned how to set up earlier.
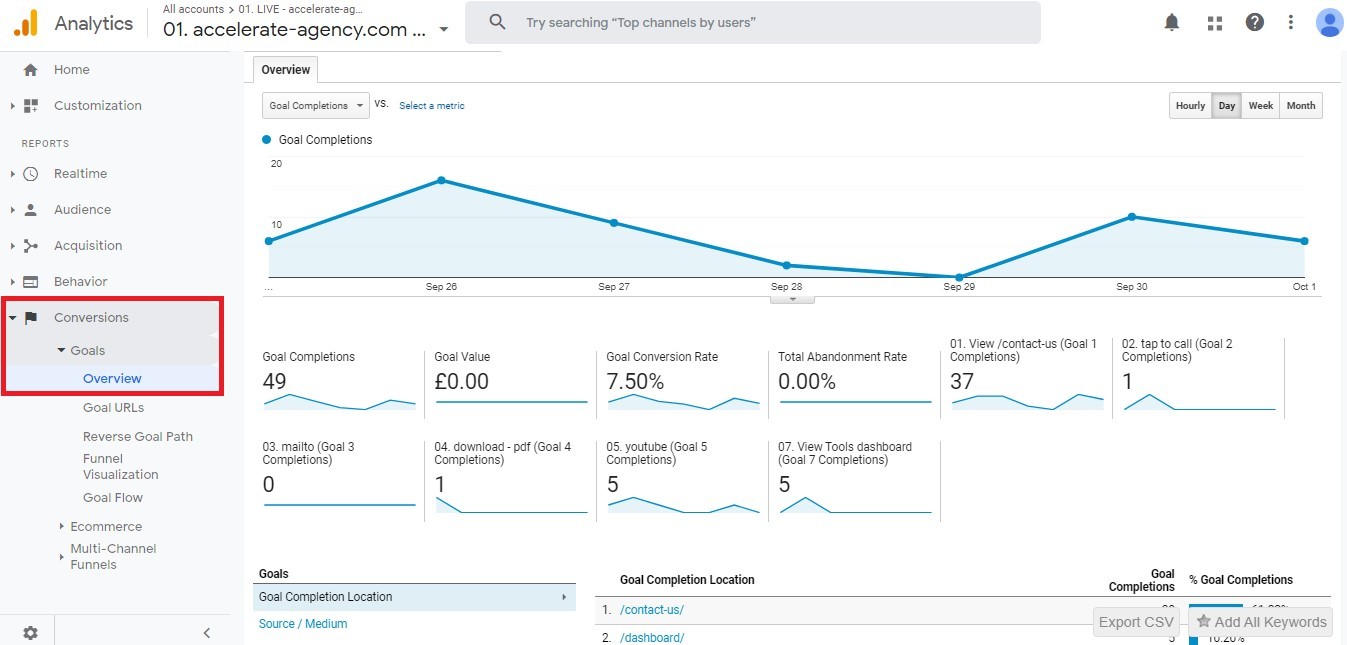
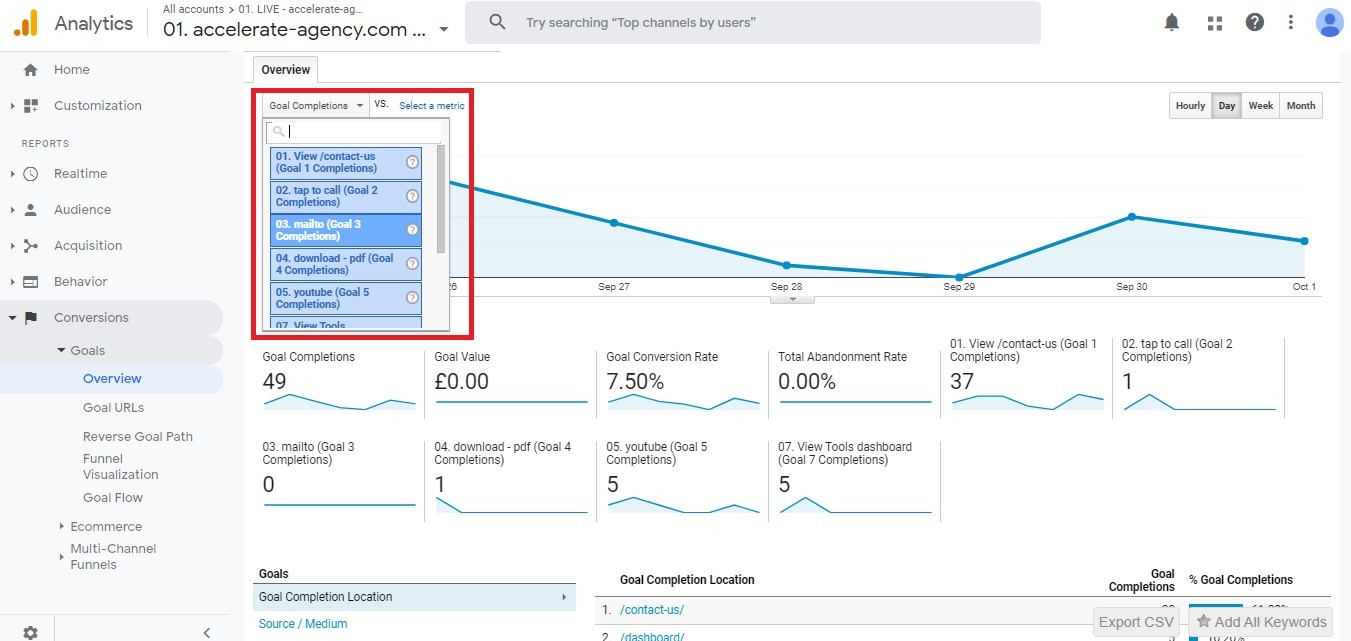
‘Goals’ is the main section of this dashboard. It’s here that you find reports into conversions for the different goals you may have configured. As standard, the overview report shows you total goal completions for your site as well as how they split between different goals.
You can also edit the overview report to focus on any one of your goals, via the dropdown menu shown below:
Handy Tip: Tracking Your Rivals
Using the dashboards described above can help you get a good handle on many aspects of your site. It can help you smarten up your content and sharpen your marketing, alongside making many other improvements. Getting a proper handle on your competitors is something else that can help you do that.
You can do precisely that with the Semrush Traffic Analytics tool. The handy tool lets you view and track metrics for your rivals’ sites. Many of those are similar to the metrics that Google Analytics enables you to measure for your own. There is a broad range of invaluable information the tool can give you — both about your closest competitors and about your niche in general.
The Top Pages feature of Semrush Traffic Analytics, for instance, is one of the most useful. It helps you get to grips with how the different areas of a rival’s site are performing. You can see the unique visits each page receives, which allows you to gain plenty of useful insights. For one, it shows you how your similar content is performing in comparison.
Market Explorer, meanwhile, gives you an overview of your entire industry. It will show you who your competitors are, as well as providing more general details of the niche. You can see, for example, how seasonality affects your industry. You can also explore which marketing channels are most relevant to your market.
Other areas of the tool are equally helpful. You can check out how much overlap there is in your site’s audience and that of your rivals. You can even get a detailed view of where a competitor’s traffic is coming from. Alongside what Google Analytics tells you about your site, these details can truly help you move your firm forward.
Conclusion
You’re now ready to start tracking your site data with Google Analytics. You know what the platform’s all about and how to get it set up. You should also have a good idea about the different ways you can use it to help your site. From tweaking marketing campaigns to improving site content, Analytics can help you in many different areas.
What makes the platform so useful is that it delivers tangible data. You can get data on your site and your users. This data provides you with concrete insights you can use to develop your business further. Now that you’re up to speed with Google Analytics, those insights are at your fingertips.

Innovative SEO services
SEO is a patience game; no secret there. We`ll work with you to develop a Search strategy focused on producing increased traffic rankings in as early as 3-months.
A proven Allinclusive. SEO services for measuring, executing, and optimizing for Search Engine success. We say what we do and do what we say.
Our company as Semrush Agency Partner has designed a search engine optimization service that is both ethical and result-driven. We use the latest tools, strategies, and trends to help you move up in the search engines for the right keywords to get noticed by the right audience.
Today, you can schedule a Discovery call with us about your company needs.
Source:

