

Just a few months ago, we covered how to prepare for the 2021 Core Web Vitals update.
The update is already here. It was released back in June 2021. Unlike the rest, its rollout is expected to span across a few months, so it’s too early to assess the full aftermath.
Yet, as we pass the first half of the update, which is supposed to fully launch in August, we decided to take a look at some preliminary trends.
The Page Experience Update: A Brief Background
The Core Web Vitals (CWV) are a part of Google’s Page Experience Update, which puts a great deal of emphasis on user-friendliness signals that determine pages’ rankings.
CWV is essentially a bundle that unites the following metrics:
Largest Contentful Paint (LCP) measures the render time of the largest image or text block visible within the viewport relative to when the page first started loading. Cumulative Layout Shift (CLS) measures a page’s visual stability. First Input Delay (FID) measures interactivity (how quickly users can interact with the elements on a page).For more detailed Core Web Vitals coverage, go through this post.
Core Web Vitals Update: Measuring the Interim Impact
The Summer of 2021 was pretty rich for updates. So it’s important to remember that on top of the extended Page Experience update, we also saw two broad core algo updates in June and July, as well as an Anti-Spam Update.
Although SERPs could have been influenced by factors other than the Page Experience Update, we wanted to assess the initial impact of the arrival of Core Web Vitals, so we used the following methodology:
We took over 2,500 random keywords from Semrush Sensor’s US database to collect the top 10 results from SERPs on both desktop and mobile web. We collected these SERPs for the following dates: Jun 8, 2021(before the start of the rollout), Jun 21, 2021(straight after the rollout), and July 15, 2021 (roughly one month into the rollout). We measured the Core Web Vitals metrics* for all the URLs that made it into the top 10 search results, comparing the values for the three dates.To explore some potential mobile SERP shifts, we analyzed over 18,000 URLs in June before the update and after the update, as well as in July. To assess the state of desktop SERPs, we analyzed over 19,000 URLs for the same timeframes.
This post reveals what differences we managed to pinpoint thanks to the analysis of all the retrieved data. For this study, we used both lab and field data, with the latter having a ranking impact.
Before we deep dive into the findings, we have to underline the key differentiating points between field and lab data:
Field data is based on stats coming from real users, who each use a unique device and network connection to visit the page. Lab data is collected using a controlled environment, where device and network connection settings are predefined. Lab data emulates a Moto G4 mobile phone with a high-speed 3G connection.This implies that field and lab data will likely return different CWV scores.
*Please note that we measured Total Blocking Time (TBT) instead of First Input Delay (FID) for lab data analysis. FID requires data from real users and hence cannot be measured in the lab. However, per Google, the lab-measurable TBT metric correlates with FID in the field, reflecting interactivity-related issues.
What Changed Half-Way Through the Update
Revealing the Key Discoveries
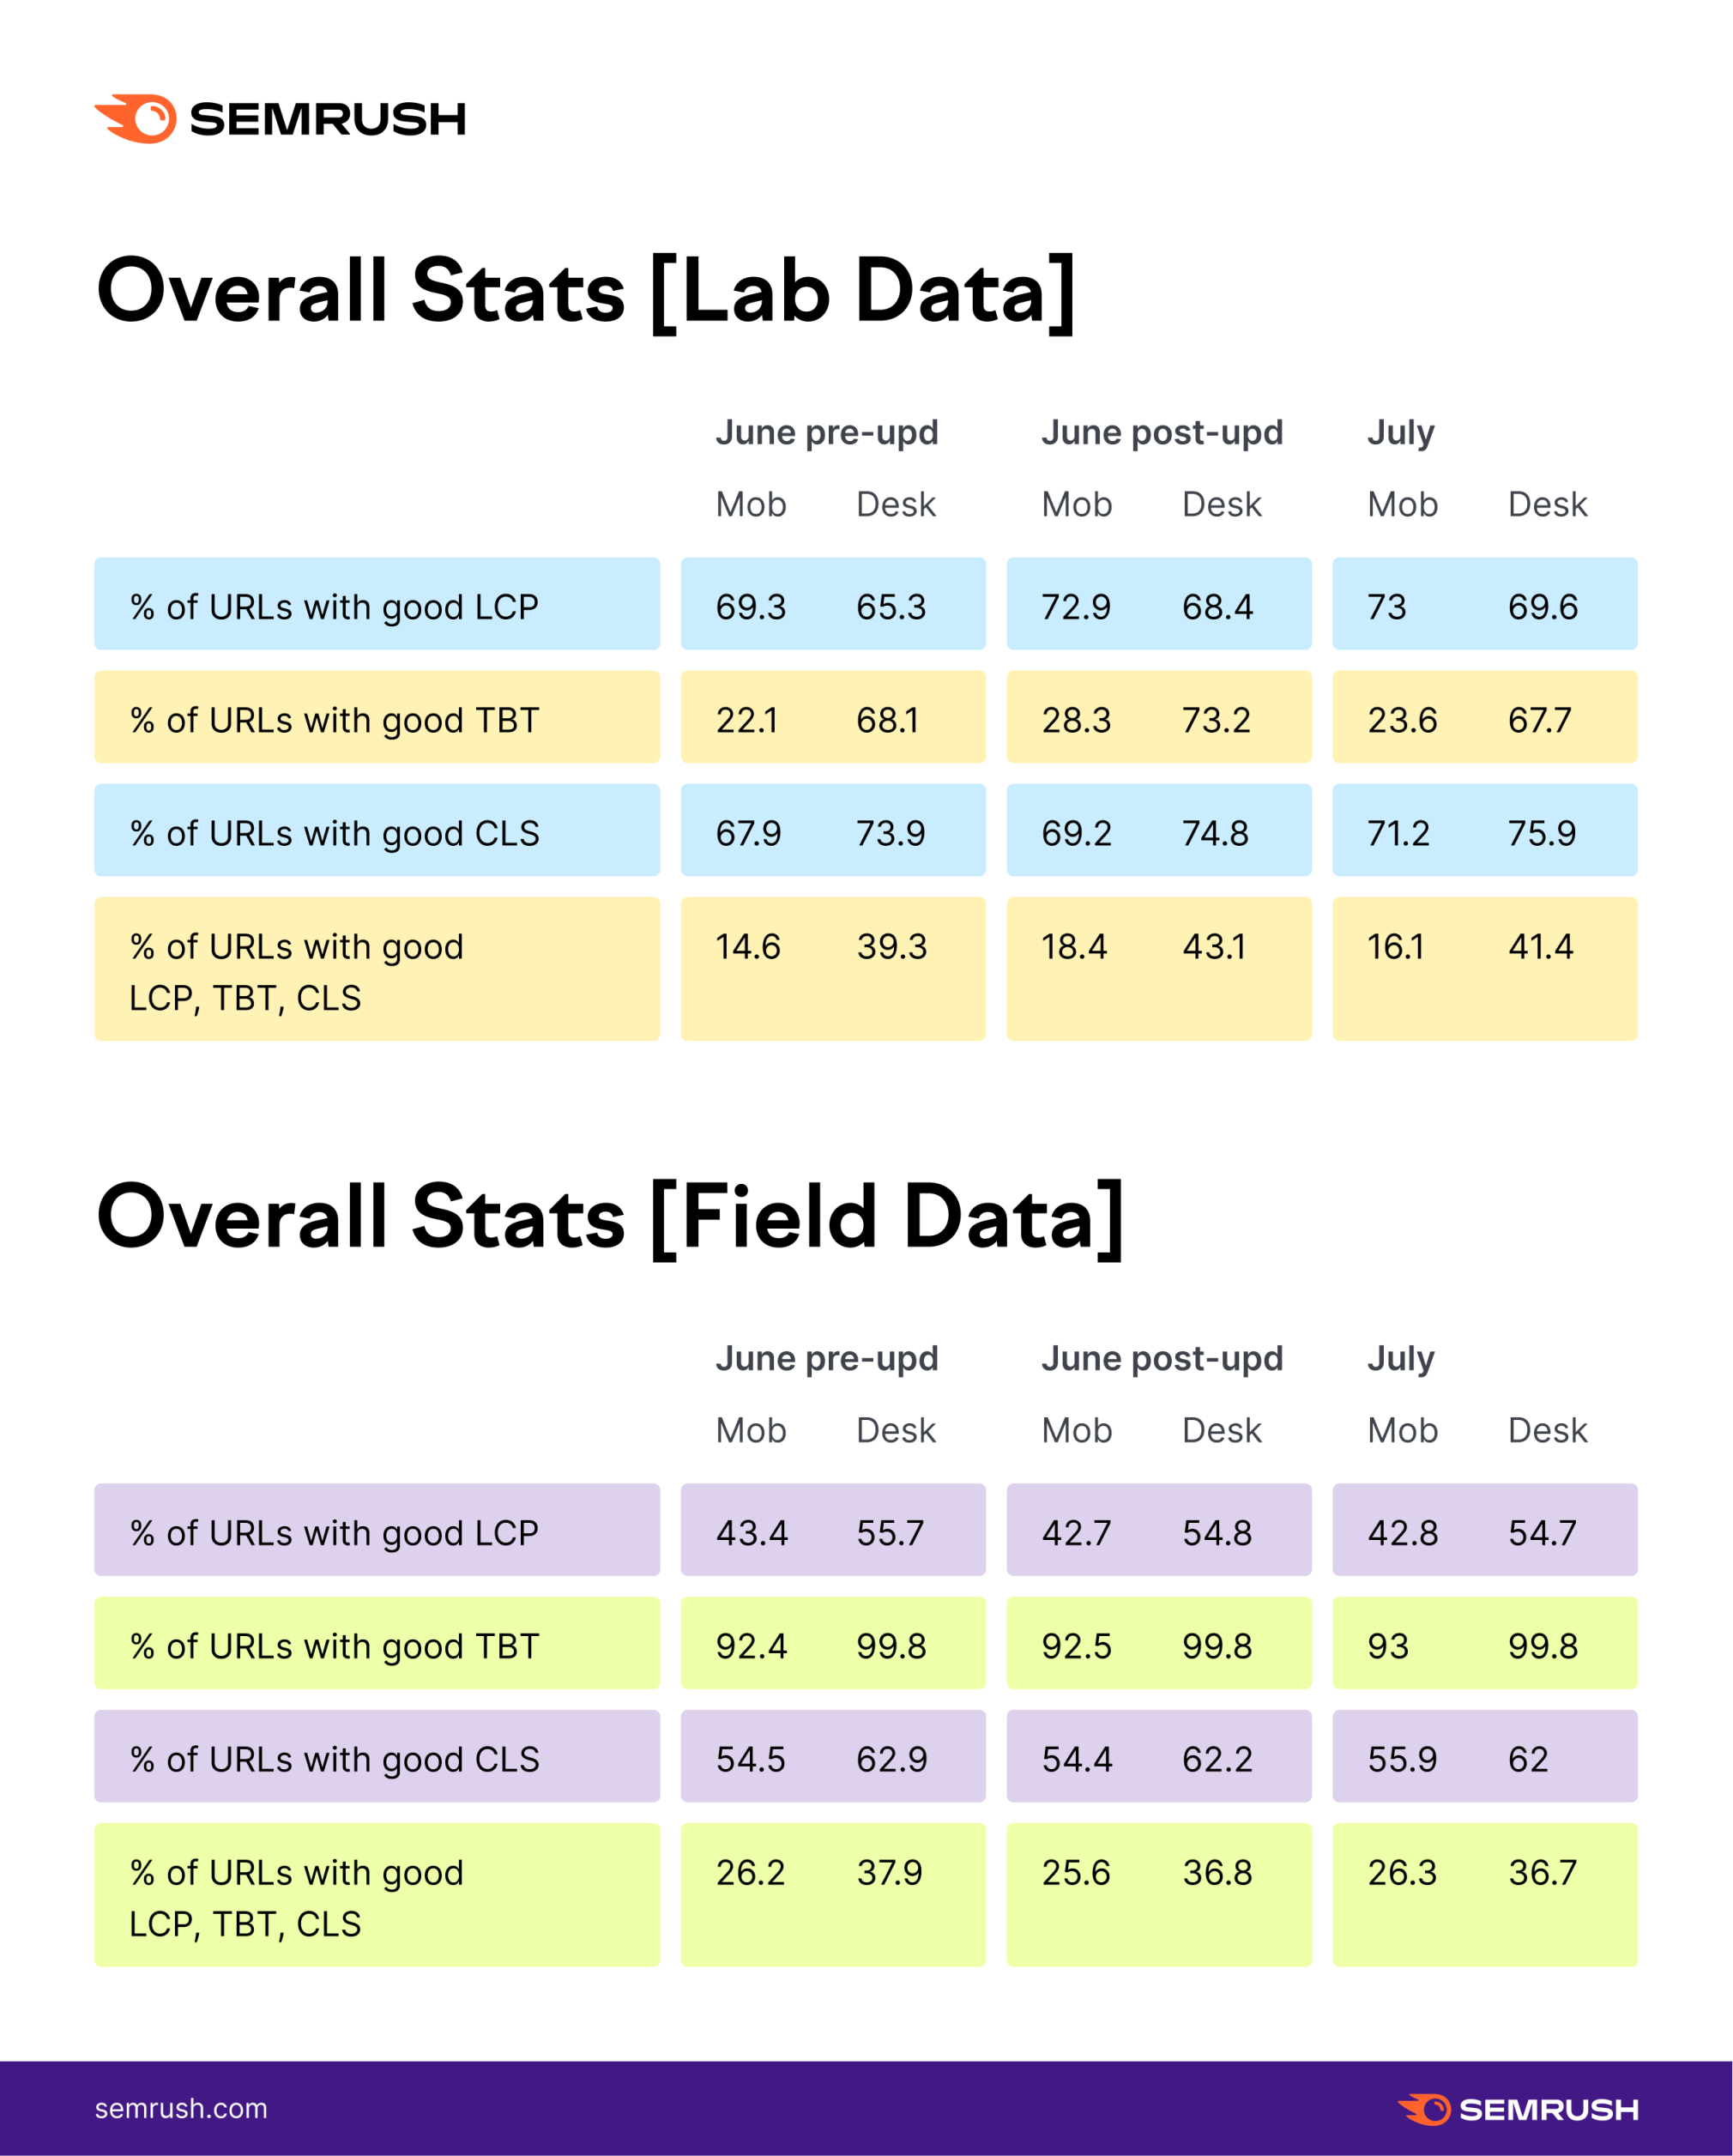
We spotted no dramatic difference between the post-update data for June and July. Field data** confirms that the overall situation didn’t change much. However, there are some smaller details we observed in the lab stats. According to lab data, the overall share of URLs that come with all metrics marked as ‘Good’ increased for both mobile and desktop.**It takes up to 28 days for field data to renew its stats, so stay tuned for the next edition of our study to see if field data returns different numbers.
Here is a breakdown of all the stats for both lab and field data:
Revealing More Detailed Findings
Mobile SERPs Data
Distribution of URLs for each CWV metric
Field data indicates very minor changes to all three metrics we measured before, after, and one month into the update.
The majority of URLs have ‘Good’ values for FID and CLS metrics. With LCP, we see as many pages within the ‘To improve’ range as within the ‘Good’ range.
Lab data, however, allows us to get a more nuanced look:
Since the start of the update, the number of pages that were within the ‘Good’ LCP range kept increasing, while those marked as ‘Poor’ had a fading presence across mobile SERPs. But the spotted changes were by a small 3% margin, not a statistically significant number, so this does not allow us to come to any grand conclusions. With TBT, the majority of URLs have ‘Poor’ TBT even after an update. But we can see that the share of ‘Poor’ pages decreased by 10% straight after the update, and then the numbers came back to pre-update levels in July. We see a similar ‘bounce back’ trend for URLs that have ‘Good’ TBT values. So far, this is merely an observation as it’s not yet possible to pinpoint any potential cause (if any). Pre-update, the majority of URLs come with a ‘Good’ CLS score, with a seemingly sustainable upward improvement trend in all three data sets.Assessing the correlation between Core Web Vitals and mobile rankings
While we did analyze the top-ranking URLs for how they stand in regard to CWV, this does not imply that they rank high thanks to good CWV values.
So the good old ‘correlation doesn’t mean causation’ logic applies to our analysis of the state of SERPs from a CWV perspective.
We took a look at URLs with ‘Good’ values for all three metrics and assessed which SERP positions they tend to take.
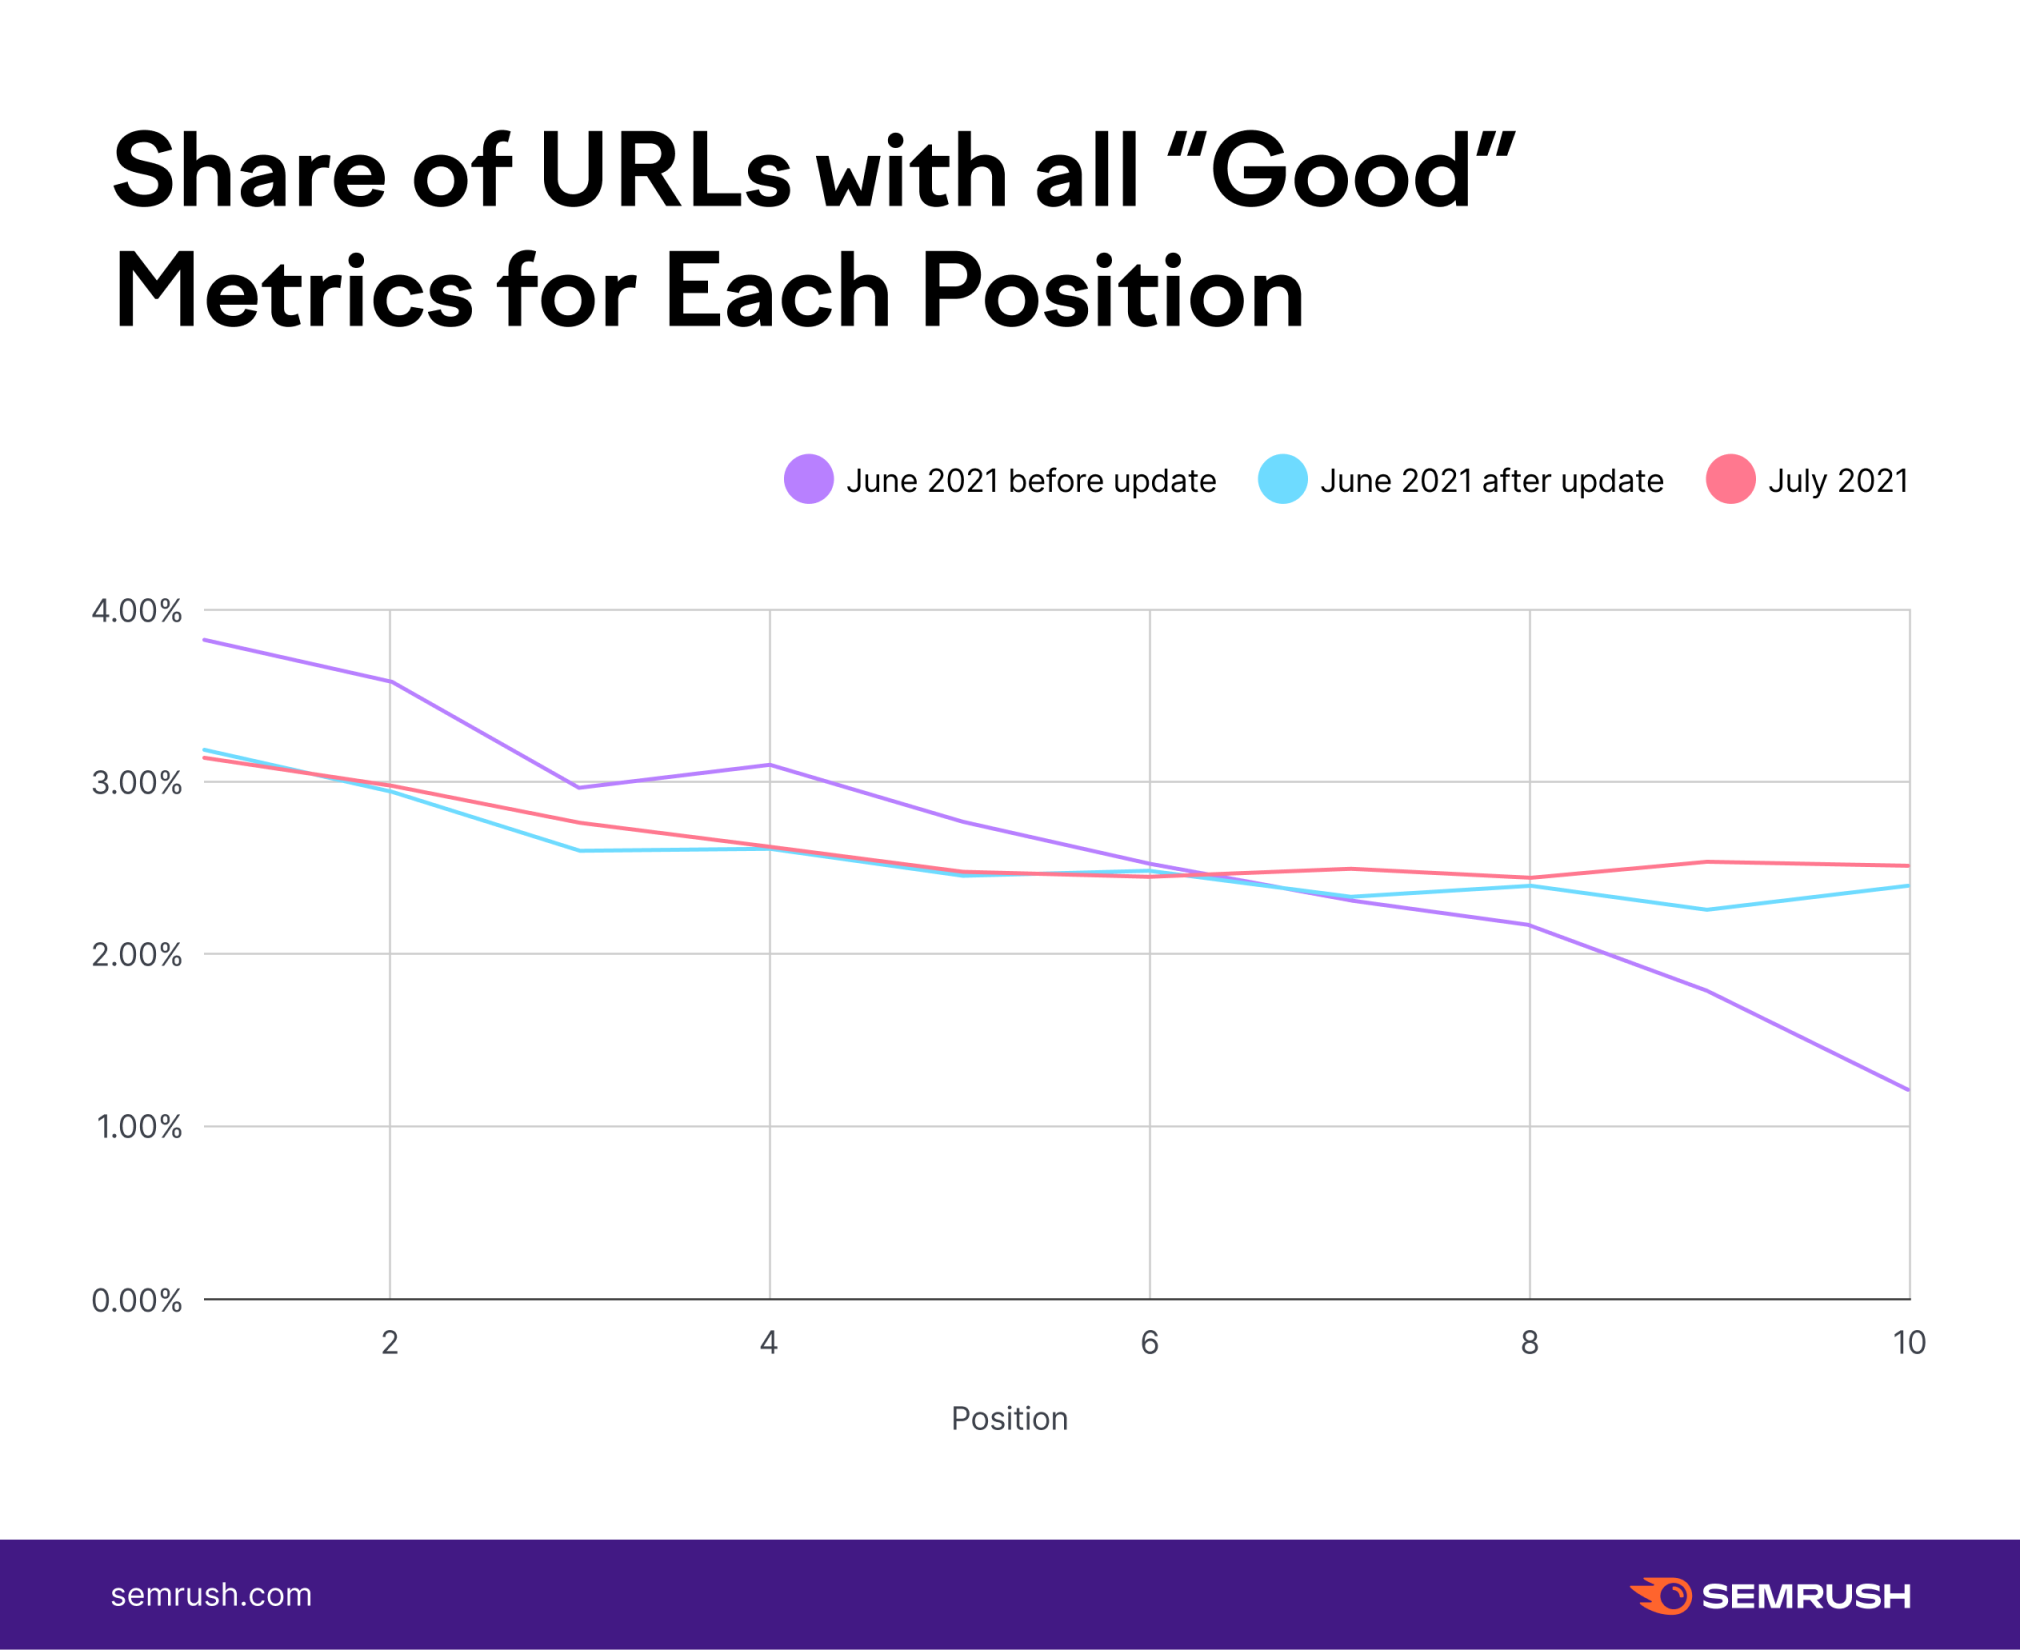
As filed data points out, before the update, the relationship between ‘Good’ values and positions was very straightforward – the fewer the share of pages with all ‘Good’ metrics, the further down the SERP.
Since the update, we can see that Google seems to be taking a delicate stance, leveling out the rest of the SERPs instead of changing the top rankings due to CWV factors.
But once again, this data does not imply that it is CWV-related factors that affect the SERPs.
Desktop SERPs Data
As the Page Experience Update now only applies to mobile search results, we predominantly focused on analyzing mobile SERPs.
But, as Google confirmed, it will roll out the update to desktop as well, so we also checked how desktop SERPs are doing in relation to CWV-friendliness.
Distribution of URLs for each CWV metric
As for the share of URLs that fall within the ‘Good’ range for all three CWV metrics, we see the following stats:
Lab data indicates that desktop SERPs return 10% more all-good URLs since the update. Field data shows a 3% decrease.Overall, desktop stats show a more obvious improvement trend for all CWV metrics compared to mobile:
The majority of pages ranking for the top 10 positions on desktop SERPs have ‘Good’ LCP. We can see a similar share of pages that are within the ‘To improve’ TBT range on both mobile and desktop SERPs. Unlike mobile data, the majority of desktop URLs have ‘Good’ TBT values. This is expected as it’s easier to pass the thresholds on desktop as mobile emulates a 3G network. But one month into the update, the metric’s values deteriorated by an insignificant 1.5% margin compared to the pre-update levels. The majority of URLs are within the ‘Good’ CLS range.The 2021 Core Web Vitals Update: What’s Next?
As you can see, interim data indicates that it’s too early to be assessing the impact of Google’s Page Experience update.
So far, we haven’t spotted any significant changes in rankings or managed to link them to CSW factors, so it’s hard to pinpoint any systematic patterns at this point. But some initial analysis may imply that there is a general improvement trend in regard to CWV.
Yet, we still have one more month to see the full rollout, and we sure will revisit our impact assessment after August once the update is complete. So stay tuned to our data studies to see the full analysis of the Page Experience Update’s aftermath.
In the meantime, while the update is still rolling out, make sure to utilize intel from tools like Site Audit (don’t forget to leverage site improvement ideas from the Performance Report), as well as field data from Google Search Console and PageSpeed Insights to optimize your website for the final stage of the Page Experience Update.
Innovative SEO services
SEO is a patience game; no secret there. We`ll work with you to develop a Search strategy focused on producing increased traffic rankings in as early as 3-months.
A proven Allinclusive. SEO services for measuring, executing, and optimizing for Search Engine success. We say what we do and do what we say.
Our company as Semrush Agency Partner has designed a search engine optimization service that is both ethical and result-driven. We use the latest tools, strategies, and trends to help you move up in the search engines for the right keywords to get noticed by the right audience.
Today, you can schedule a Discovery call with us about your company needs.
Source:


