Page load speed is the first thing you notice when you visit a website, but you will only notice it if the website is too slow. Page speed is a huge part of the user experience, so it is no wonder it has officially become a ranking factor for mobile searches and has been one for desktop for ages.
Numerous studies on the correlation between page load speed and bounce rates have come to some rather alarming conclusions: every millisecond counts. With our new website performance research, we wanted to add a silver lining to the daunting statistics and prove that there is plenty of room for improvement in your website performance.
Our research will help you structure your workflow when dealing with site performance optimization. In particular, we will show you what the most prominent mistakes are and which of them need that extra attention so that you can prioritize the process of fixing them.
Methodology
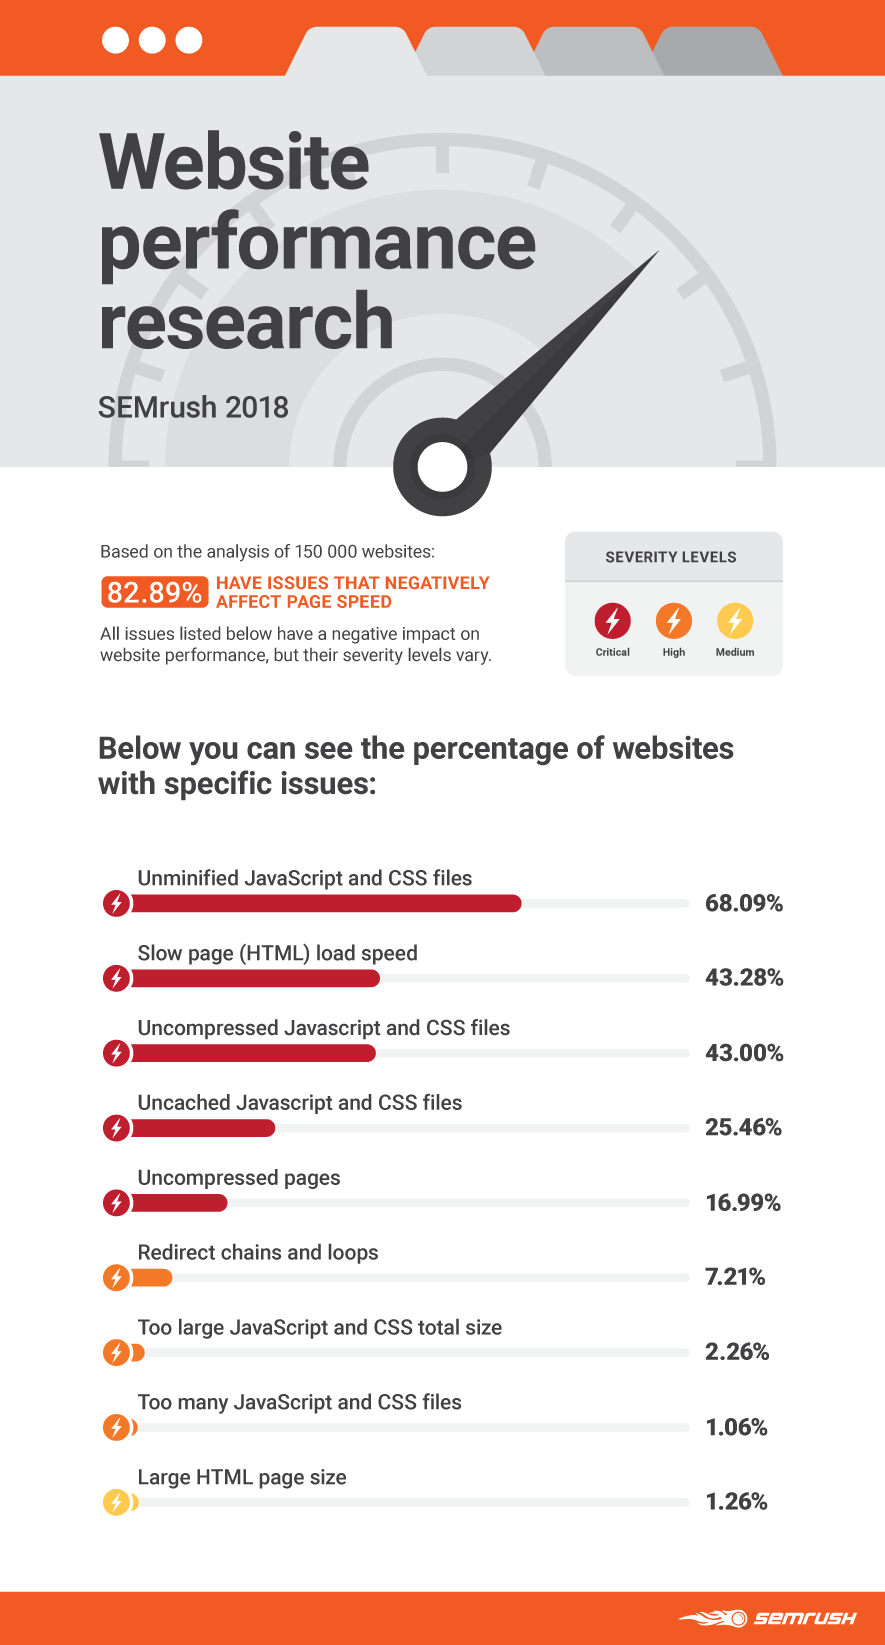
For this study, we analyzed 150,000 random websites (both desktop and mobile versions) to assess their performance. To collect the data, we used the new Performance report of SEMrush Site Audit, which provides handy statistics on the nine most common issues that affect website performance.
Surprising Results
Surprisingly for us, it is the first time we have seen a whopping 82% of analyzed websites have issues significantly affecting their performance. This makes performance-related issues some of the most common on websites.
Moreover, 44% of analyzed websites had at least one critical issue (according to our Site Audit issue severity classification).
On a positive note, we found that the majority of the websites experiencing performance issues can improve them using straightforward page optimization techniques and simple server configuration.
We are now going to take a closer look at the issues we found and suggest some of the tried and tested ways of eliminating them.

[ create-campaign bg_images="https://static.semrush.com/blog/uploads/media/a4/4f/a44f7a6614c3ee4fc6b627878d5be0ee/website-performance-research-semrush-2018-back-banner.png" bg_button="-success" header="Check out your website performance" text="with SEMrush Site Audit"]
We hope that this data will help you prioritize your work and estimate the number and severity of the issues, which can occur on your website.
Now let’s take a look at the process of addressing these issues.
To keep it simple, we will break down our recommendations into three groups:
Clean Up Redirects
Trim Down Page Size
Boost Server Performance
Clean Up Redirects
Let’s start with an easy one. Redirect chains and loops are classic issues that cause problems with website performance. If you don’t want to test your users’ patience with redirect chains and loops, try to avoid them on your website.
Moreover, redirect chains confuse bots; their crawling budget is limited, and with each redirect your page loses a little bit of its original rank. Below is a great video about redirects by Matt Cutts if you would like to learn more.

If a page contains 3 or more URLs or a loop, it is marked by our Site Audit as having an issue. Luckily, only 7% of analyzed websites had this issue, according to our study.
However, redirects from one page to another are often a necessity when rebranding or renaming a website, migrating it to HTTPS, reducing duplicated pages (e.g., “www” and “non-www” versions), and in many other cases.
The bigger and older your website grows, the harder it becomes to keep its structure clean. Redirects tend to pile up and create chains; the more links there are, the longer it takes to get to the destination page. This is why you need to be extra careful when implementing ‘necessary’ redirects.
Trim Down Page Size
The heavier the page and the more resources it contains, the longer it takes to load. It is important to make sure that your page size, as well as the total size of JS and CSS files (transfer size), doesn’t exceed 2MB.
In our Site Audit, anything above 2MB is considered heavy and causes an error to appear. Even though 2MB is enough for a page to ‘live its life to the fullest’, 1% of the analyzed websites still had this issue. If you found yourself among the 1%, we recommend you put your page on a diet and keep its size at least under 2MB.
Images and Videos
Images and videos make up the largest part of a page’s weight, so that should be your starting point. Changing the format, resolution, or quality of your visual content can significantly downsize the page. Start by asking yourself if these visuals bring any real value and remember that sometimes less is more.
JavaScript and CSS
Our research revealed a disappointing 68% of websites with unminified JavaScript and CSS files. By minifying your JavaScript and CSS files (removing unnecessary lines, white space, and comments from the source code), you will reduce the size of your resources and hence their load time, providing a better user experience and improving your search engine rankings.
JavaScript Code Minification Tools and Methods
JavaScript code minification can be done using two popular tools -- JSMin and YUI Compressor. The YUI compressor can also minify CSS. Closure Compiler is another handy tool that parses your JavaScript, analyzes it, removes dead code and rewrites and minimizes what is left. Obfuscation is another method of size reduction, slightly more effective than minification, although a little more risky in terms of generating bugs as a result of the obfuscation step itself.
In addition to minifying scripts and styles, don’t forget to compress HTML, CSS, and Javascript by using schemes like gzip or deflate. This will reduce their size by half or even more.
According to the State of JavaScript and Page Weight reports, which provide statistics on the use of JavaScript and CSS on the web both for mobile and desktop experiences, an average webpage contains 25 resources requests (20 JS requests and 5 CSS requests, respectively).
Our Site Audit tool will mark a page as containing ‘Too many JavaScript and CSS files’ only if it has more than 100 resources, and this is quite a lot. Still, 1% of analyzed websites turned out to have too many JavaScript and CSS files! Make sure you don’t overload your page with JavaScript and CSS files. Generally, the fewer requests you receive, the better, so by keeping this number under 100, you are on the safe side. Also, consider merging multiple CSS and JS files into single files to speed up the loading process.
You will find a lot of useful information on condensing your website in the following resources:
Why Performance Matters by Google’s Web Fundamentals
Optimizing Content Efficiency by Google’s Web Fundamentals
Best Practices for Speeding Up Your Web Site by Yahoo
Tips for Authoring Fast-Loading HTML Pages by Mozilla
11 Tips to Optimize JavaScript And Improve Website Loading and Rendering Speeds by Upwork
Boost Server Performance
One of the reasons for a slow page load speed is obviously a large HTML page size. However, as we figured out in the previous chapter, only 1% of analyzed websites turned out to have a large HTML page size. So where do the other 42% of slow page load speed issues come from? Very often, this is due to server issues.
If the web server is lacking efficiency, the web page that you are trying to access will also load slowly. You need to review your hosting service and the package provided; if it is inadequate, change the provider or consider getting a dedicated server. Learn more about the factors that contribute to a fast hosting package here.
The same goes for mobile websites. In fact, for mobile sites, the page speed factor is even more critical as they are often used by those on the go. This calculator from Think with Google will help you estimate how improving your site speed could impact your revenue.
There are other factors which may slow down the response of your server, such as slow application logic, slow database queries, slow routing, frameworks, libraries, resource CPU starvation, or memory starvation. Use these recommendations by Google Developers on how to handle these issues and improve server response time.
As our research indicates, 25% of analyzed websites have uncached Javascript and CSS files. This issue is triggered if browser caching is not specified in the response header. Simply put, failing to enable browser caching will make users download the same files each time they visit your page.
Enabling browser caching for JavaScript and CSS files allows browsers to store and reuse your page’s resources without having to download them again when requesting your page. That way, the browser will download less data, which will reduce your page load time.
Overall, this simple fix could make as much as a quarter of the websites investigated perform significantly better.
Start Fixing
There are many factors that add up to the eventual page speed, and dealing with all of them manually is an unbearable chore, but you can always turn to specialized tools.
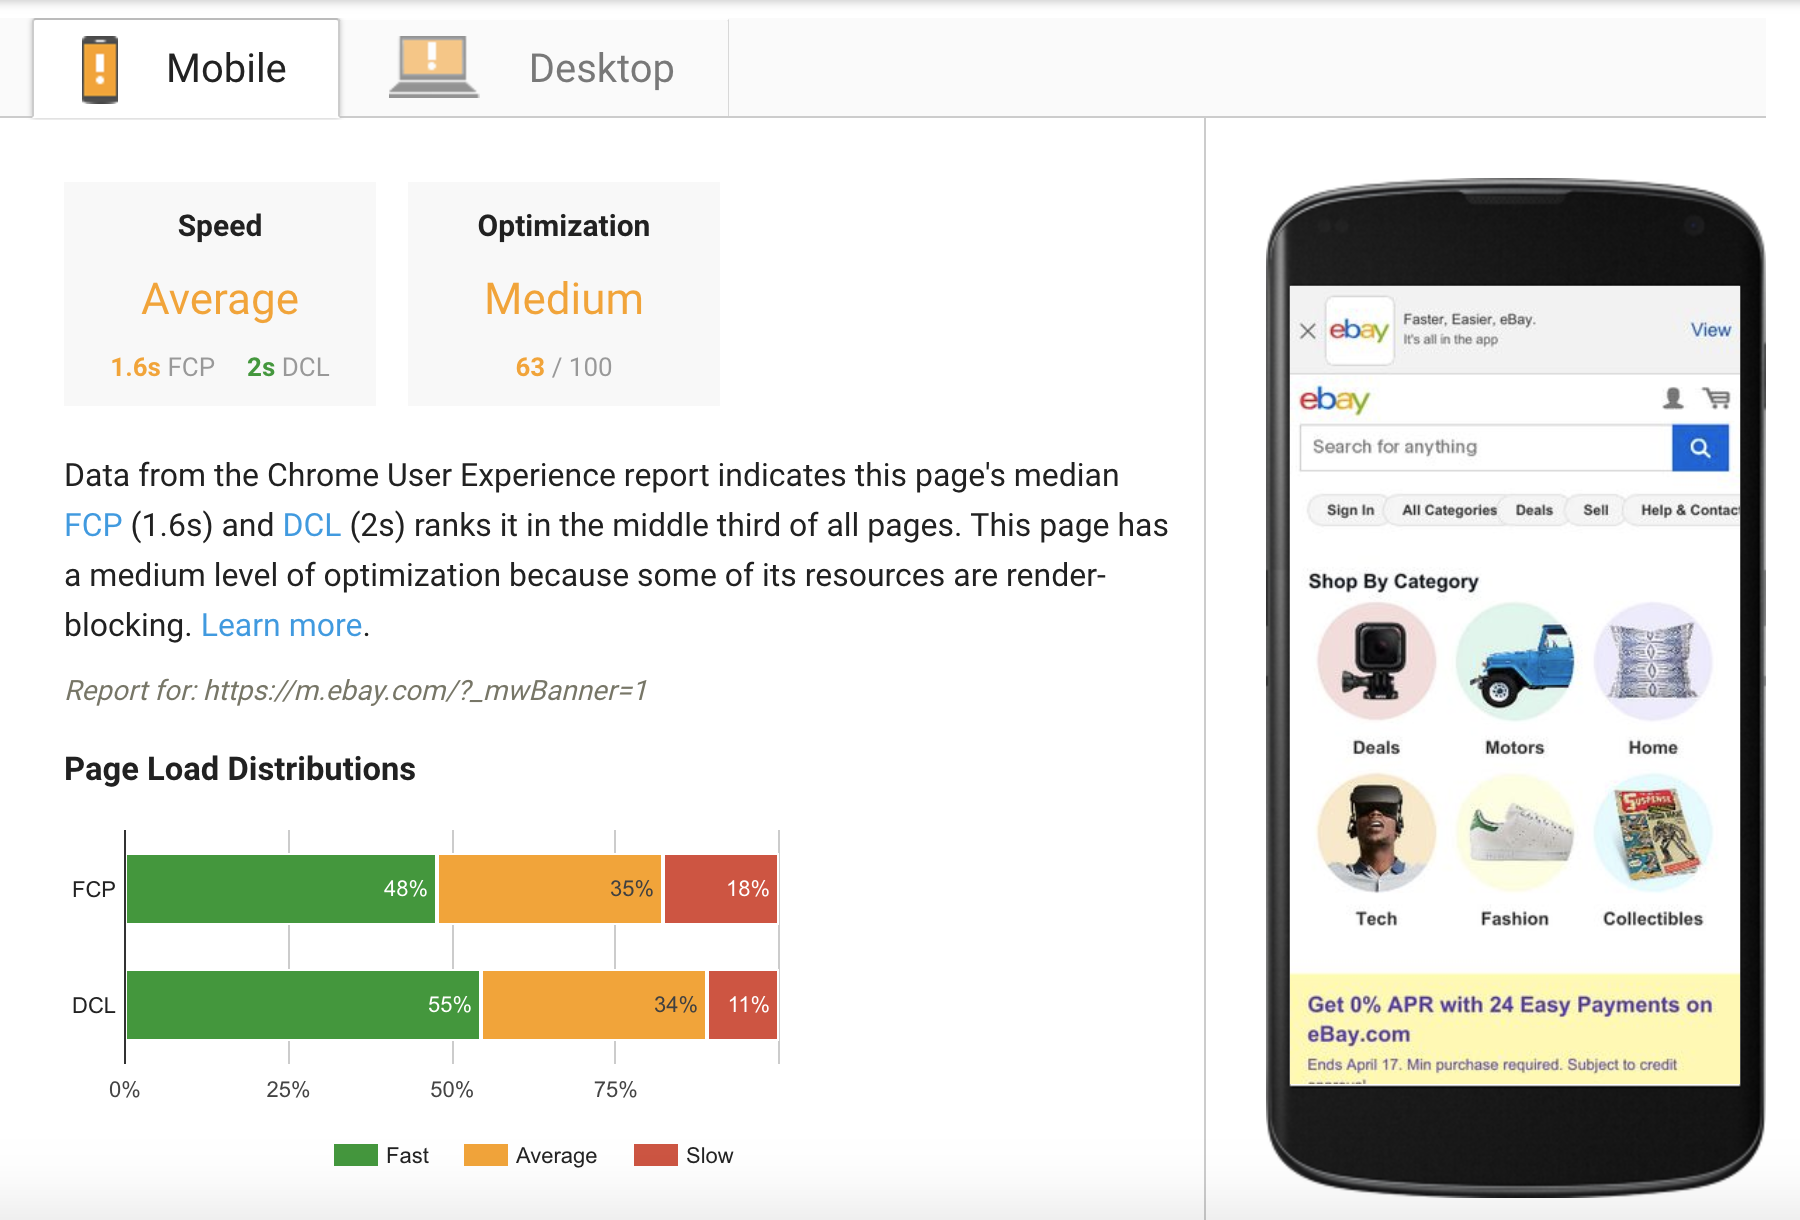
Google’s PageSpeed Insights is a great one to start with; it is free, functional, and provides reports for both mobile and desktop versions of your site. An added benefit is that it focuses on the issues deemed important by Google itself.

Google uses the data from Chrome users' experience of the page to assess if it is Fast, Slow, or Average in terms of loading speed. Unfortunately, this means you will only be able to get information on websites that get enough traffic from Chrome users for analysis', and smaller websites might get the Unavailable result.
For Slow and Average results you will be provided with Optimization Suggestions, which is a list of best practices for speeding up the page. This list is definitely worth looking into, although it should be taken with a grain of salt; chasing the perfect score might lead to wasting your time, and creating a bad user experience.
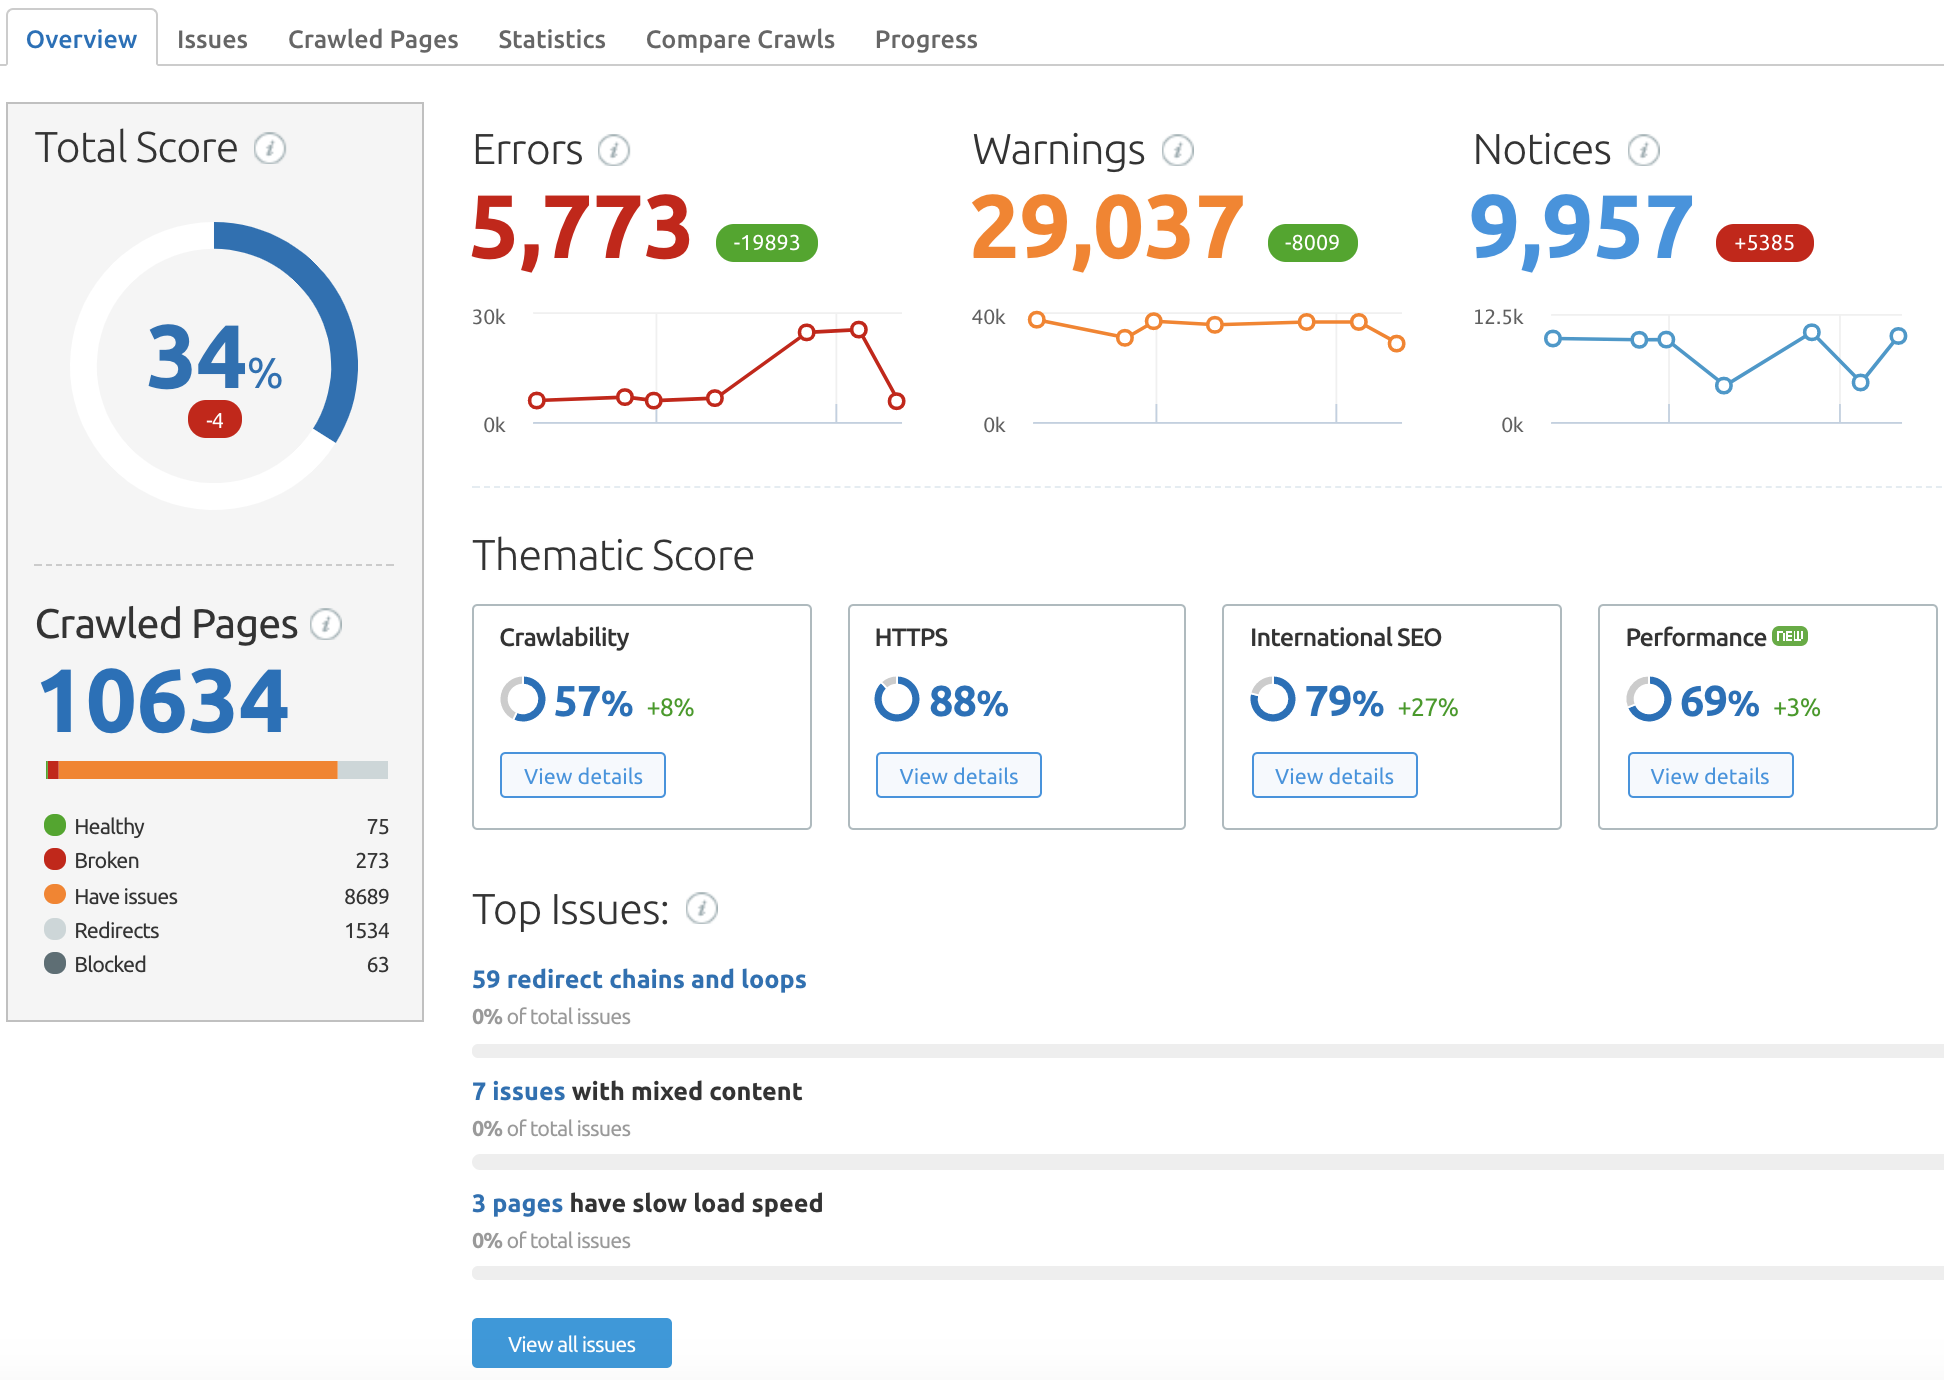
For a thorough and flexible site analysis that also goes far beyond performance issues only, we suggest the SEMrush Site Audit tool:

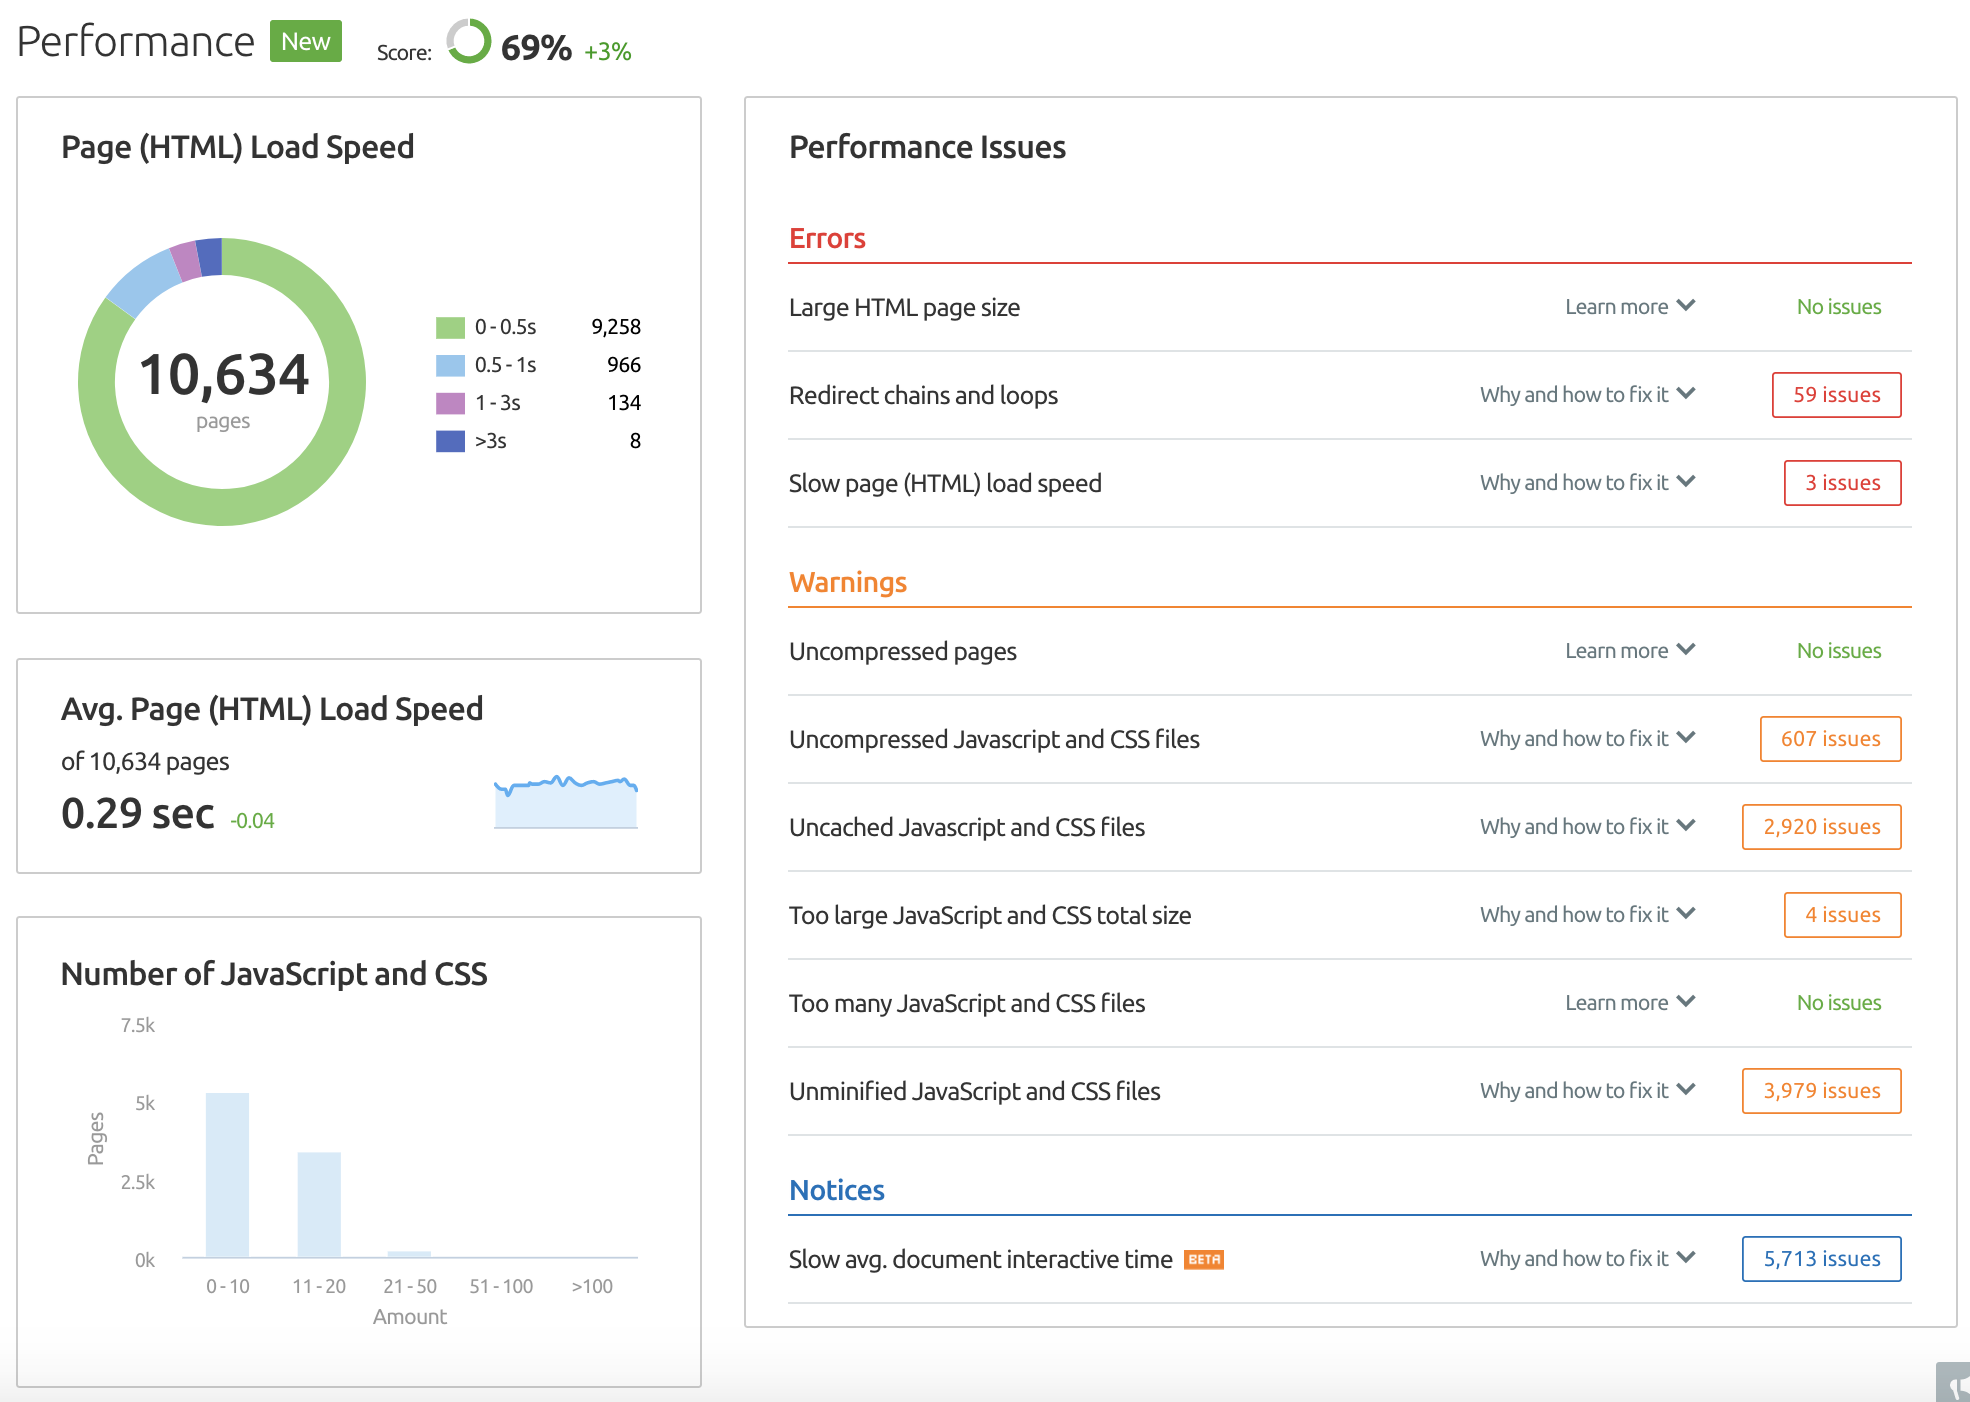
SEMrush Site Audit Performance Report will provide you with statistical graphs to get an overall feel for your website’s technical problems; its tooltips will explain what each issue is about, and how you can fix it.
The list of issues is divided by severity into Errors, Warnings, and Notices; this will help you to sort out the most critical mistakes first.
Performance Report also allows you to connect your Google Analytics account to get more information on user experience (Google Analytics Avg Page Interactive Time):

As you can see, with tweaking and configuration, speeding up your website is fairly simple. Test specific parts of your website, use thematic reports, and follow our recommendations to save your resources, and get the best results with the least amount of effort. Also, you can always track your progress by monitoring your Performance Score at the top of the report.
Please use the comments section below to share your best practices for improving your website speed. Also, feel free to share links which can help other website owners in fixing their website performance issues - let’s collect a useful library.
[ create-campaign bg_images="https://static.semrush.com/blog/uploads/media/a4/4f/a44f7a6614c3ee4fc6b627878d5be0ee/website-performance-research-semrush-2018-back-banner.png" bg_button="-success" header="Check out your website performance" text="with SEMrush Site Audit"]
Innovative SEO services
SEO is a patience game; no secret there. We`ll work with you to develop a Search strategy focused on producing increased traffic rankings in as early as 3-months.
A proven Allinclusive. SEO services for measuring, executing, and optimizing for Search Engine success. We say what we do and do what we say.
Our company as Semrush Agency Partner has designed a search engine optimization service that is both ethical and result-driven. We use the latest tools, strategies, and trends to help you move up in the search engines for the right keywords to get noticed by the right audience.
Today, you can schedule a Discovery call with us about your company needs.
Source:


![Website Performance Research [Semrush Study]](https://allinclusive.agency/uploads/images/website-performance-research-semrush-study.svg)

![15 Most Challenging Tasks of Content Marketers [Semrush & CMI Joint Study 2018]](https://allinclusive.agency/uploads/images/15-most-challenging-tasks-of-content-marketers-semrush-amp-cmi-joint-study-2018.svg)
