


Mining GSC: Using Query Language to Build Powerful Reports and Gain Instant Insights
Modified Transcript
When an SEO consultant joins Type A Media, the first thing we get them to do is get really good at spreadsheets. So, that includes everything from VLOOKUPs, to index match, to pivot tables — you name it. I want you to be able to get big clumps of data in, and very quickly be able to analyze them.
The great thing about using Google Sheets to do something called QUERY, which is kind of like a pseudo-SQL type of language, and I am gonna show you all the SEO tips and tricks I have got using QUERY inside of Google Sheets to make your data analysis life way, way easier.
So, I think we have all been in a position where we get a bunch of search console data in, and we can see our keywords, but the thing is when you get 5,000 keywords, it is kind of hard to actually work out what to do with this data.
Using a Table: How it Works
I mean, there are some obvious things, right? I mean, you could stick it in a table. That is relatively straightforward, so select the entire thing and stick it in a nice little filler table. And then we can know, you can start filtering through it, which is fine. You know, you have got filter by condition, so give me everything that is greater than 10,000 impressions, so I can see all the high-end stuff, and that will chop the data down.
Maybe I just wanna sort it by topic or something similar. So, in this example, these people sell lighting.So maybe I wanna see "text contains". Maybe I wanna see all the black products. Okay, there is not enough there. And when it comes to impressions you have to make changes again; can you see how this is not an ideal way to manipulate data in a table?
It doesn't really tell me anything, and even when I do get down to the things I wanna see, it is still really cumbersome and it physically changes how the data looks. I don't want that. I want my data to be preserved, and in one place. I want to be able to manipulate it almost as if I am creating a database.
QUERY
QUERY is something which is a pseudo-SQL style language which you can use inside of Google Sheets, andI am going to show you how to use it, so I am going to put this data back the way we found it, and we are going to jump into the next sheet to show you how you can very quickly get insights into massive datasets.
This is the way we found it, as we have exported it from search console. We then jump into QUERY language itself. So, what do we do? First and foremost, "=query(". So, the first thing we need to do is actually tell it what we want to query, and in this instance, we want to query our search console.
Now we actually need to give it a command (2:35 in video). What do we wanna do here? I need to give it the parentheses, and I essentially tell it, "Well, I want you to select everything in the table, which is a wildcard." That's the asterisks. "I only want you to select it where column A contains "black" because that is an easy differentiator. The term black."
We will close the parentheses and the brackets and hit enter, and before you know it, those 5,000 are now down to 81, and it is all the black variants of the product. And my original dataset is completely intact, with nothing hitting it.
Finding Position
Okay, so getting that data is all very well and good, and now what I really wanna do is kind of make it a bit more useful. Maybe I actually wanna see everything where the average position is actually on page 1. So, in this instance, all we do is go back into it, and we just say, "And, show me everything where column B is less than 10." Just like you do in a table, but really dynamically.
So, in terms of very quickly looking at, perhaps, a product range, and working out the places where you are already ranking well, and you want to start pushing it a little bit more, this is probably the place that you want to start looking. These are the target keywords that you wanna start optimizing and pulling in. Now, that is all very well and good, but what if we want something that's even more dynamic than that, but we don't need to constantly be pushing through tons and tons of formula?
Additional QUERY Computations
Okay. Well, let me take you to the next page of this. So, you are gonna notice here, that we have got a bunch of kind of top line pieces of information. So, the great thing about QUERY language is that you can actually do computation inside of it.
So, whereas before we just selected wildcards like everything, where A contains a keyword, now what I can do is say F it contains, let's say, a product variant. In this case, say people sell lamps or different colors of lamps and lampshades. And what it will actually do for me is it will average up absolutely everything. So, inside of this massive Google Search Console data that we have exported, I can get it to show me F (turned into a product variant) — it is a white lampshade. Or pertaining to a particular product range, I can get it to average out my position, my click-through rate, my clicks, my impressions, etc.
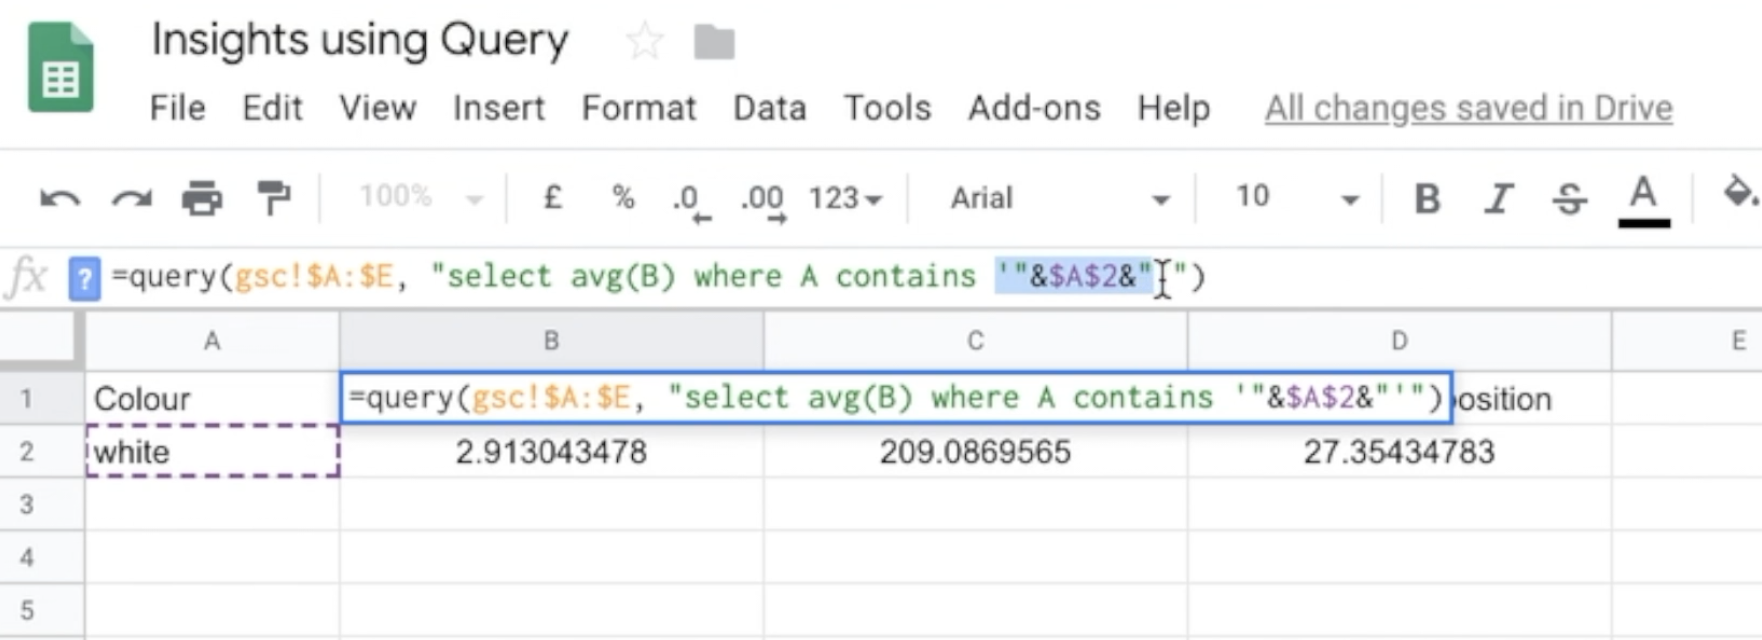
So I can actually art seeing a top-level view of product groupings inside of search console, which is really useful; and the way I do that is really super simple. All I am doing there is saying, again =query, and then it is GSE, which is my search console down here, and I am saying select the average of B where A contains ... and you see this thing here...
 Timestamp: 5:50
It is referencing the cell that has the colour "white", and what we can do here is say, "let's change that to the color black" and everything changes, because what it is now doing is looking for the color black.
You can also do certain product categories. For example, show me all the pendants, and all of a sudden all this stuff starts changing. So, you can very quickly query datasets and do computation on them literally with a couple of keystrokes instead of building out really overly complex sheets, and nested formulas, and arrays, and all that stuff.
More Computations
Now, this is all very well and good. But what about if I want to have this run but also, my initial query, what if I want it to reference? How do I change this data? Well, really simple. Let me show you.
 Timestamp 6:42
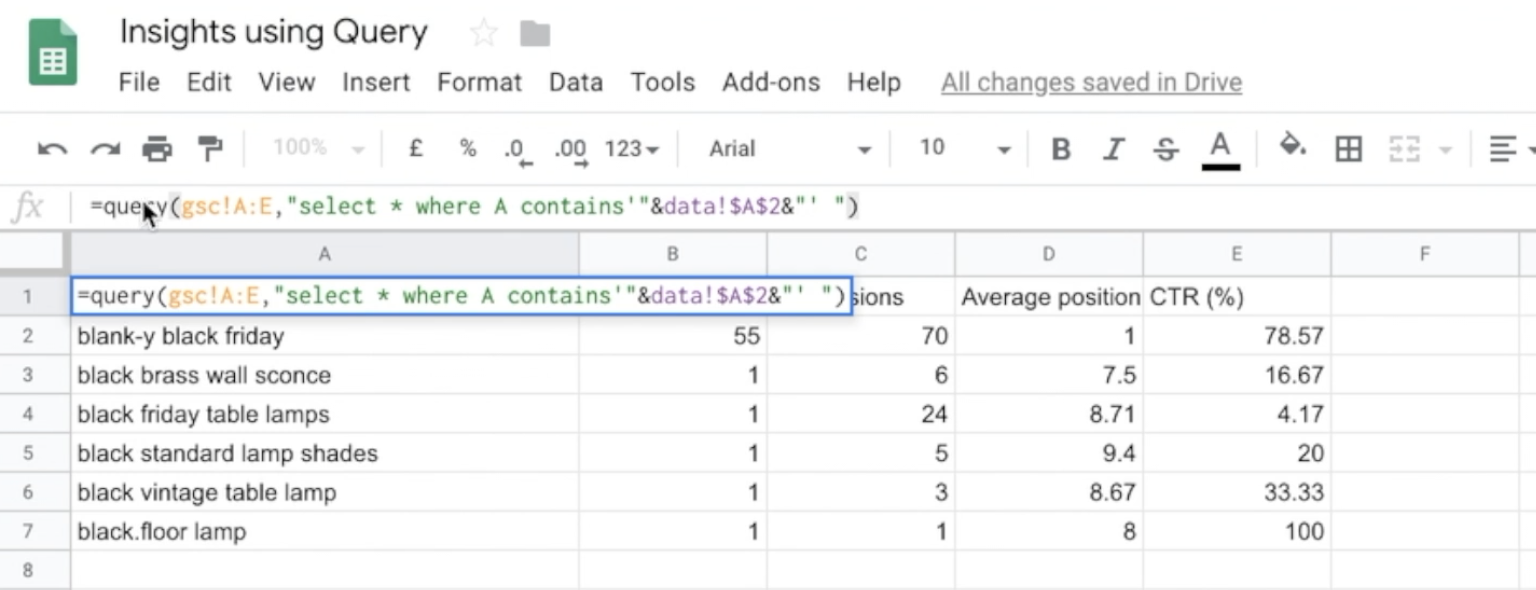
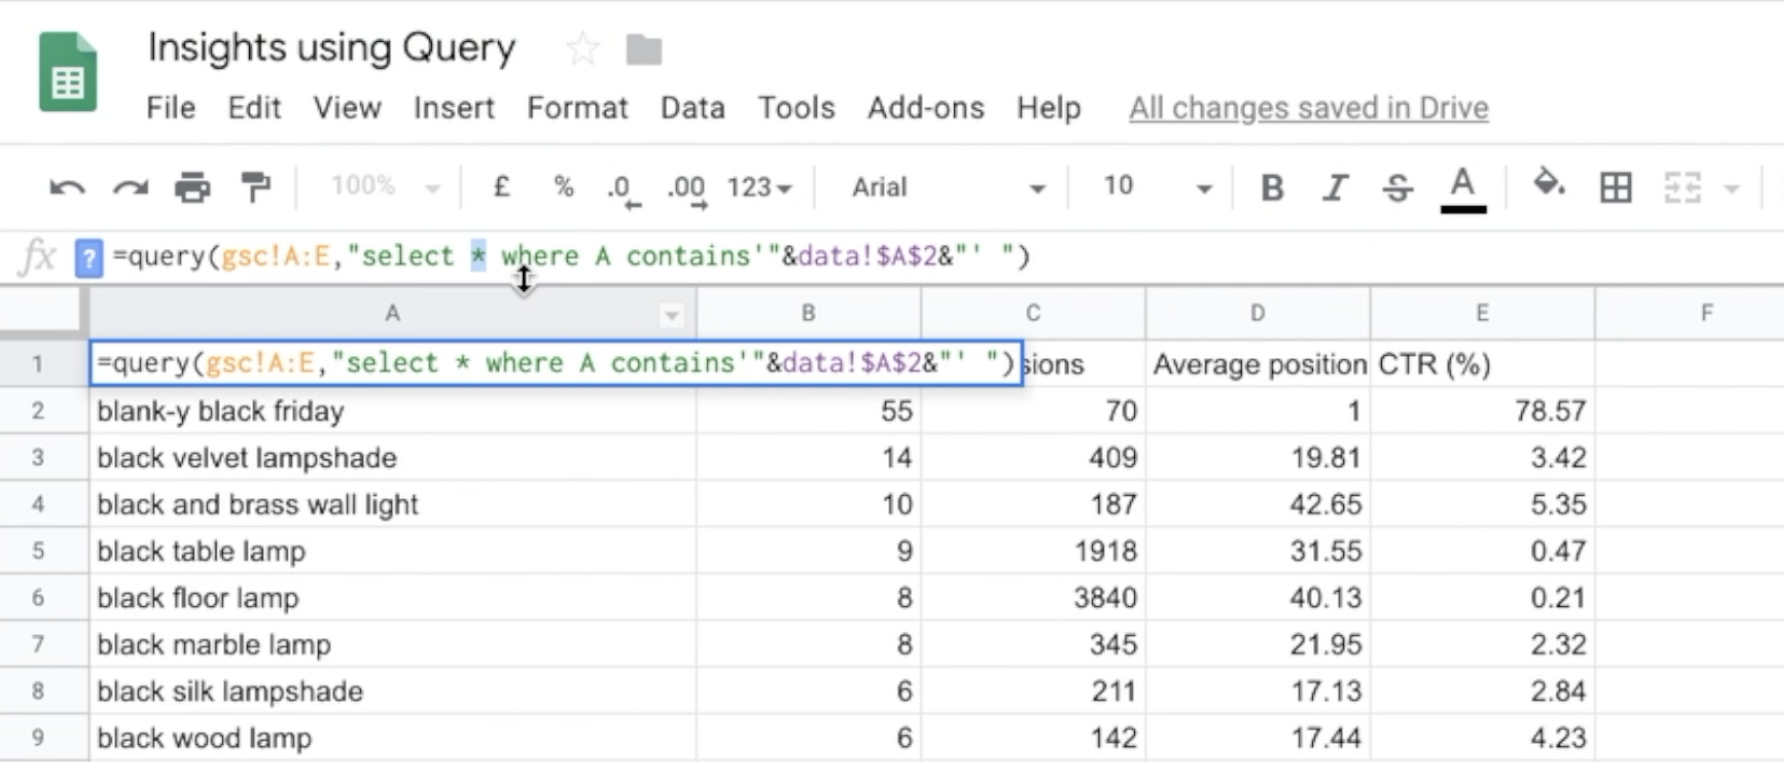
So, as before, =query, and then it is GSE A-E, which of course is referencing Google Search Console, and it says select star, which means wildcard, which means everything, where A contains, and then we have got this thing. It is like parentheses, ampersand, and then a reference to the datasheet and A2, and then that closing out. So, let's actually see what happens when we run that.
What it is doing is it is actually referencing this pendant keyword here, and it is giving us the data we want just about pendants. So, what happens if we then go in and perhaps change that to maybe a color variant? We get our top line numbers changing, which is great.
Also, it changes to black. You can start seeing how you can start to use this to very quickly manipulate data. Instead of doing your usual pivot tables, and constantly filtering things, and cutting the data out. We have been able to do this and get the exact data we need while preserving our core search console data so we can always refer to it, and always go back to it.
You can use this for building reports, mining data, or doing any kind of basic analysis, and just as a final recap, all you need to do is =query. You are then selecting the dataset that you are actually querying, and you are opening parentheses. It is really important that these two parentheses open and close everything.
Then, you are saying "select", and telling it what to select.
 Timestamp 8:00
You can give it different columns, you can give it the entire thing. And then you give a condition. Select everything where A contains my keyword. Really simple. And if you want to keep appending things on, that is really easy as well. We just put and, and "add on" and "add on".
So, for example, let's say I want to say where A contains the keyword black, that will be the same, 'cause it's the same query. And then if I want to say, "And the D>10 ", and what that is done is it's taken everything that's not on page one. It said show me where D is greater than 10, so show me where my average position isn't on page one, so it's chopped it down even more.
 Timestamp 8:56
You can literally just keep doing that, and doing that, and doing that.

And it will just keep chopping the data down, chopping the data down, chopping the data down. So, in this instance, when I am saying and D is less than 10, or E is less than 10, what we can actually do, instead of actually putting it in the formula, what we should probably do is link it, so if it is less than the average, or if it is more than the average, I want to see that so I can work out, "Well, if my click-through rate, or my impressions, or my clicks, are lower than the average for these keywords, I probably need to optimize them."
But I can do that in literally a heartbeat as I have just shown you. Hope you found this one useful, and for any comments, please leave them down below and I wil jump into the comments and answer any questions you have got about using QUERY.
There you have it. That's using QUERY to save a bunch of time on your data analysis, done.
Innovative SEO services
SEO is a patience game; no secret there. We`ll work with you to develop a Search strategy focused on producing increased traffic rankings in as early as 3-months.
A proven Allinclusive. SEO services for measuring, executing, and optimizing for Search Engine success. We say what we do and do what we say.
Our company as Semrush Agency Partner has designed a search engine optimization service that is both ethical and result-driven. We use the latest tools, strategies, and trends to help you move up in the search engines for the right keywords to get noticed by the right audience.
Today, you can schedule a Discovery call with us about your company needs.
Source:

![How To Create a Strategic Dashboard in Excel Using Semrush Data [Excel Template Included]](https://allinclusive.agency/uploads/images/how-to-create-a-strategic-dashboard-in-excel-using-semrush-data-excel-template-included.svg)
