

Google Analytics is one the most powerful tools for businesses. As a digital marketer, I rely on Google Analytics to help me glean valuable insights into the customer journey so I can measure the effectiveness and performance of marketing channels. With this data in hand, I’m able to provide actionable solutions for my clients.
However, knowing where to start in the Analytics interface can be intimidating if you’re not using it everyday. Another hurdle is knowing where to find data so that you know what’s working and what’s not working, or what needs to change to maximize your ROI.
One way I combat these issues is with Google Solutions Gallery. The Solutions Gallery is full of custom made reports, dashboards and segments designed to help users harness the power of Google Analytics. Use this free feature to organize data and schedule reports to save you time and make you and your account look good.
Gone are the days of spending hours clicking around in Google Analytics to remember what secondary dimension to select. With these custom reports and dashboards you will gain visibility into the KPIs that matter most to you. You can even have them delivered right to your email or exported into Excel, Google Sheets or PDF.
Top 5 Google Analytics Custom Reports
There are many custom reports in the Solutions Gallery, so I narrowed them down to my five must-have reports for digital marketers.
Occam's Razor Awesomeness
The first report comes from Avinash Kaushik, so you know it’s good. He shared a collection of his top “segments, custom reports and dashboards critical for any Analytics user.” This collection is the most popular report, with 112,656 imports. By importing this into your preferred Google Analytics view, you’ll receive six user segments, nine custom reports and one dashboard! If you only import one solution, this is the one you want.
Here’s what’s offered in this collection:
Advanced Segment — Oligarchs Advanced Segment — Loyal Visitors Advanced Segment — Visit via Search Queries w/ 4 Words Advanced Segment — Blog Comment Submitters Advanced Segment — Non-Flirts, Potential Lovers Advanced Segment — All Social Media Visits Custom Report — Visitor Acquisition Efficiency Analysis V2 Custom Report — Content Efficiency Analysis V2 Custom Report — Landing Page Analysis Custom Report — Hostname [Domains that have your GA code] Custom Report — All Traffic Sources ABO Custom Report — E2E Paid Search Report Custom Report — Search Traffic (Excluding Not Set, Not Provided) Custom Report — Internal Site Search Analysis Custom Report — Mobile Performance Analysis V2 Dashboard — VP, Digital DashboardLanding Page Analysis Custom Report
Vagelis Varfis of Nudge Digital built the next report. According to his description, “Landing Page Analysis Custom Report covers data such as metrics (e.g. new sessions, users, bounce rate, conversion metrics, etc.) and dimensions coming from the pages through which visitors entered your site.”
This report is great for reviewing how well your inbound strategy is performing, because you can easily measure your landing pages against key metrics. You will have a snapshot of which blogs or products are driving the most traffic and revenue. It also quickly gives you insight into the performance of your landing page optimizations and A/B tests that are running.
Sessions by Hour of Day [Custom Report]
Love Data created this custom report to provide an “aggregate view of Acquisition, Behavior and Conversions by Hour of Day.” It identifies strategic times during the day based on the performance of your website. It’s set up to work well for both lead generation and ecommerce websites.
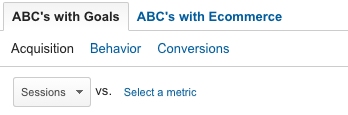 With this report, you will understand what time of day customers are coming to your website, their behavior and what time they are converting. I use this data when optimizing ad schedules for campaigns across different channels. I can focus ad spend on times of day when I know customers are more likely to convert.
End to End Paid Search Report
The End to End Paid Search Report was developed by the internal Google Analytics team, and is a must-have for ecommerce businesses running ads with Google AdWords. It compiles all your acquisition, behavior and outcome metrics in one report. The report includes impressions, clicks, visits, % new visits, CTR, Cost, CPC, RPC, Revenue and Transactions.
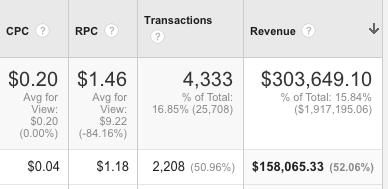
I really like analyzing AdWords campaigns by RPC (revenue per click) to see how much each click is generating in revenue. In this example, the campaign has an average CPC of $0.04 while the average revenue generated from that click is $1.46 (RPC). Being able to compare these two metrics side by side helps to determine the amount spent (CPC) vs. money earned (RPC) at a glance. This report is great for ecommerce businesses wanting to identify their high performing campaigns and to gauge which ones need more optimization.
Social Report
This report is perfect for social media marketers. Developed by Justin Cutroni, he describes it as, “content is king, but only if you know what it's up to. Learn what content from your website visitors are sharing and how they're sharing it.”
The Social Report contains all the social metrics you could ever want to see. With it you’ll be able to see which articles are getting the most social actions across Google’s networks, including Google+.
Here’s an example of how social actions for different blogs will appear:
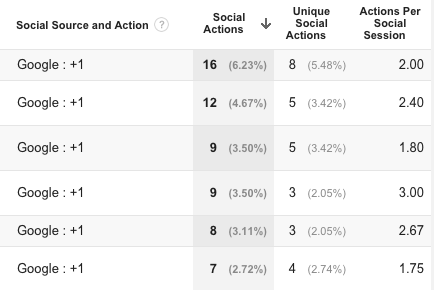
This is a valuable report when analyzing the social media micro conversions and understanding how people interact with your content. To track social actions on non-Google networks like Facebook or Twitter, you will need to set up Social Analytics.
Top 5 Custom Google Analytics Dashboards
Google Analytics offers users the ability to create Dashboards in their accounts. Dashboards are a collection of widgets that give you an overview of the KPIs you want to easily track. I utilize dashboards as mini-reports to track select metrics and understand the health of the account. Each dashboard I create revolves around one key aspect of the overall health. Plus, widgets are easy to customize and arrange in an order that makes sense to you. Keep in mind that every user is allowed to create up to 12 widgets per dashboard.
AdWords Performance Snapshot Dashboard
Working at a PPC agency, it’s important for me to understand how well my campaigns are performing. With this dashboard, you can quickly assess the performance of your Google AdWords campaigns, including keywords, campaigns and ad groups.
I use this dashboard to investigate irregularities, so that I know where I should spend time optimizing. For example, I can easily spot which Destination URLs have a high bounce rate and where I need to dive deeper into the data. Remember, the widgets are customizable, so if there’s something else you want to see, you can edit them.
Ecommerce Dashboard
Quickly understand your ecommerce performance across various dimensions such as source, mobile and product with this dashboard from Blast Analytics and Marketing.
With the Ecommerce Dashboard, I can analyze the top 10 products by revenue and unique transactions. Then I can move on to see my top sources for driving revenue. This is a great dashboard to see the overall health of your business and your top performers all in one place. I like to have this dashboard emailed to me every Monday morning, so that I can review last week’s performance.
Content Analysis Dashboard
The Content Analysis Dashboard comes from Vagelis Varfis of Nudge Digital. He describes it as analyzing and providing insightful data that will help you evaluate the efficiency of the content on your website. Based on these widgets, you will be able to see which one of the pages are underperforming or overperforming, so that you can adjust your content strategy accordingly.
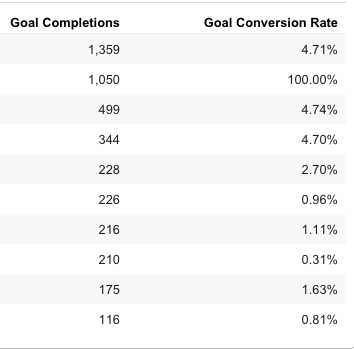
The Content Analysis dashboard allows you to easily see which landing pages are driving the most goal completions. Analyze and look for trends in high performing articles to better understand what type, topic and theme of content is leading to conversions. Then, amplify and promote those articles that are working across your marketing channels. Take it one step further by publishing similar types of articles, and benchmark the performance against your older content. There are many avenues you can pursue with this report.
Social Media Dashboard
How is social performing for your brand? Justin Cutroni created this dashboard to provide you a view of off-site activity, on-site activity and conversions/outcomes, making it easier to evaluate user activity throughout the conversion process.
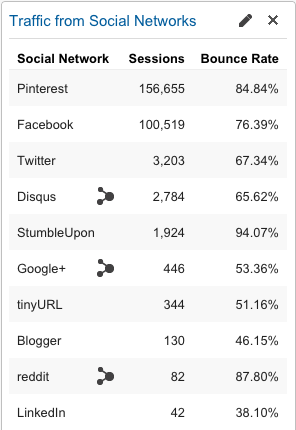
Use this dashboard to analyze the performance of your social media channels. In this example, Pinterest drove 56% more traffic than Facebook during this time period. Based on this information, you could go back to examine which pins drove the most traffic and conversions, and set them up as Promoted Pins.
This report also shows new visitor acquisition from social, most shared social content, revenue per social network and social visits from mobile devices. This is a must have for any marketers who want to understand social media’s performance across their business.
Audience Snapshot Dashboard
The Audience Snapshot Dashboard, from Loves Data, provides a top-level overview of website users. You’ll receive quick insights into where visitors are physically located, how engaged they are and what devices they are using to access your site.
This dashboard presents a really great overview of the where your visitors are coming from and how they’re getting there. Again, I use this data to target ads across different channels. If I see mobile traffic from Apple devices working well, I’ll make sure to target those in future ads or optimize current campaigns to take advantage of that insight.
With these reports and dashboards, you are now equipped to provide internal stakeholders with tailored views of data that matter the most to you and them.
My hope is that you found these Google Analytics reports and dashboards useful for your business and job role.
Did I miss any awesome reports and dashboards? What are your favorites? Please share them with us in the comments section.
Innovative SEO services
SEO is a patience game; no secret there. We`ll work with you to develop a Search strategy focused on producing increased traffic rankings in as early as 3-months.
A proven Allinclusive. SEO services for measuring, executing, and optimizing for Search Engine success. We say what we do and do what we say.
Our company as Semrush Agency Partner has designed a search engine optimization service that is both ethical and result-driven. We use the latest tools, strategies, and trends to help you move up in the search engines for the right keywords to get noticed by the right audience.
Today, you can schedule a Discovery call with us about your company needs.
Source:

![How To Create a Strategic Dashboard in Excel Using Semrush Data [Excel Template Included]](https://new.allinclusive.agency/uploads/images/how-to-create-a-strategic-dashboard-in-excel-using-semrush-data-excel-template-included.svg)
