Early in November, Google announced that they had added a beta version of the Speed Report to Search Console. We have known this has been coming for a while, as it has been included in multiple screenshots released by Google.
Speed testing has been a difficult task for a while now with no central area for an SEO to be able to judge page speed. We have had to rely on either large numbers of Page Speed Insights tests, 3rd party tools (these still have their place), or complicated Big Query requests to understand the large dataset that Google uses to judge our websites.
This guide will go into detail on how you can use this new feature to improve your site speed and provide real, measurable results on your website.
How To Find The Speed Report
The report can be found underneath the ‘Enhancements’ tab in Search Console:
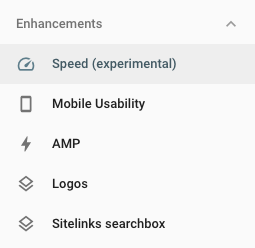
Clicking on this tab opens up the report, and from there, you can start digging in.
Where Does This Data Come From?
First off, it is important to understand where this data comes from and how it differs from other speed tools that can be used.
The data comes from the Chrome User Experience Report, which is Google’s huge database of user experience metrics for how real-world Chrome users experience popular destinations. This is a hugely powerful data source – rather than isolated tests run by bots; it is a real-time user measurement that indicates how users are experiencing your website.
The data in the report has only previously been available through complicated and expensive BigQuery usage or by relying on Page Speed Insights having your data in the ‘Field’ tab.
Looking at a page from the Impression site, we can run a speed test, but it doesn’t return any ‘Field Data’ – this means that there is nothing coming from the CrUX data.
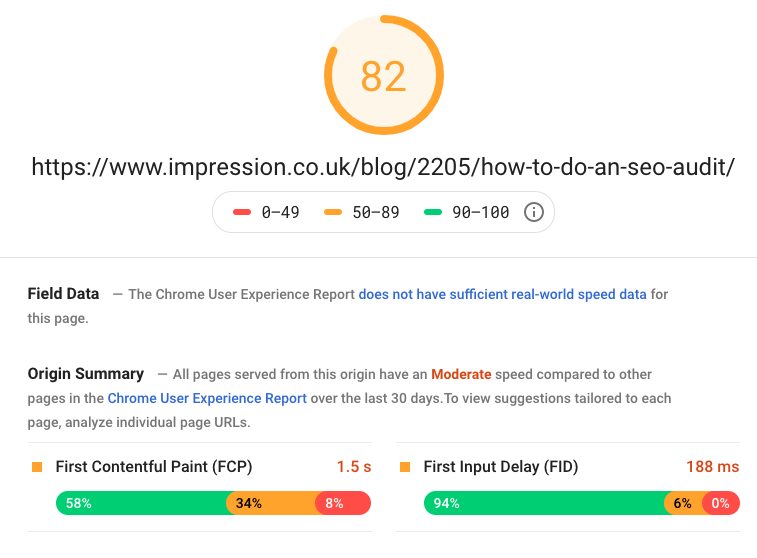
We have no real-world metrics outside of Big Query to measure this. However, if we go into the new ‘Speed Report’, we can see that we have CrUX data for this URL.
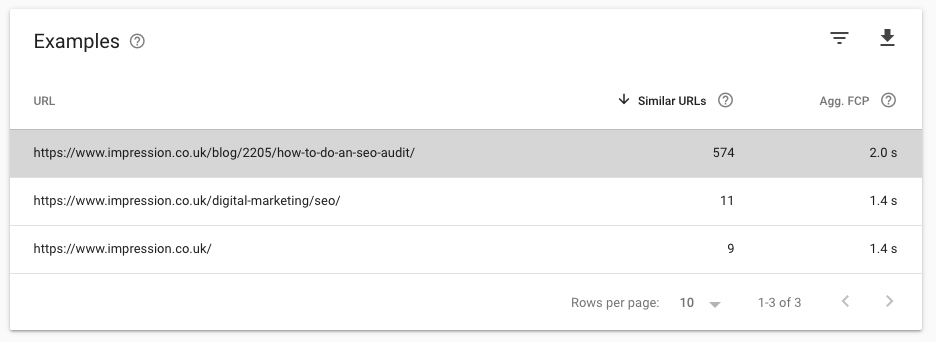
This is a huge plus for the tool and is already another data point to use that we previously didn’t have.
Using The Speed Report
Clicking on the report opens up the central dashboard for the speed report; this consists of two tabs:
Mobile
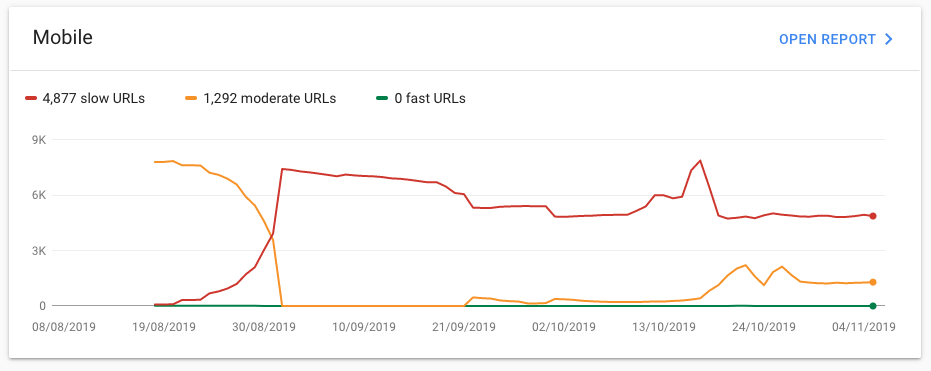
Desktop
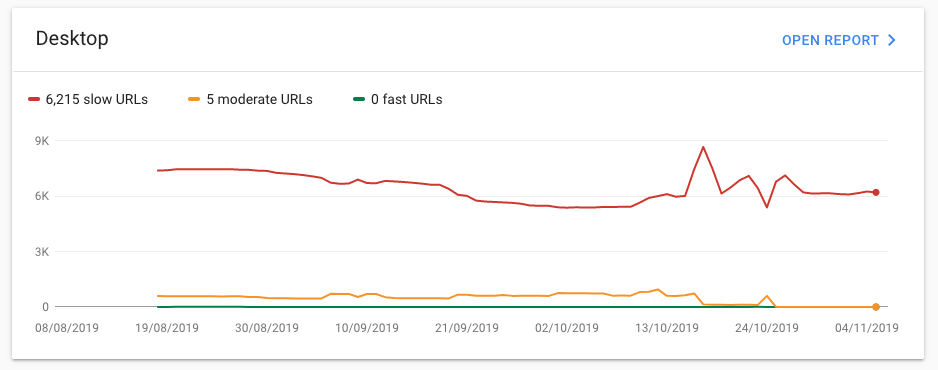
Both are fairly self-explanatory. One thing to note here is that they don’t include a ‘tablet’ field, which we know is reported separately within CrUX. It has not been confirmed if this has been rolled into either of these fields, so this something that might be added when the tool comes out of beta.
Each graph is bucketed into three sections which follow a traffic light system which matches the color coding from CrUX:
Slow (red) Moderate (yellow) Fast (green)The split between mobile and desktop is helpful as we know these can often contain different elements, menus, or interactivity. In the above example, you can see that the desktop has a larger issue with slower URLs than the mobile version.
Understanding the Metrics In Speed Report
These tabs can then be clicked into by pressing ‘Open report’. This opens up a familiar-looking tab to anyone who uses Search Console on a regular basis.
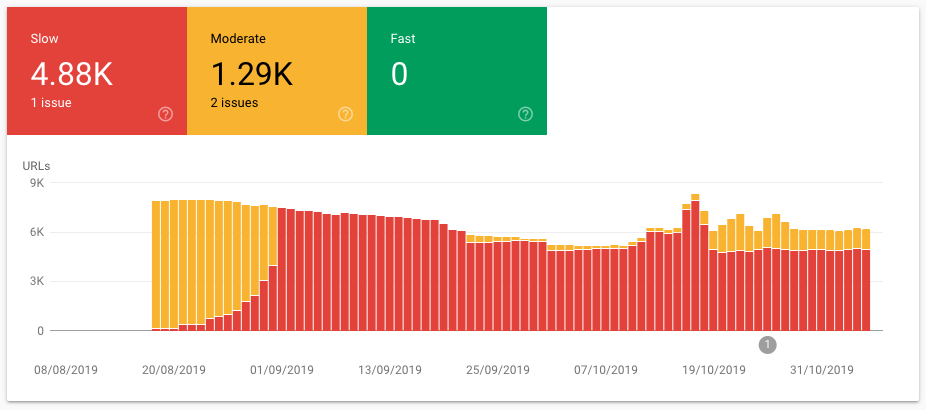
First is a configurable graph so you can view trends of where your URLs are sitting as well as filter out different categories. Looking at the above example, we can see that clearly something occurred at the start of August, where a large number of URLs started to be classed as slow – this is logically the place where you would look first.
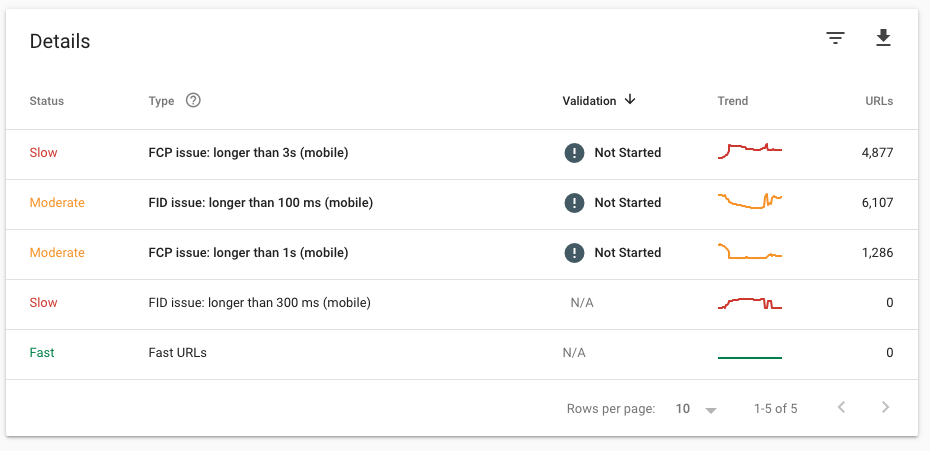
The second ‘Details’ tab lays out the issues with the number of URLs against it. This tab also contains the type of issue that Search Console is flagging as the problem.
There are only two current measurements being used here. That said, these are arguably the most important metrics for a website and are how real-time users will experience the page load.
First Contentful Paint (FCP) - This is a measurement of how long it takes for the browser to load the first piece of content. This could be a banner, menu, or content. A long FCP can cause people to bounce immediately. First Input Delay (FID) - This is a measurement of the time between a user clicking on the first element of your site and when the browser starts to react to it. This is important as even though the page might be partially loaded, a long FID can frustrate and make the page seem unresponsive.Both of these measurements are categorized through the traffic light system. The timings are judged by the same criteria with no difference in the thresholds for desktop and mobile.
Slow
Moderate
Fast
FCP (Mobile)
Longer than 3s
Longer than 1s
Under 1s
FCP (Desktop)
Longer than 3s
Longer than 1s
Under 1s
FID (Mobile)
Longer than 300ms
Longer than 100ms
Under 100ms
FID (Desktop)
Longer than 300ms
Longer than 100ms
Under 100ms
The scores presented are ordered by 75% of your total traffic for FCP and 95% of total traffic for FID.
Analyzing The Speed Report
At this point, we now know how to use the dashboard to identify problem areas; if we click onto one of these issues, you can get a selection of URLs.
Here is an example from the Impression site where on the desktop site the First Contentful Paint is taking longer than 1s:
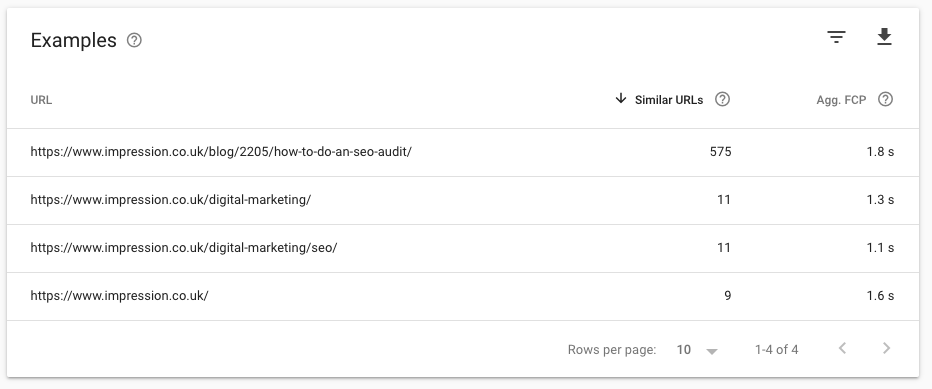
The bottom tab groups URLs under the ‘Similar URLs’ tab, which is particularly useful if you have problem areas as this allows you to identify specific pages.
Starting with the slowest URLs, we can click on the issue to bring a popover on the right-hand side of the screen which contains a list of these URLs:
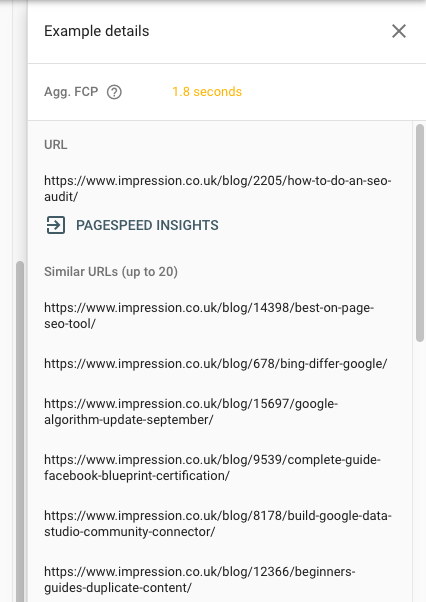
This only brings up 20 similar URLs – considering that the issue is for 575 similar URLs, we can see why this might not be the most useful sample size to work from initially. Nevertheless, we can see that our blog is consistently the source of this.
Actioning Changes From the Speed Report
We have now analyzed the speed report and generated a list of problem URLs where we have issues to address. The next step would be to load these in Page Speed Insights (the report lets you do this for each URL).
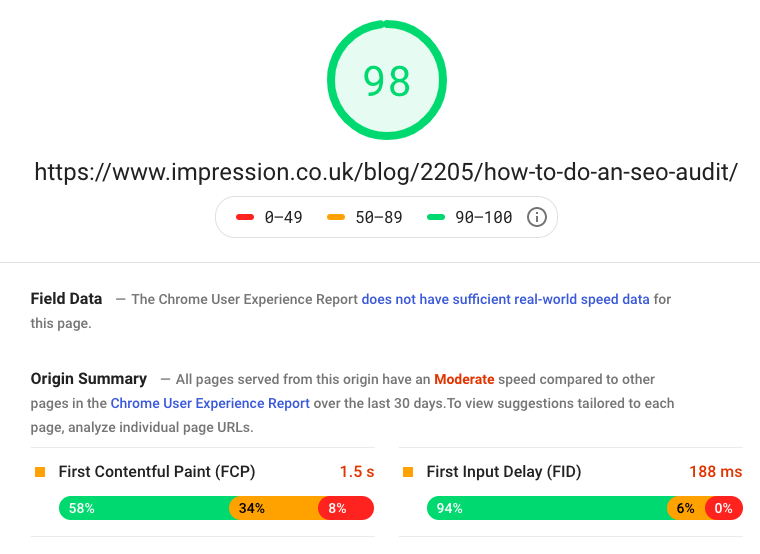
When we test the page using Page Speed Insights, the score comes back as 98 on desktop. This immediately jumps out as not tying in with the scores we can see coming through in the dashboard.
This is why the new page speed report is particularly useful: it isn’t just a bank of Page Speed Insights scores; it is real-time user data. So we need to try and make these pages even faster than they already are.
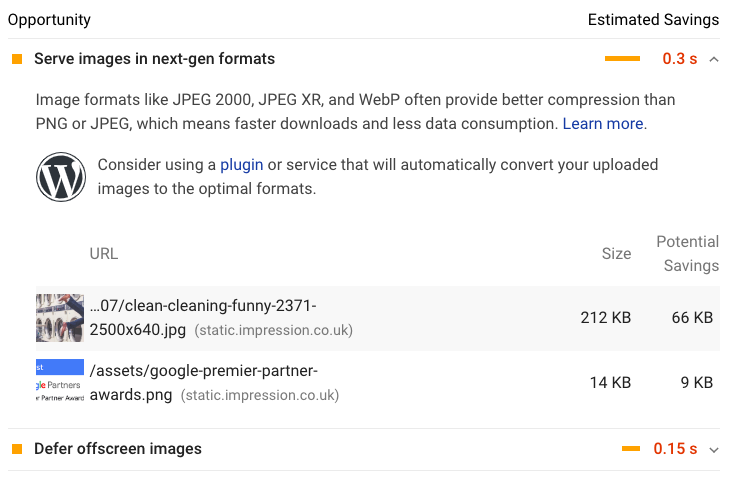
Two opportunities to improve are to further compress some of our imagery, in particular, the main header image with potential savings of 66kb. Another would be to look at utilizing some further lazy loading on certain imagery which doesn’t need to appear initially.
At this point, we would write up our recommendations and pass them on to the development team for them to fix.
It is clear to see that there is very little optimization to make on this page, so we do have to take the URLs being placed in moderate with a pinch of salt.
Other Methods to Test Page Speed
In the example above, I have only described the process of using Page Speed Insights to test the tool. As you know, there are a whole host of other tools out there to aid us in our quest for amazing site speed, such as:
GTMetrix WebPagetest PingdomEach of these tools offers a different set of measurements, and we always advise using as many data points as possible. Particularly in cases where your actions will use up some of a clients’ or internal team’s development resource, having each of these tools confirming your issues gives you a much stronger hand when trying to push changes through.
Always make sure to record each of the scores that these tools give you so you can refer back to these later when judging the success of the changes.
Tracking Changes
We have used the report, found the issues, and the developers have got back to tell us they have fixed the issues. We need to double-check this before we can start to submit these URLs to be validated.
Here we would rerun the tests with all of the tools recommend earlier to see if these issues have stopped coming through, and from here, we would then go back into the speed report and press ‘Validate Fix’.

Google will then go away and monitor the usage statistics for 28 days for this set of URLs, opening up a ‘verification window’. Using this data, they will then judge which URLs out of the bucket have been fixed.
This is dependent on users visiting the page, so for some smaller traffic URLs, the process might take a little longer.
Key Takeaways
From the above, you hopefully have a good idea of what the ‘Speed Report’ is and how it can help you to improve your website’s performance in organic search. Here are some key takeaways:
The tool is still in beta – we expect this to be added to over time as it feels barebones with only two metrics.
This is data we haven’t had readily available from Google before, it is displayed in a very simple way and is hugely useful to understand overall speed issues impacting a website.
The sample size of 20 isn’t very useful when so many URLs can be in a single bucket.
The report seems overly harsh at the moment with URLs: pages with high Page Speed Insights scores are coming through as moderate in the report.
Innovative SEO services
SEO is a patience game; no secret there. We`ll work with you to develop a Search strategy focused on producing increased traffic rankings in as early as 3-months.
A proven Allinclusive. SEO services for measuring, executing, and optimizing for Search Engine success. We say what we do and do what we say.
Our company as Semrush Agency Partner has designed a search engine optimization service that is both ethical and result-driven. We use the latest tools, strategies, and trends to help you move up in the search engines for the right keywords to get noticed by the right audience.
Today, you can schedule a Discovery call with us about your company needs.
Source:


