

Whenever you’re trying to get from point A to point B, it helps to understand the terrain between the two. How far do you have to go? What hazards should you look out for? Where can you stop for gas? Knowing the landscape makes for a successful journey.
As a business owner or marketer, it’s all about the market landscape. Without a doubt, you’ll encounter competitors along the way, and they can slow down your progress. That’s why it's important to know exactly where they stand.
A competitive landscape analysis provides the information necessary to overcome your competitors and reach your destination. In this article, we’ll explain what a competitive landscape analysis is, describe some common competitive landscape analysis frameworks, and offer some techniques that demonstrate how to conduct a landscape analysis.
What Is a Competitive Landscape Analysis?
Competitive landscape analysis is the process of examining your market to identify your competitors and figure out where they stand with regard to other players, including you.
While the competitive landscape analysis process shares a lot in common with competitor analysis or market analysis, there’s an important distinction. Competitive landscape analysis is primarily focused on studying the relationship between businesses and how they relate to each other.
You can use the process to analyze and understand a variety of different metrics, such as:
Market share Product offerings and pricing Website traffic data Positioning and messaging Company growth and trajectoryCompetitive landscapes change over time, and they may look different depending on what metrics you’re analyzing. Because of this, competitive landscape analysis is usually considered an ongoing process.
There are also a variety of ways to organize your analysis. You may decide to use a simple spreadsheet or a more advanced competitive matrix. Either way, an understanding of the relationships between players on the field is the goal.
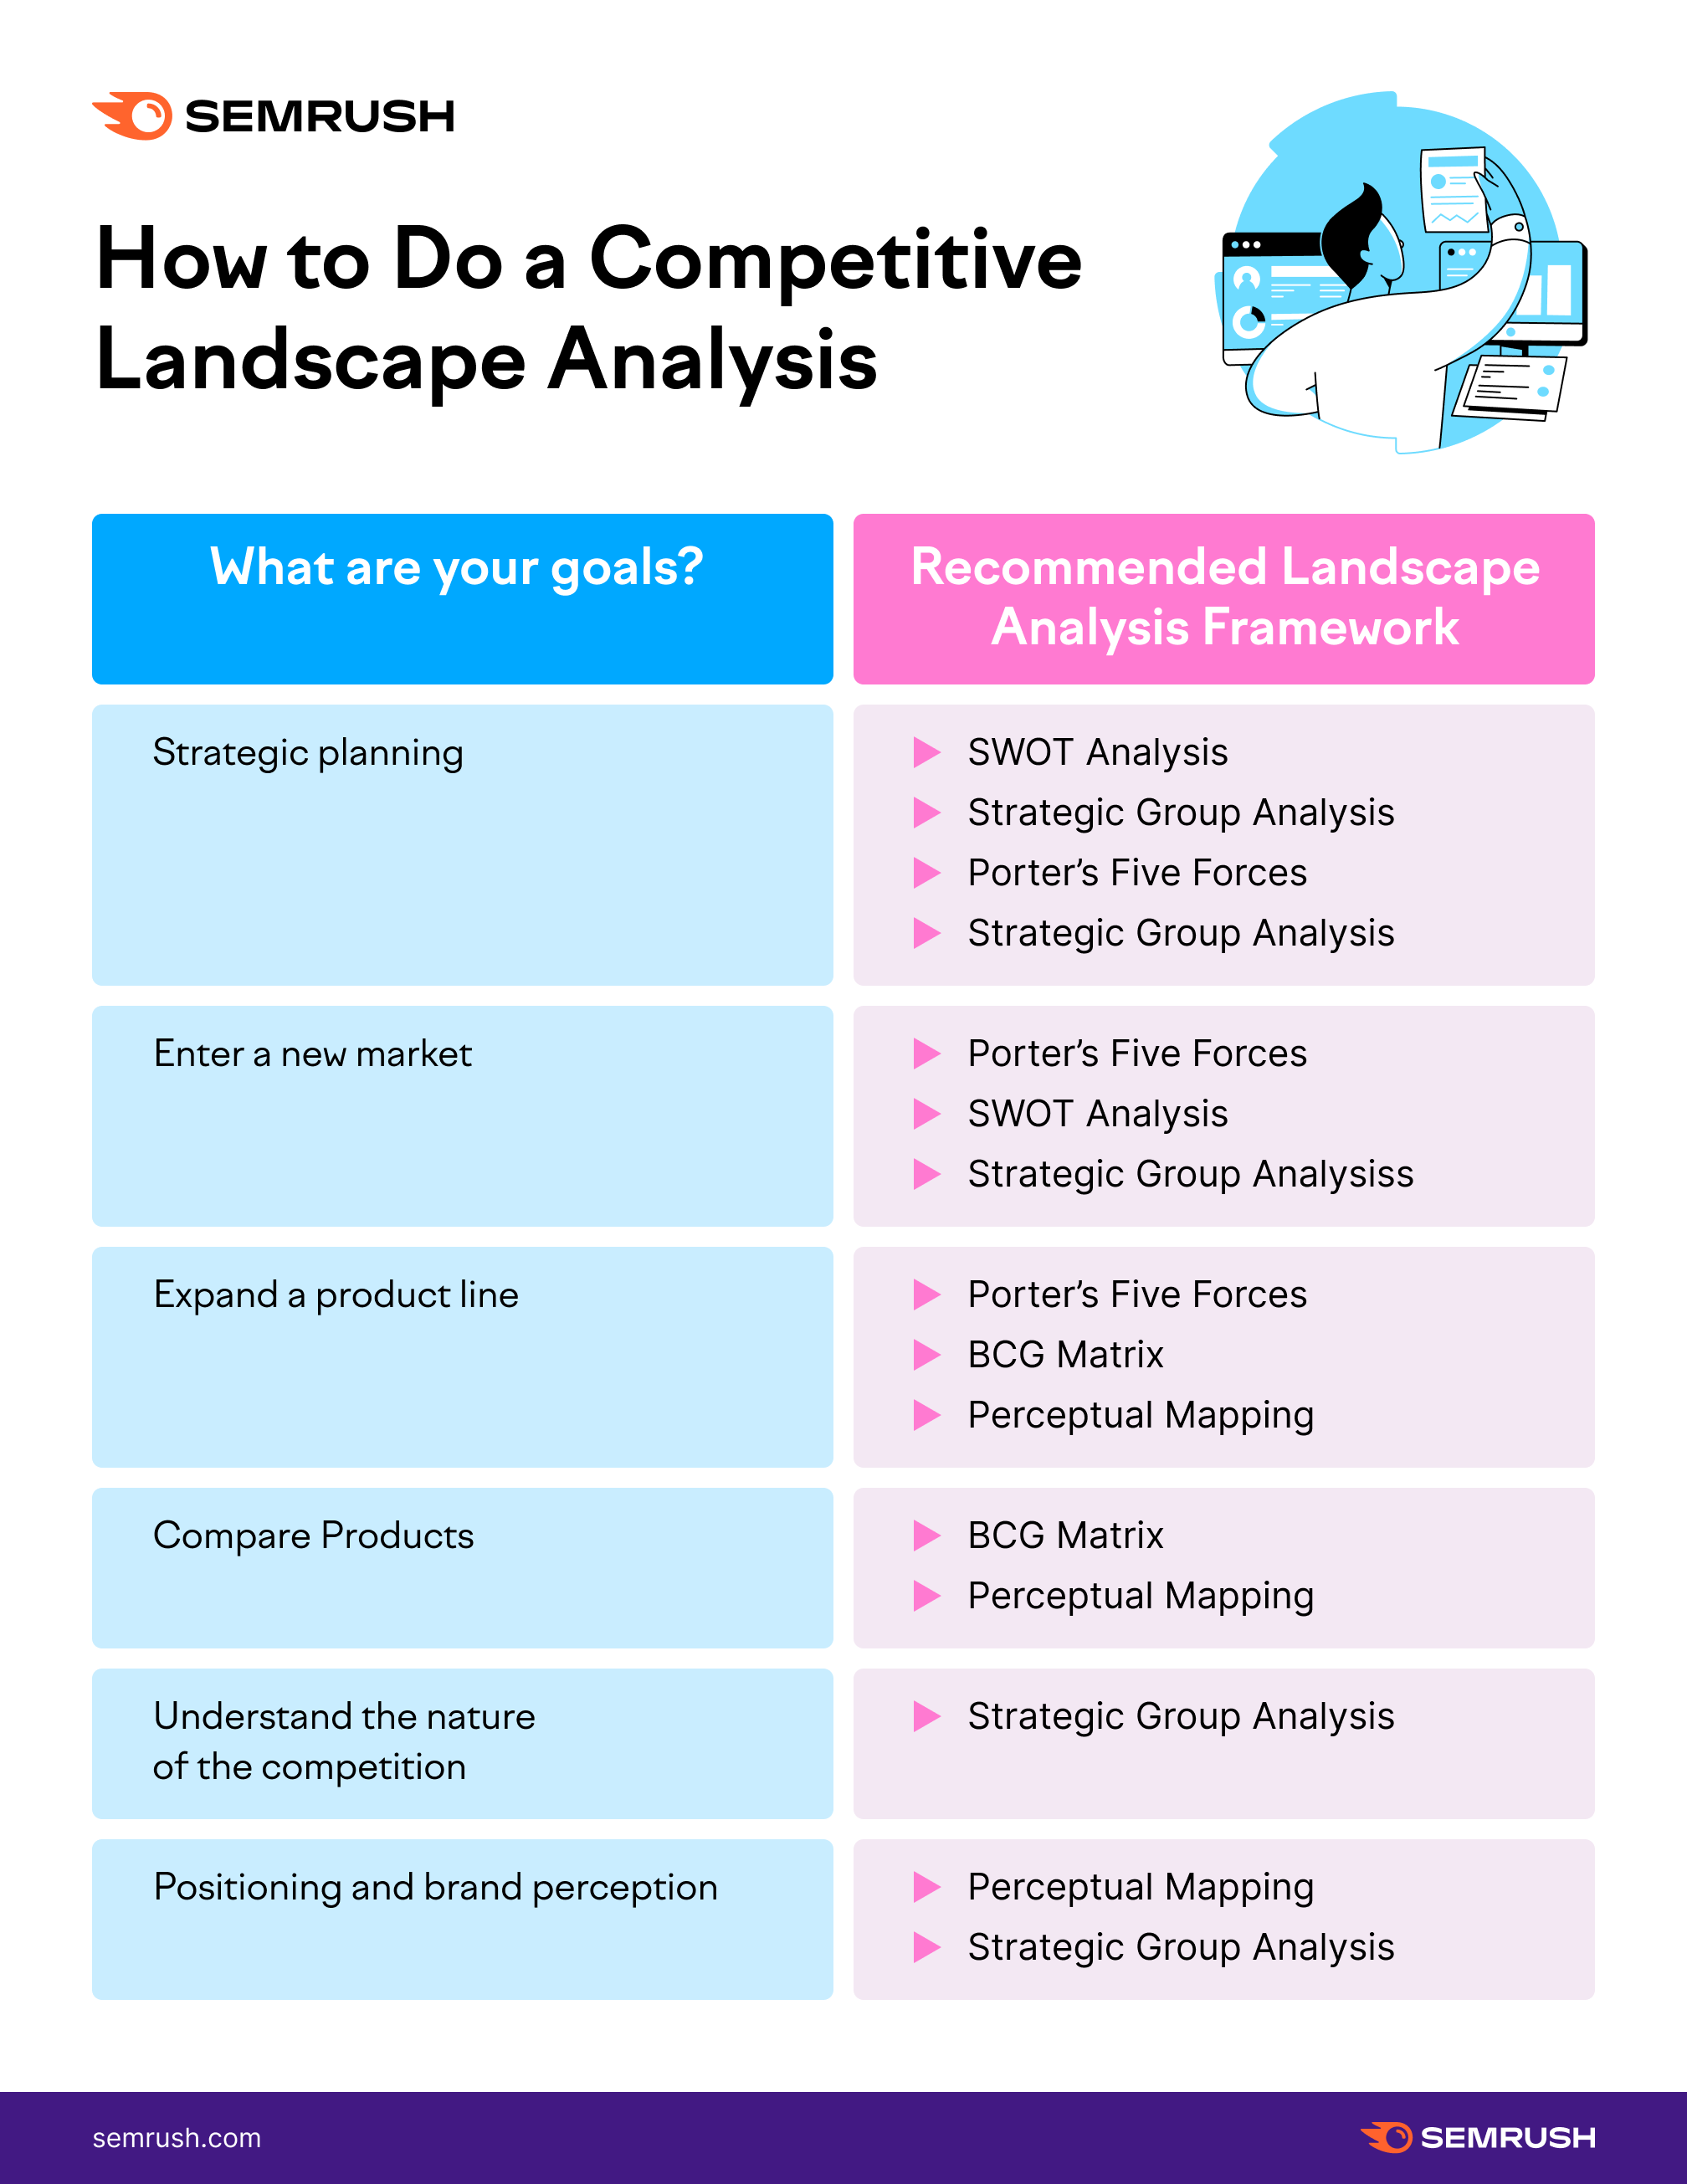
5 Competitive Landscape Analysis Frameworks
There are a variety of frameworks you can use for analyzing the competition. Different frameworks will yield different insights about the competitive landscape. Here are 5 common competitive landscape frameworks and some ideas on what insights they might generate.
SWOT Analysis
A SWOT analysis is a process of examining your business using a 2X2 grid. Each quadrant of the grid represents a letter in the acronym SWOT. In the quadrant, you write down your business’s Strengths, Weaknesses, Opportunities, and Threats as they relate to your competition.
A SWOT analysis can be great for strategic planning, as it opens up ideas about potential opportunities to seize and threats to counteract.
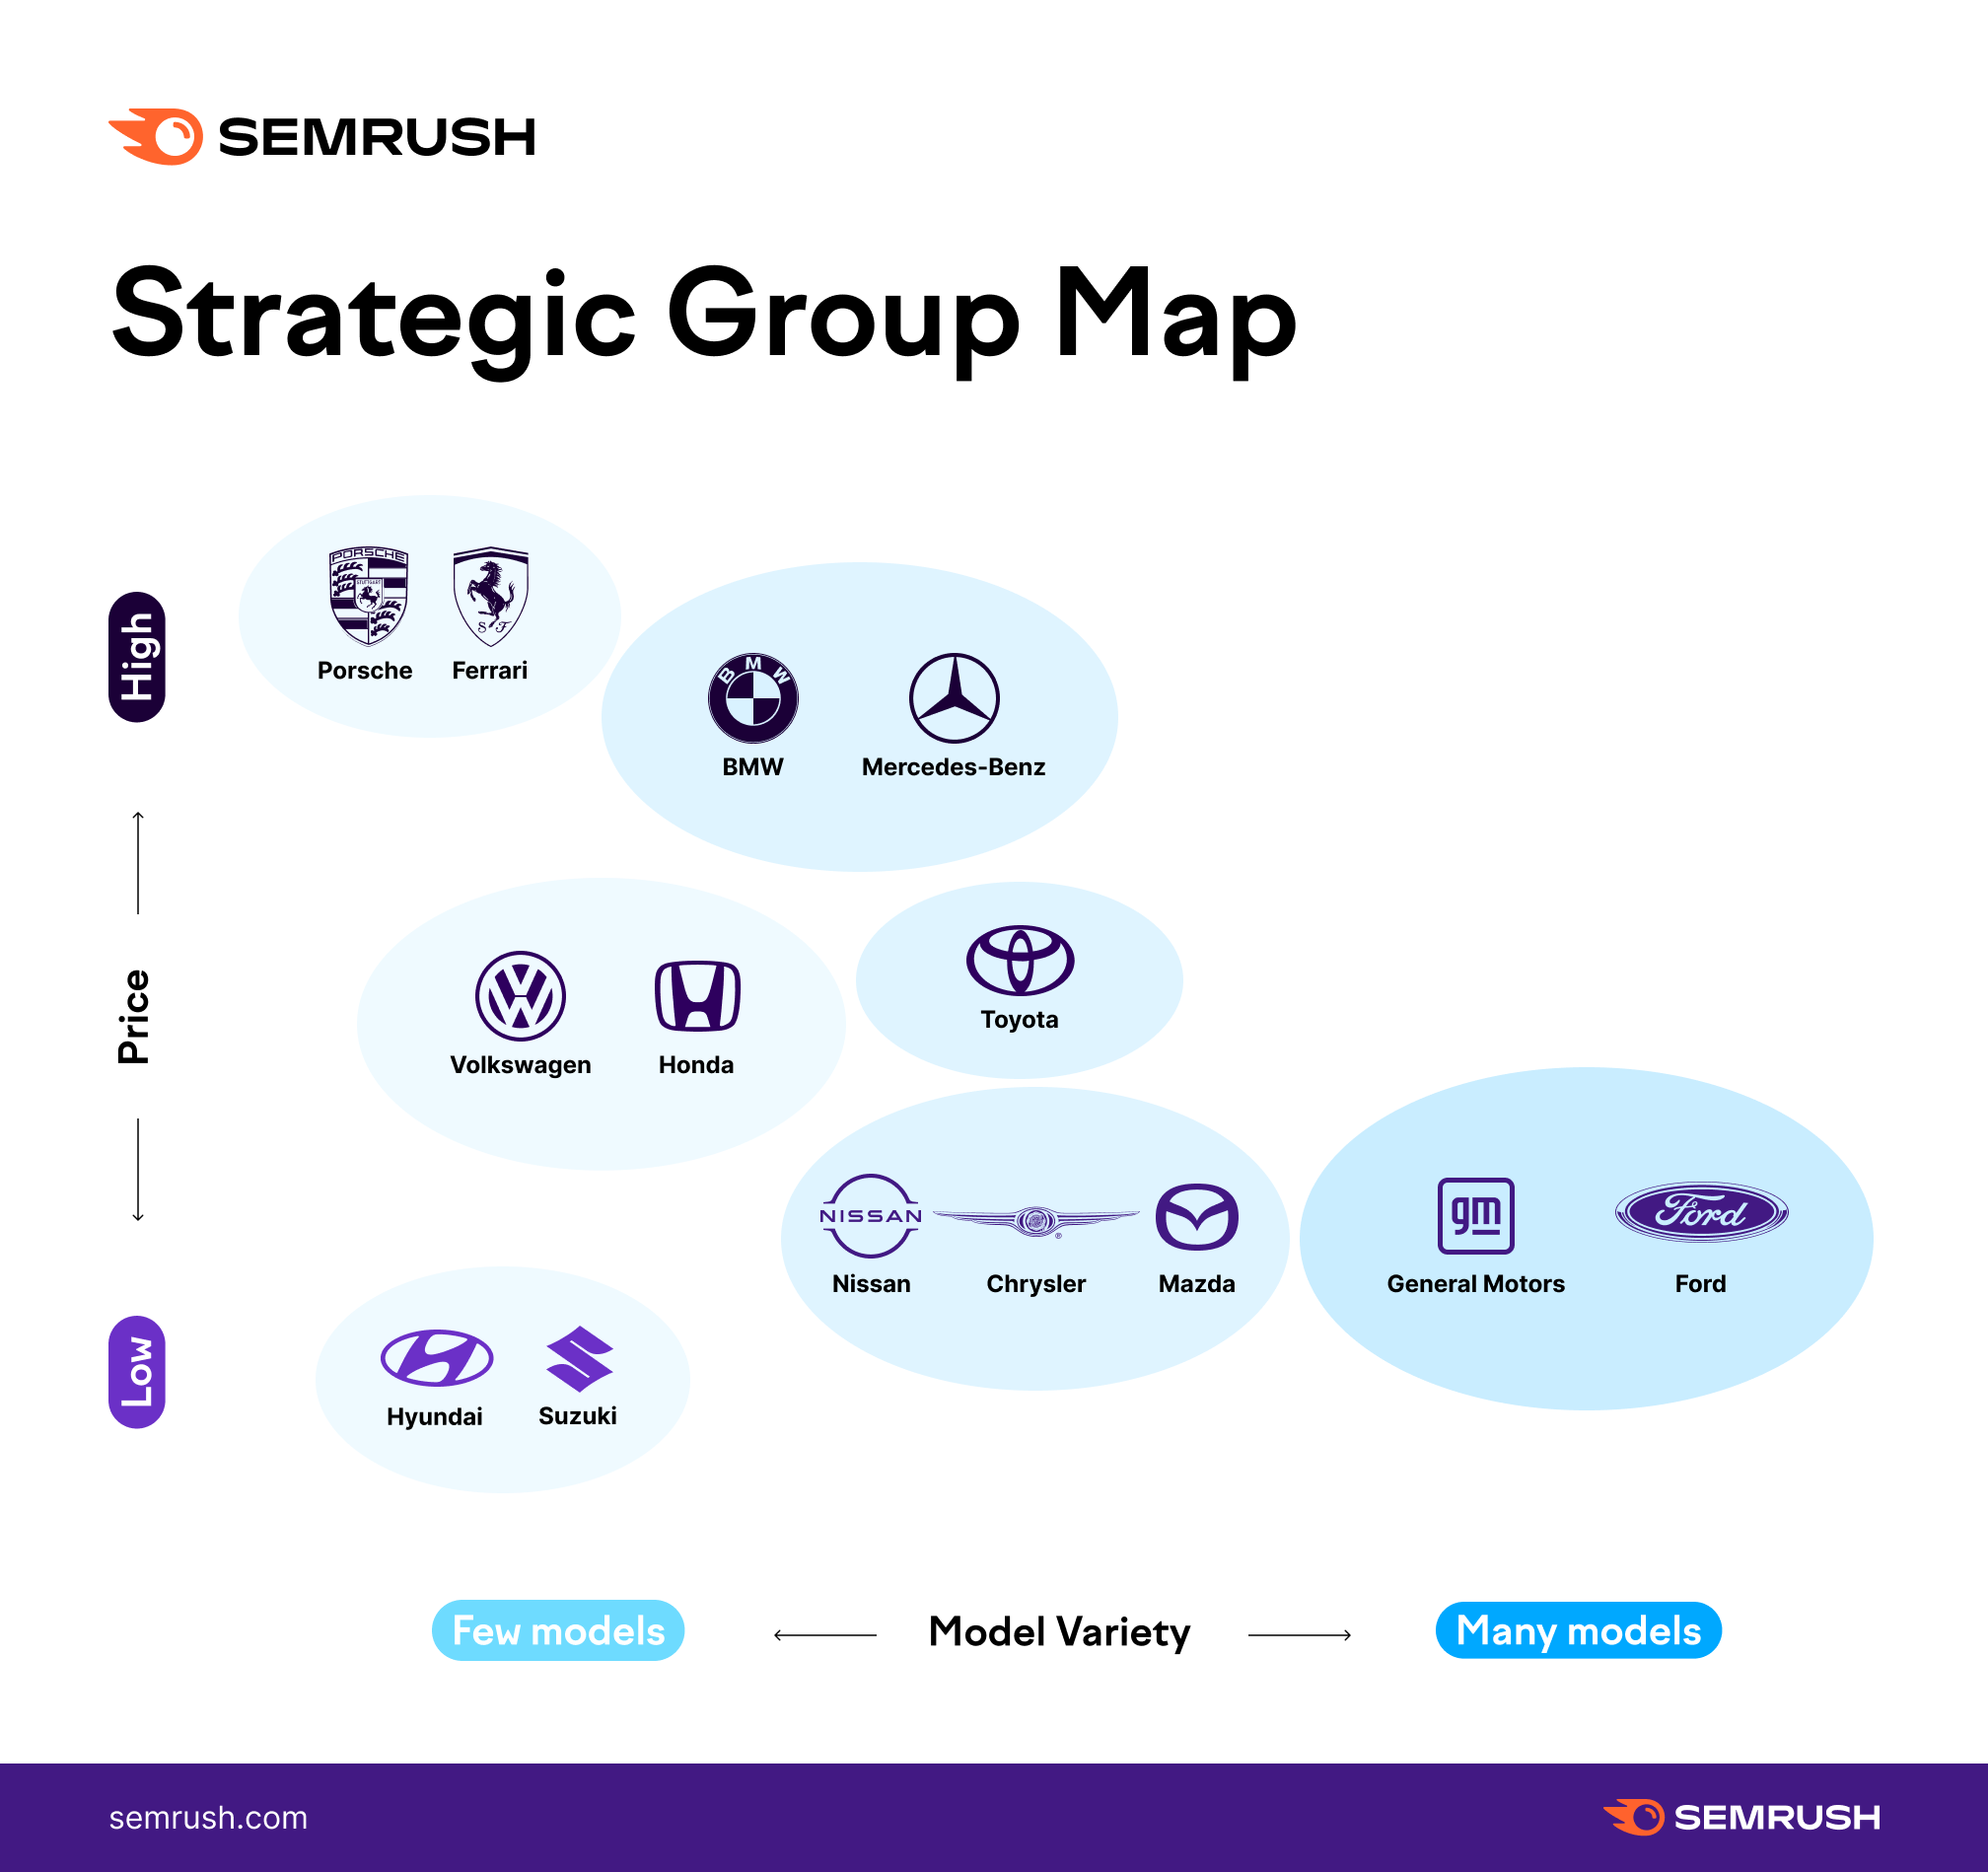
Strategic Group Analysis
With a Strategic Group Analysis, you organize competitors into clusters according to their business models or strategies. The clusters help illustrate the landscape and better understand relationships between businesses.
Some criteria for clusters include:
Product diversity Geographic coverage Markets served Distribution channels used Marketing strategies Product quality or pricingA Strategic Group Analysis can help you pinpoint your closest competitors and understand the precise nature of the competition. It can also help you examine different strategies to realize opportunities or problems.
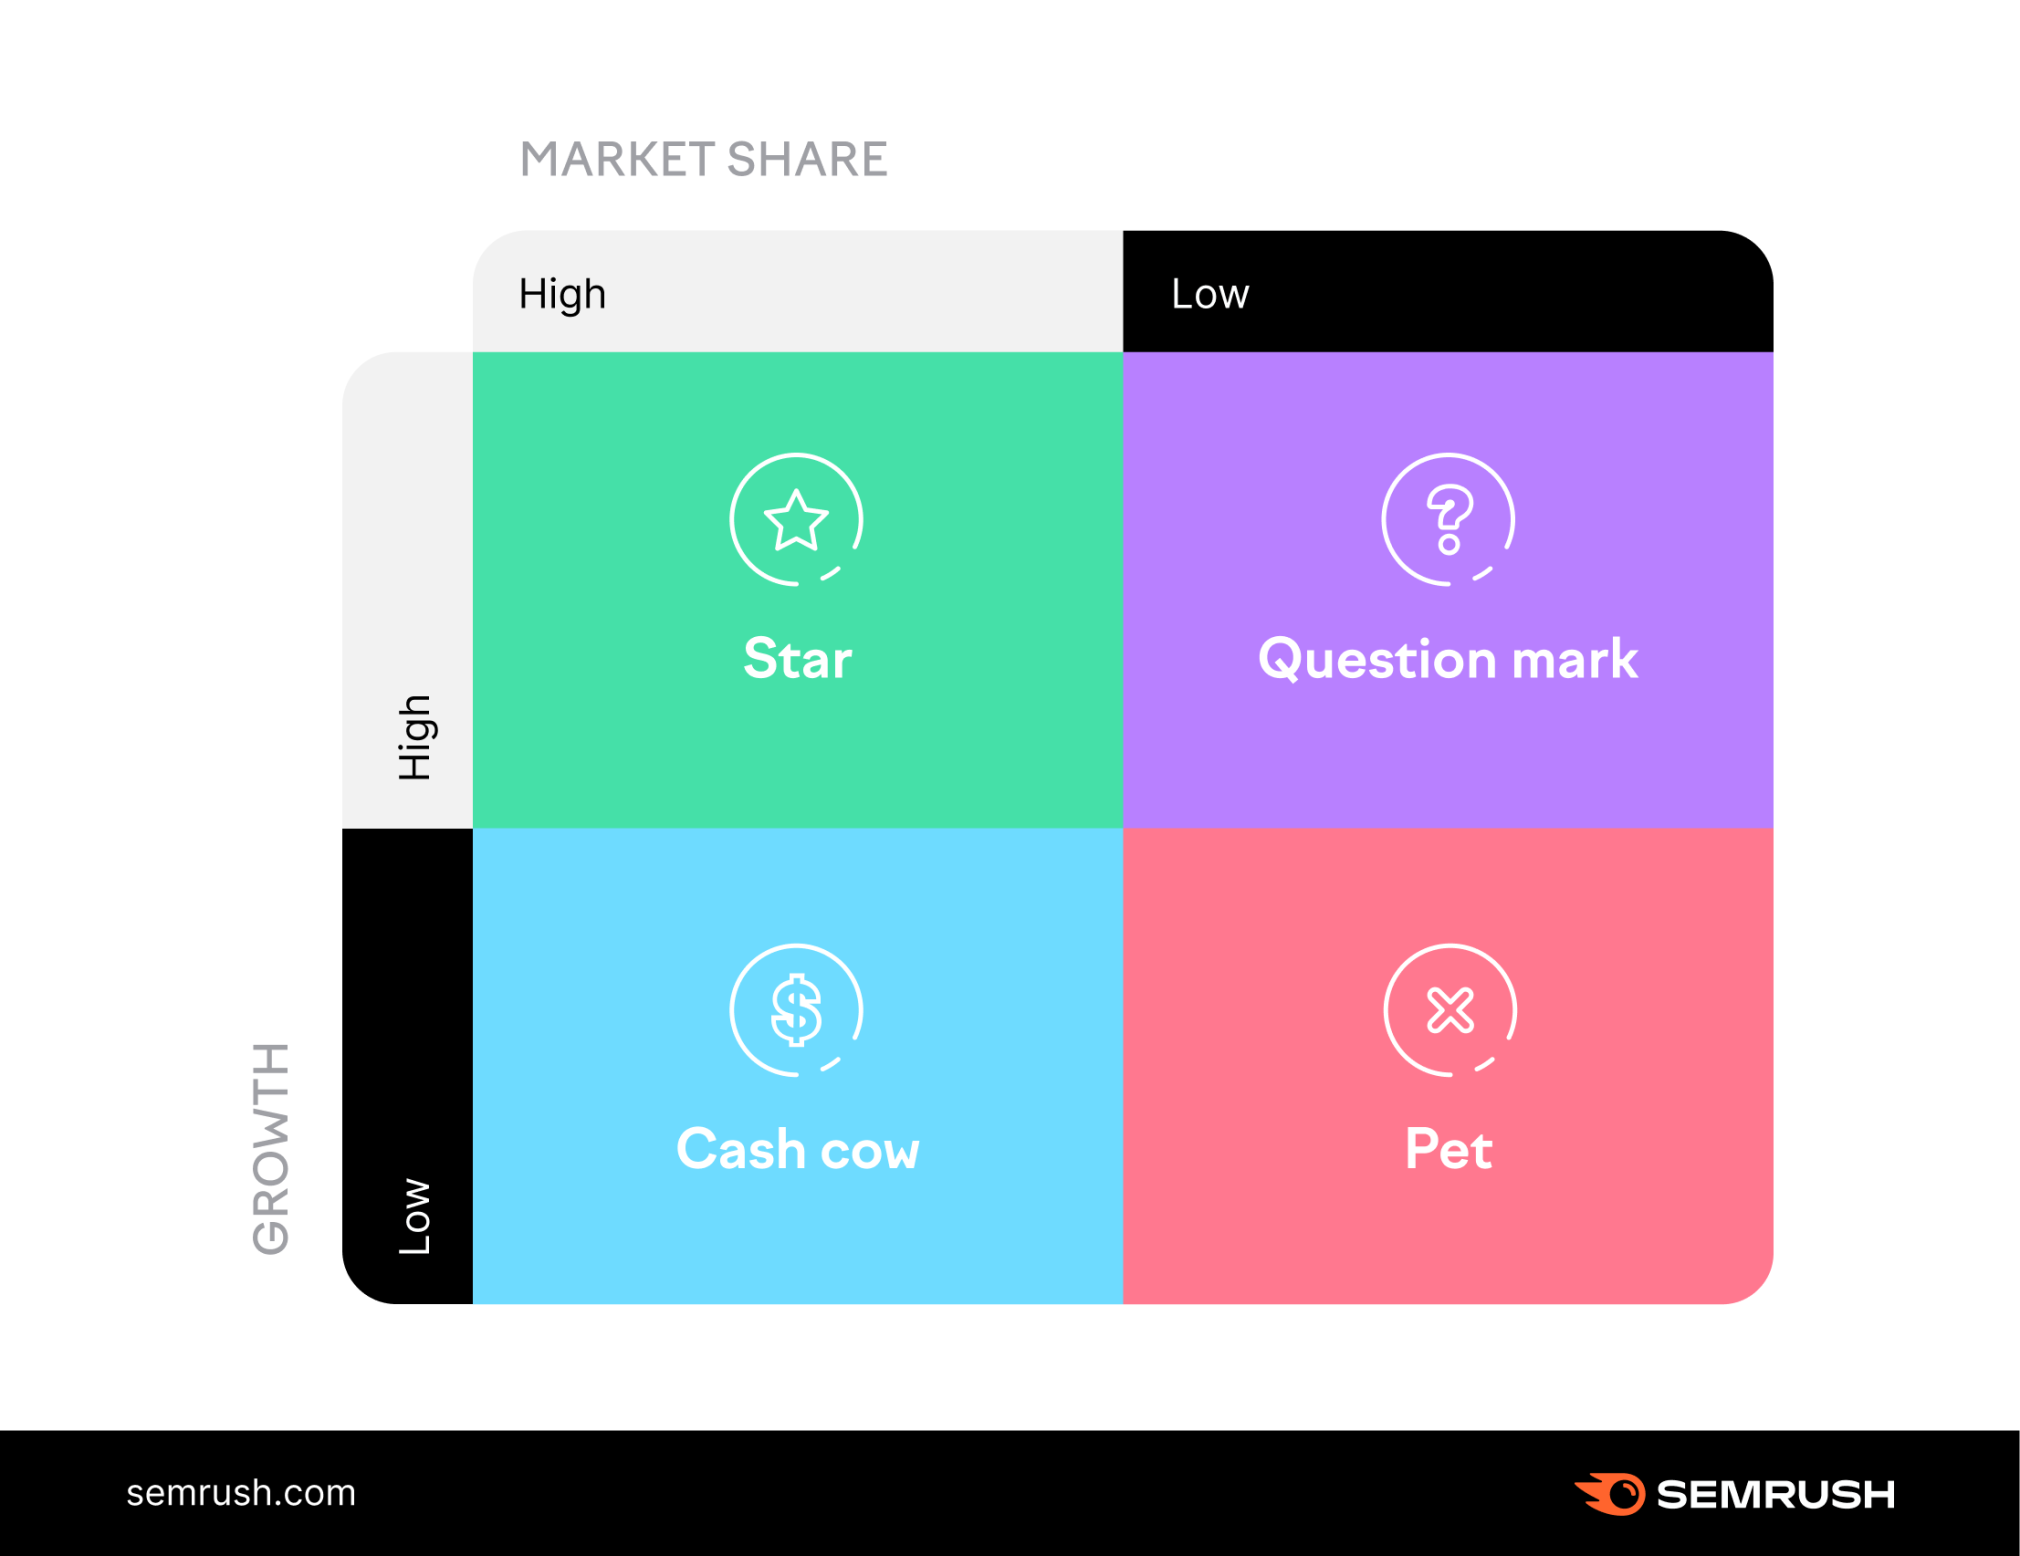
BCG Matrix
A BCG Matrix, popularized by the Boston Consulting Group (IE BCG), is a framework that helps you decide how to prioritize different products, services, or aspects of your business. The matrix examines items along two dimensions: growth and market share. The items are then placed in one of four categories:
Pets — Items with low growth rate and low market share Question marks — products with small market share and high growth rates Stars — items with high market share and fast growth rate Cash cows — products with high market share but lower growth ratesConsidering your products alongside competitor products can help you think about where to invest in terms of product development, product-line expansion, and product marketing.
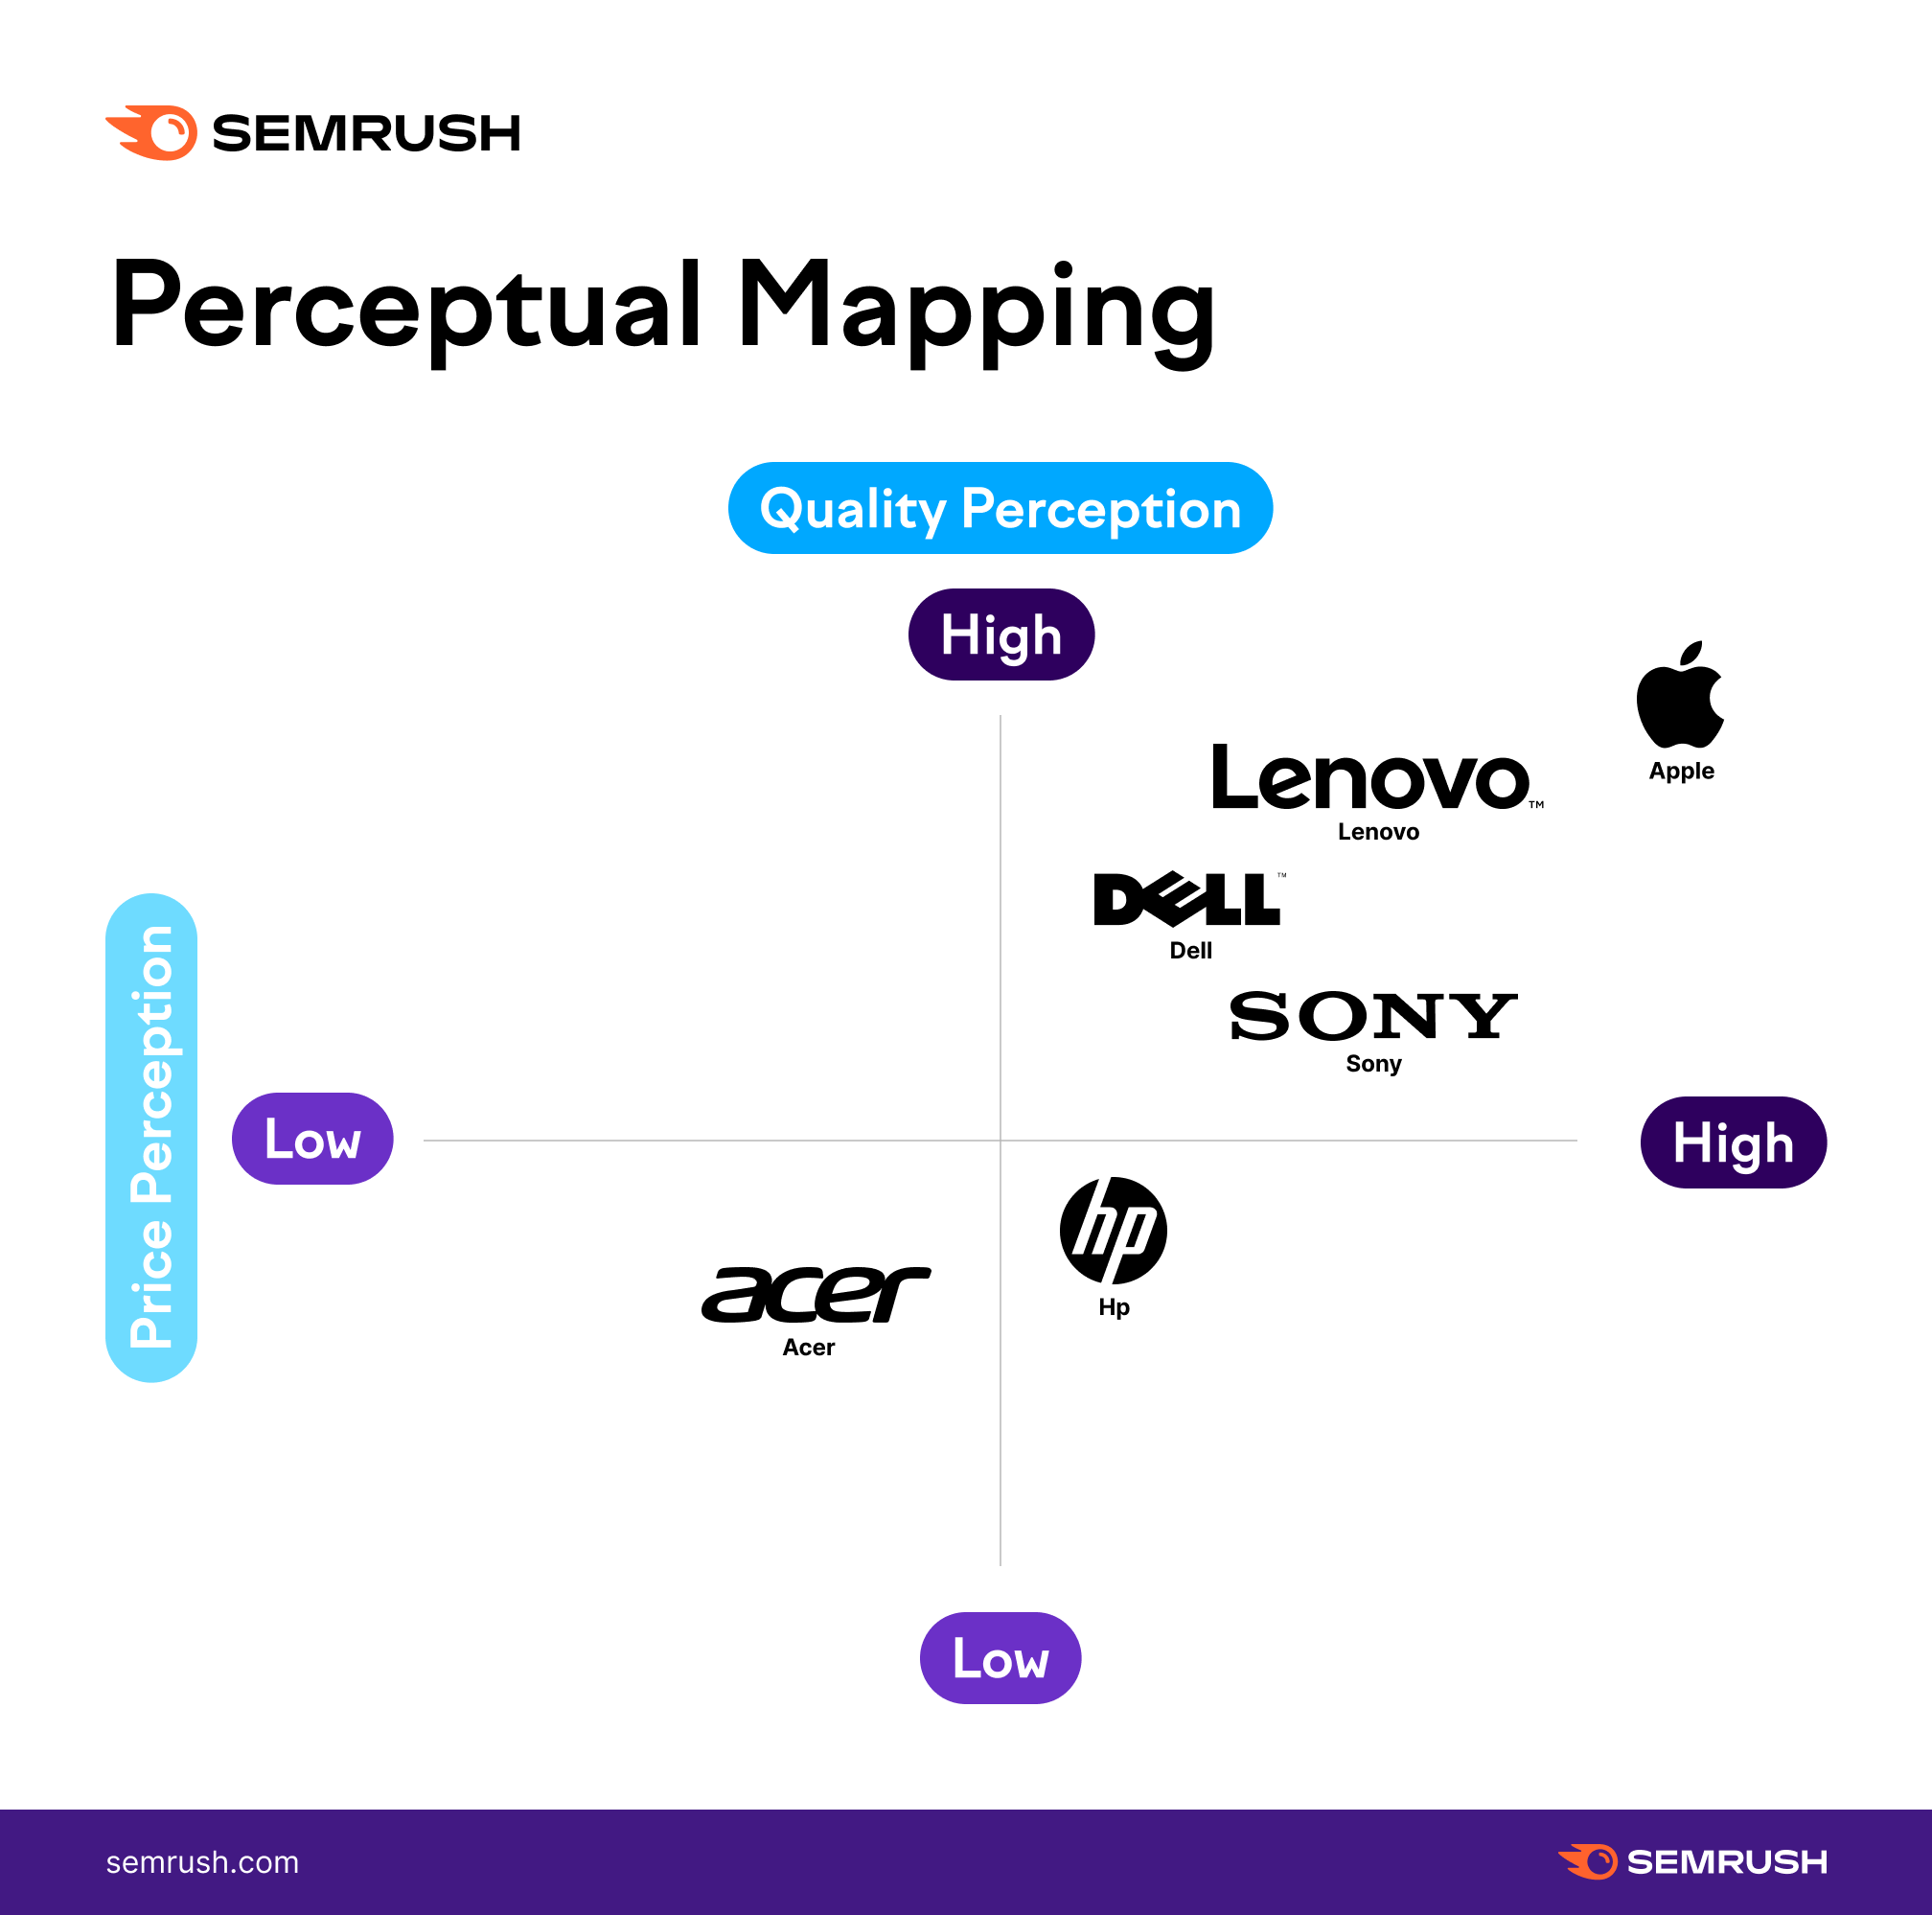
Perceptual Mapping
Perceptual Mapping is a framework for understanding how your brand or product is positioned with regard to your competitors. With this framework, you place brands or products on a grid with two criteria defining the X and Y axis. For example, quality and price. Customer feedback is central for understanding how the market perceives a given business and product.
Perceptual mapping is useful for understanding how people think about your product compared to your competitors’, allowing you to make decisions about future positioning efforts.
Porter’s Five Forces
A Porter’s Five Forces analysis provides a framework for examining the overall competitiveness of a particular market. Overall competitiveness is determined based on five forces:
The intensity of the competitive landscape Level of supplier power Buyer’s entry/exit costs The threat of substitute products Access to the market for new entrantsThe Porter’s Five Forces framework can be especially useful if you’re interested in entering a new market or expanding a product line or service offering. It can help in identifying the key challenges you may face in your efforts.
How to Gather Data for a Competitive Landscape Analysis (with Examples)
Once you’ve selected the right competitive analysis framework for organizing your landscape analysis, you’ll need to figure out where to collect data about your competitors.
You might start by simply analyzing your competitors' websites or social media pages. You could also look at industry resources such as Statista, Pew, or Gartner. Or you might try a competitive intelligence software like Semrush .Trends.
When you need data on competitor paid or organic web traffic, traffic generation strategy, market share, or content marketing, the .Trends tools can help you understand the lay of the land.
Let’s take a look at three examples to highlight Semrush’s features. This is by no means a full overview of these tools. As a brief exploration, it provides a sense of what kind of data you can gather with Semrush .Trends to plug into your selected competitor analysis framework.
Overall Market Landscape Analysis Data
For overall market landscape data, we can begin with Market Explorer’s Overview report. Simply enter competitor domains and the tool returns a host of insights you can use to better understand the competitive landscape.
The Growth Quadrant is a great competitive landscape example. It helps you visualize the lay of the business terrain by showing you where each of your competitors stands over a given period, and in relation to one another. Let’s look at the data gathering process by examining the food delivery industry.
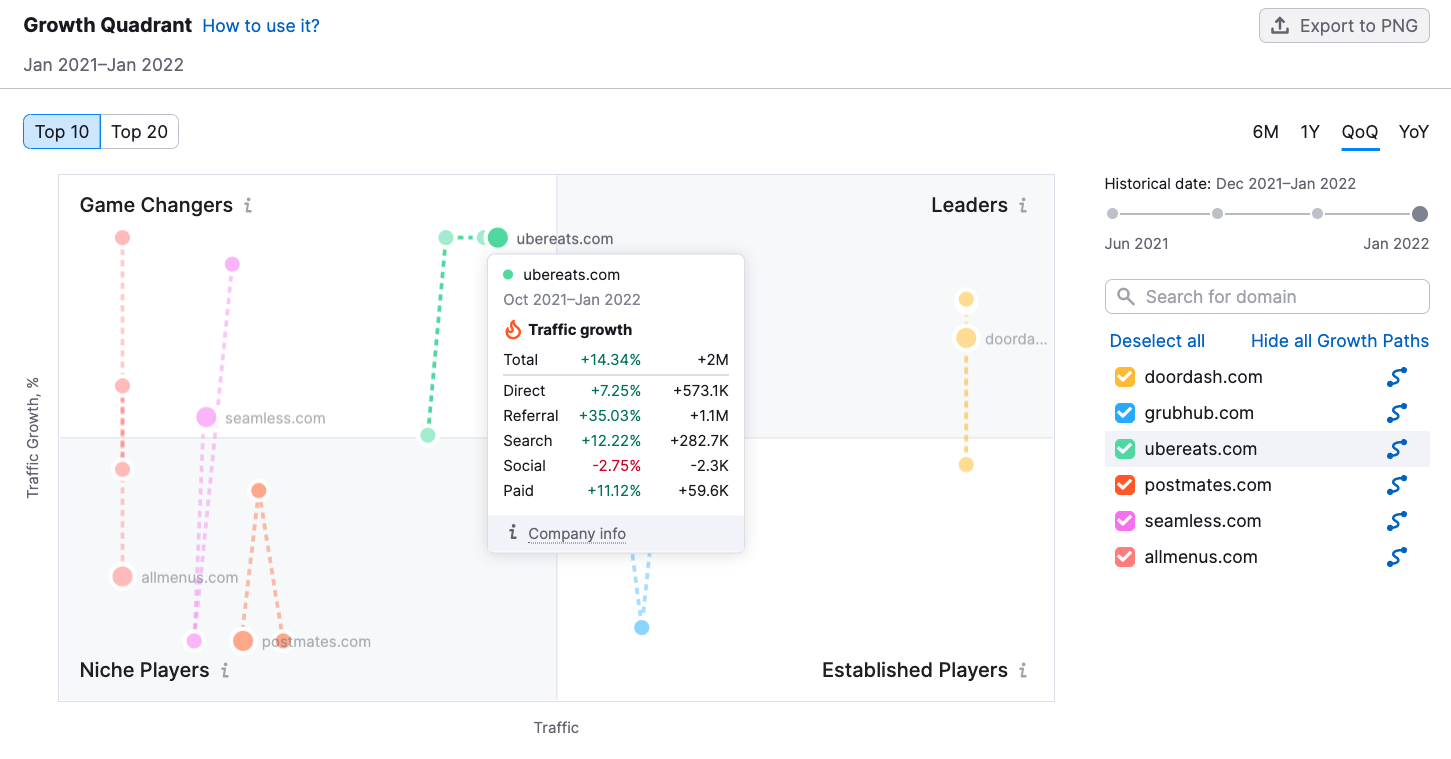
This graph, set to show quarter-over-quarter growth, depicts competitor movements from November 2020 to November 2021.
With this particular chart, it’s clear that Doordash leads the pack with consistently high traffic numbers and also a significant growth percentage over the last year. And while Ubereats still isn’t seeing Doordash-level success, they’ve seen an incredible 11.89% growth rate and a movement toward higher levels of consistent traffic.
We might also consider the Market Summary section of the Overview Report for information about competitor growth rate and market share. For example, the Key Players section of the summary shows the percent of the market each player owns.
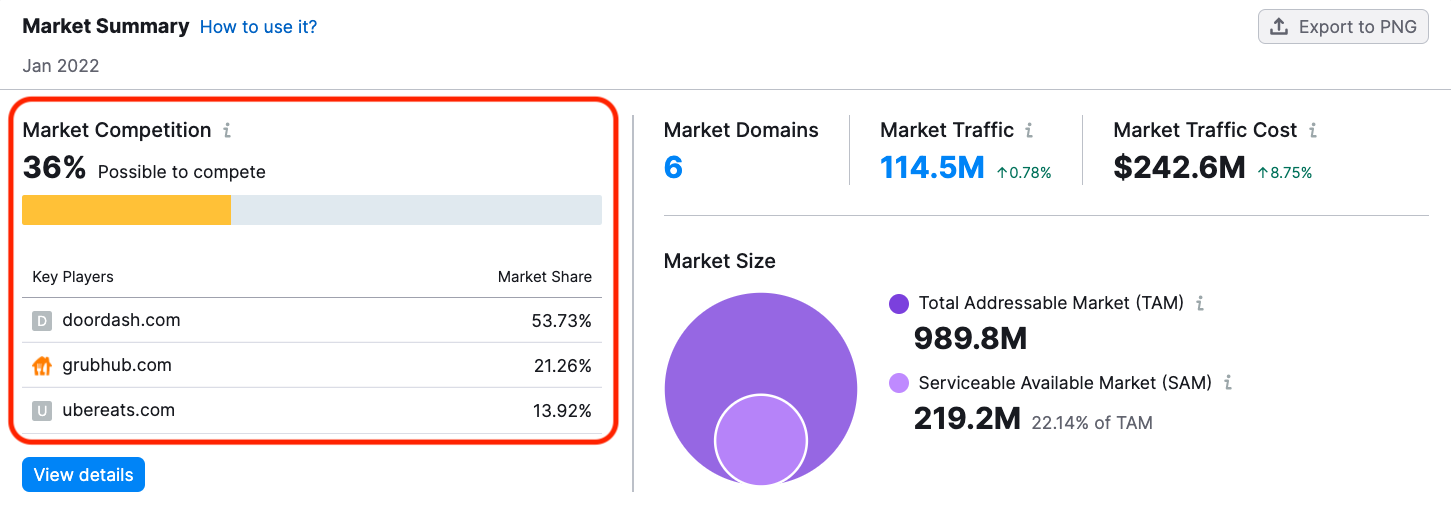
Doordash captures the lion’s share of traffic with 53.73% of total market traffic headed to their site equaling 61.3M visits. And though Ubereats has seen a skyrocketing growth percentage over the past year, as shown on the growth quadrant, they are still only capturing 13% of the market.
Using historical data, we can track market share over time, which provides an understanding of changes in the landscape. For example, here’s a Share of Visits graph from January of 2020.
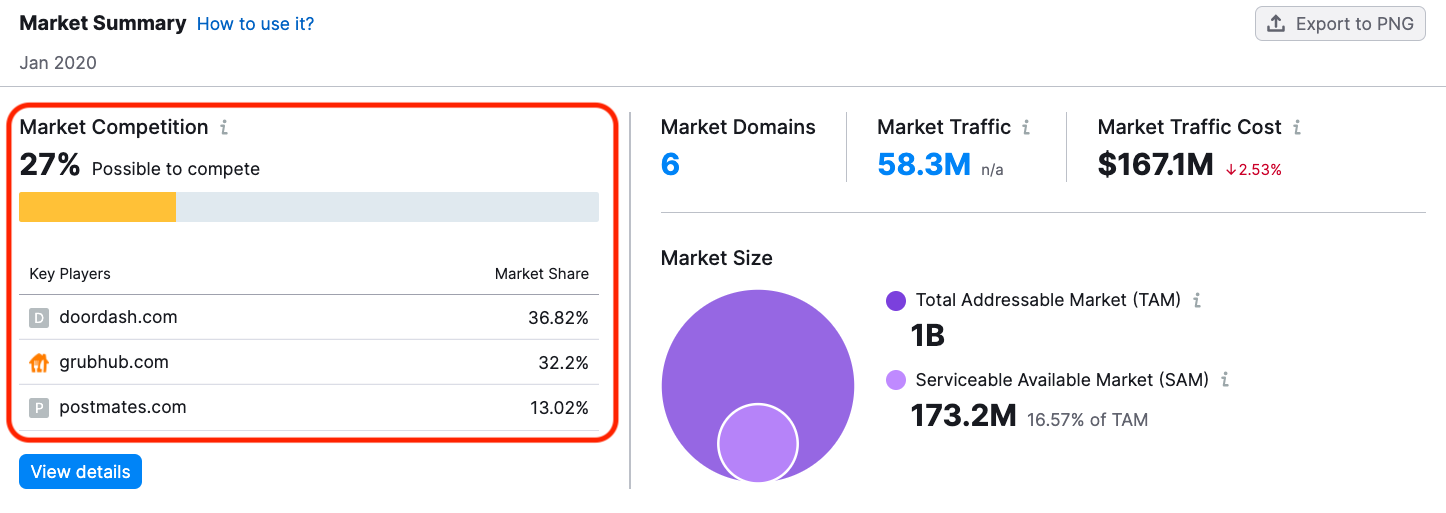
From the 2020 vantage point, Doordash doesn’t look like a clear winner. Likewise, Ubereats was lagging behind Postmates, which took the third position on the Key Players chart. With this new information, we might track the changes in market share month by month, or try to figure out what steps Doordash or Ubereats took to overcome the competition.
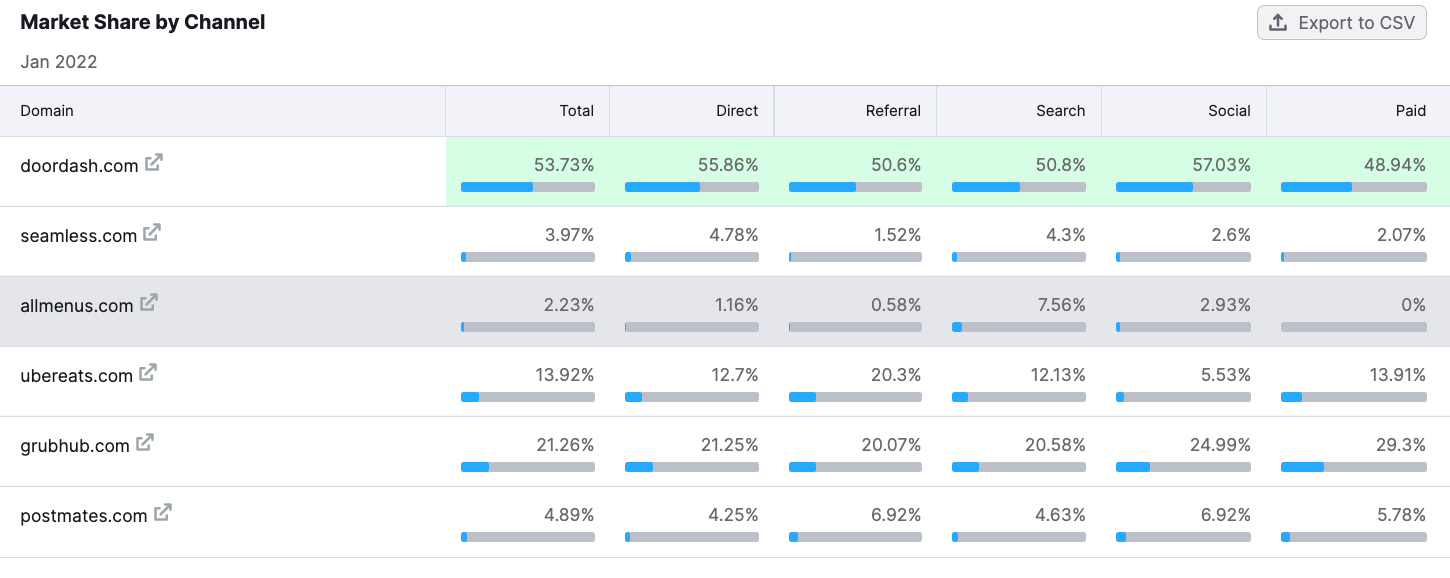
The Benchmarking Report also offers useful data for your landscape analysis. For example, the Market Share by Channel Graph depicts a side by side comparison of what share of the market goes to which business through a given channel. Here’s a look at Market Share By Channel in January 2022.
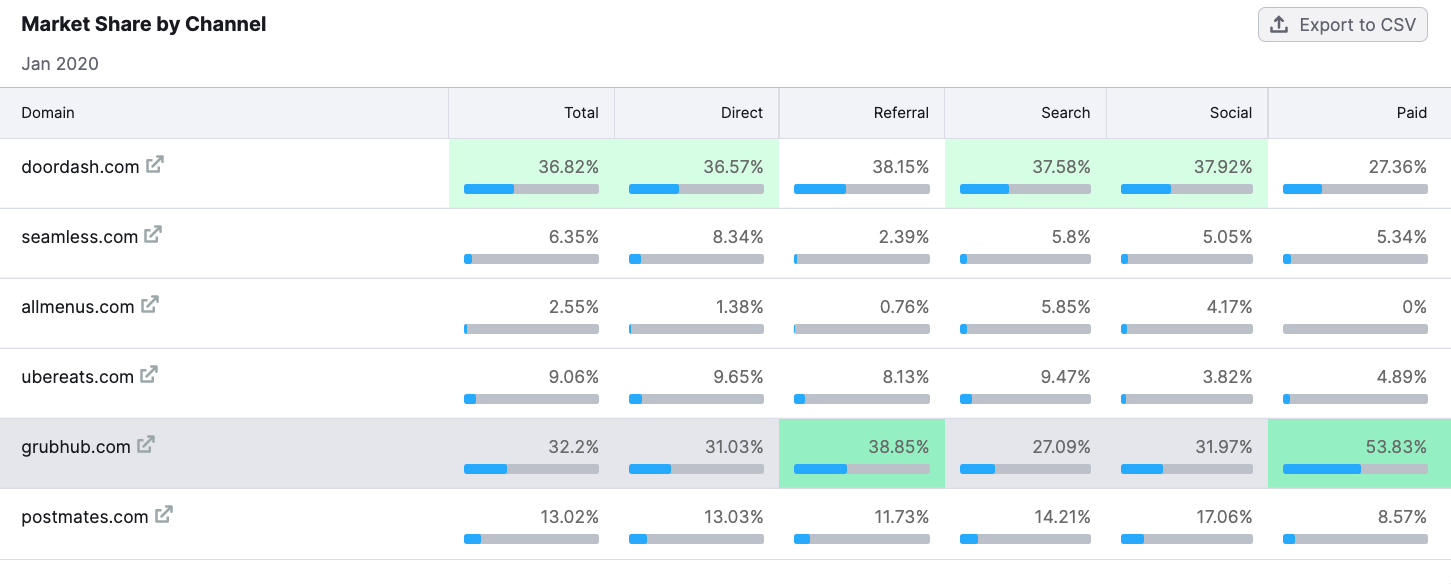
Grubhub, for example, received 38.85% of their traffic from Referrals and nealy 54% of market traffic that came through paid channels. This can tell us a good deal about their marketing strategy and position.
Looking at the Market Share by Channel graph again for 2021, a different picture emerges. By November of 2021, Doordash takes about half of all traffic from each channel.
Audience Landscape Analysis Data
For competitor audience data, Traffic Analytics provides a ton of data that can help you understand your market’s audience and where it overlaps with your competitors.
In the Traffic Analytics Overview Report, enter up to five competitors to analyze. Select the date range, location, and device type for data tailored to your specific needs.
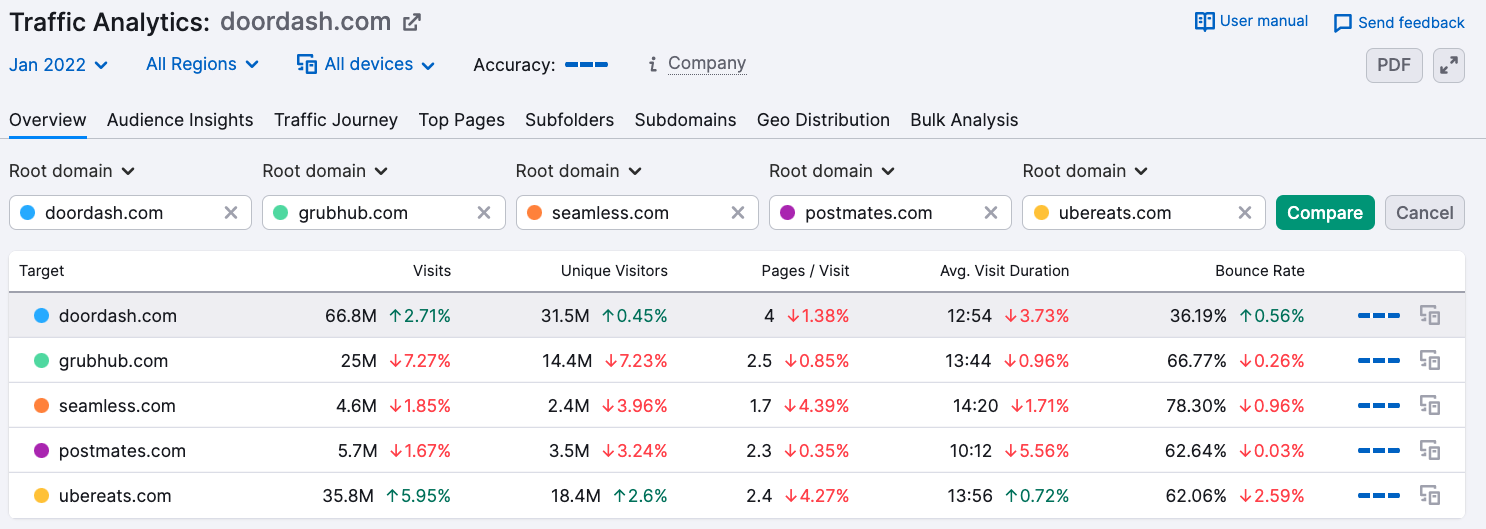
The first section in the overview report shows a side-by-side view of your competitors’ web traffic metrics, including Visits, Unique Visitors, Pages per Visit, Visit Duration, and Bounce Rate.
For your competitive landscape analysis, it’s important to consider the entire picture. Viewing the numbers in isolation may provide a limited view. For example, Ubereats and Grubhub are the closest competitors behind Doordash based on the majority of their metrics.
The picture changes, however, when considering Bounce Rate. Grubhub’s bounce rate is 4% higher than Ubereats and has dropped more than 2% more over the past month. With this specific metric in mind, it’s clear that Ubereats is also outcompeting Grubhub when it comes to user engagement, which may not have been clear when just Visits or Unique Visitors.
If you want a clearer picture of change in traffic over time, look at the Trend by Competitors graph.
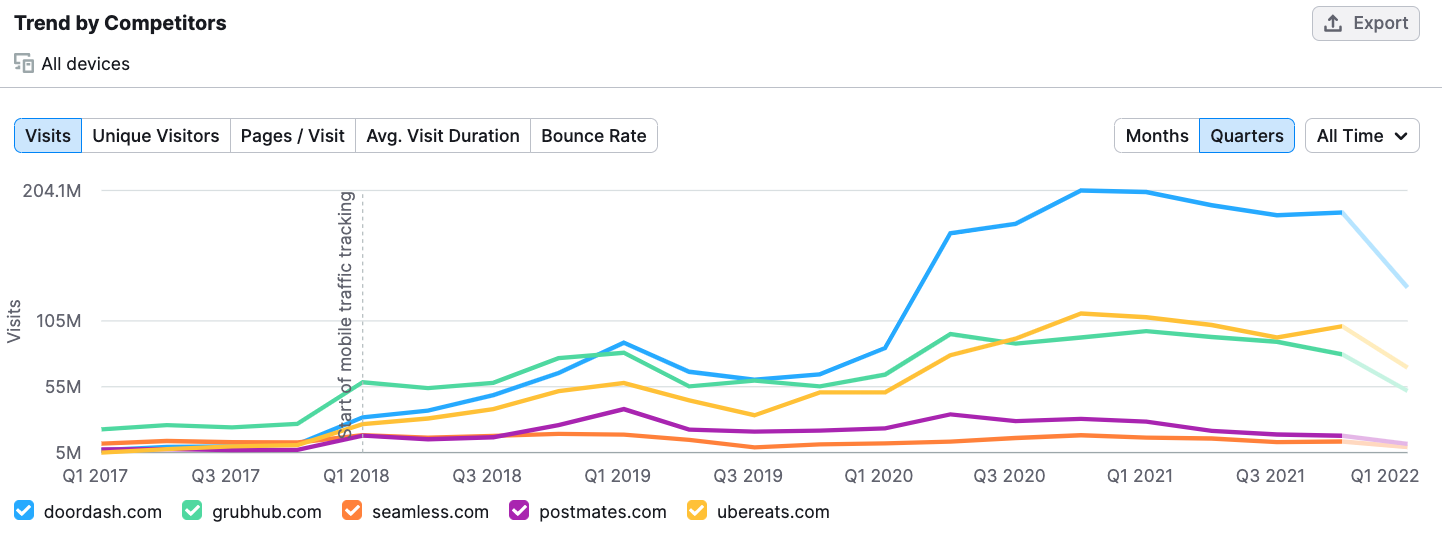
Viewing the data over time illuminates interesting trends in your market. For example, Around Q1 of 2020, almost all of the market players saw an increase in visits. By Q1 of 2021, clear winners had emerged.
Noting spikes in traffic can lead to deeper research questions. In the case of these food delivery businesses, it appears COVID-19 had a strong impact on the market. This said, the pandemic doesn’t fully explain why Doordash saw such huge gains over this period. This unanswered question may lead to additional landscape analysis business research.
The Audience Insights Report also provides useful data about how audiences overlap. This graph shows the audience overlap among Doordash, Grubhub, and Uber eats in December 2019.
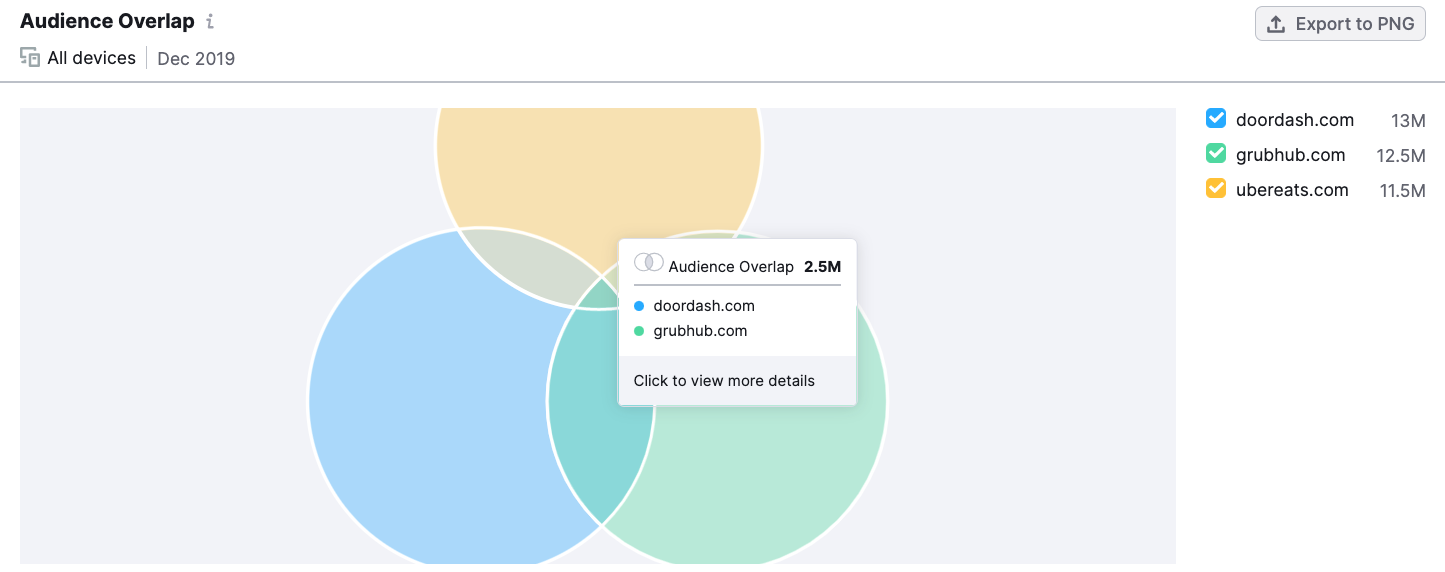
All of the businesses are close in terms of their unique visitors with numbers between 11.5M and 13M. The largest audience overlap exists between Doordash and Grubhub with 2.5M people who visited both sites.
Looking at the same graph from January 2022, the massive shifts in the competitive landscape become clear.
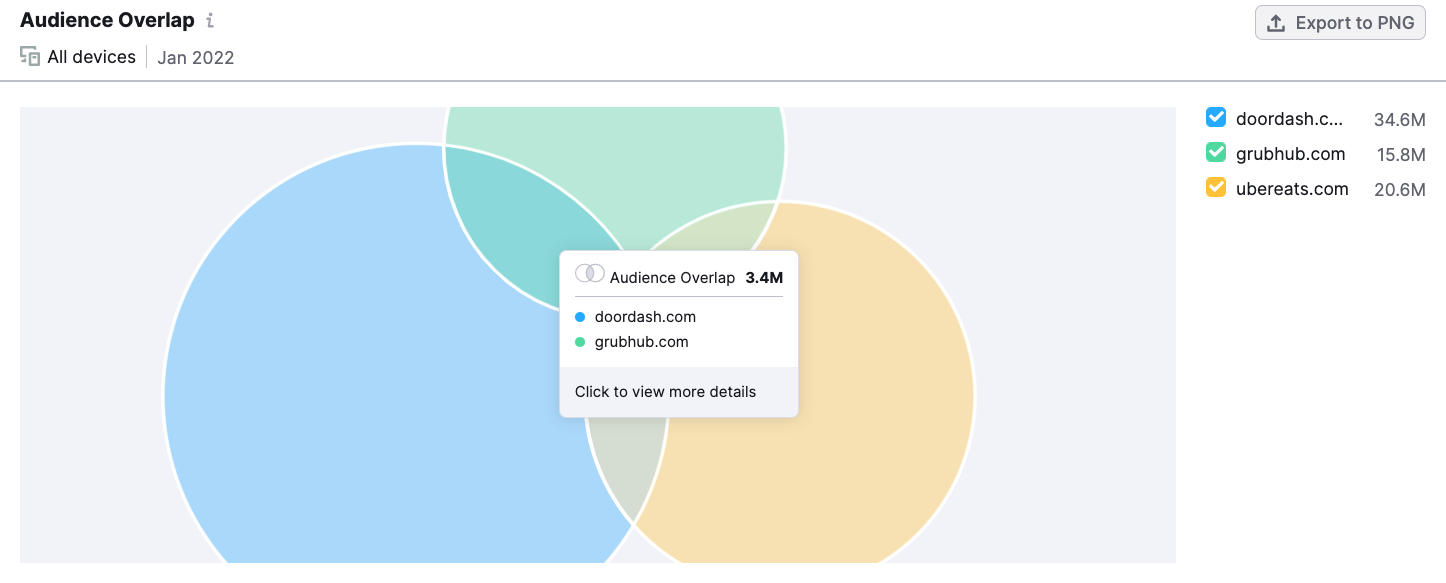
In this graph, Doordash is clearly leading the market. Since 2019, they’ve tripled their monthly unique visitors, while Ubereats nearly doubled their number, and Grubhub saw only slight gains.
Interestingly, as Doordash has seen tremendous growth, their audience overlap with Grubhub has increased by less than a million users. This suggests the audience they’re capturing is unique to their business, as opposed to captured from competitors.
Product Landscape Analysis Data
When it comes to the competitive landscape as it relates to products and services, both Traffic Analytics and EyeOn can provide a wealth of data.
The Top Pages report in Traffic Analytics lists your competitors most popular web pages and provides filtering options to bring the most useful data to the forefront. Here’s a look at Doordash’s Top Pages report for the month of January 2022.
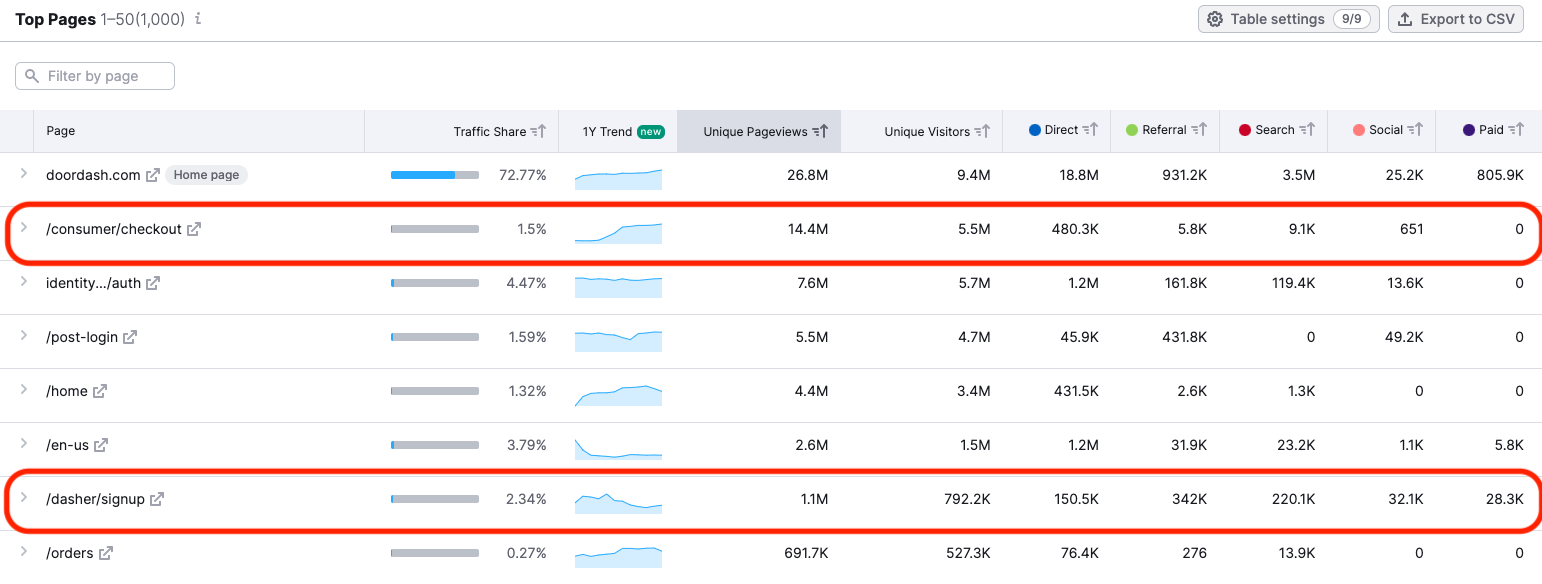
Notice the highlighted pages on the list. In terms of a competitive landscape analysis looking closely at service offerings, these pages may provide big picture insights into the Doordash’s business strategy and results.
The first highlighted page, “/consumer/checkout,” should give us a sense of the number of users making it to checkout. If you divide the number of people who make it to checkout by the total number of Unique Pageviews, and then multiply by 100, you can estimate the conversion rate percentage.
To use this example: 14.4M “Checkout” page views / 26.8M Unique Views equals .537, and .537 x 100 equals 53.7. So, the estimated conversion rate would be 53.7%.
The second highlighted page allows users to sign up to deliver for Doordash.com, which could provide insight into one specific aspect of the company’s growth strategy if tracked month by month.
Each page also offers a dropdown view with a graph revealing the sources of the traffic for that page. For example, consider Ubereats’ page for their “Eats Pass,” a subscription service that offers their users discounts and special offers.
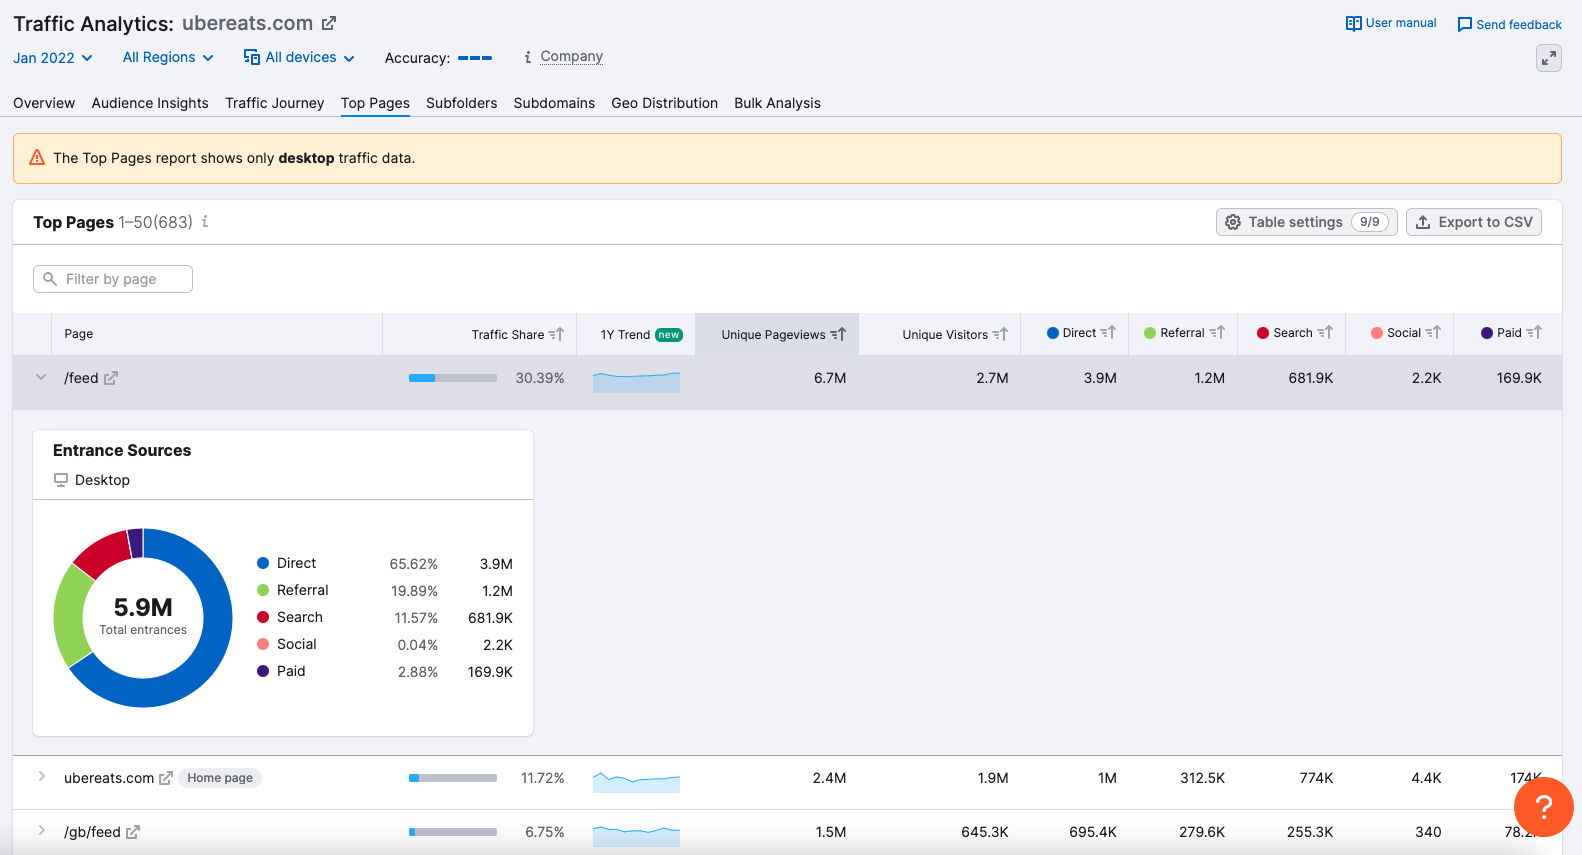
From this view, we can visualize the traffic sources and better understand how Ubereats markets this page. While direct traffic is most common, the amount of referral traffic coming to the page is also high. This suggests strong partnerships are part of their marketing strategy.
Finally, the EyeOn tool tracks your competitors, providing an organized view of their marketing trends and a timeline of their recent ads and blog posts.
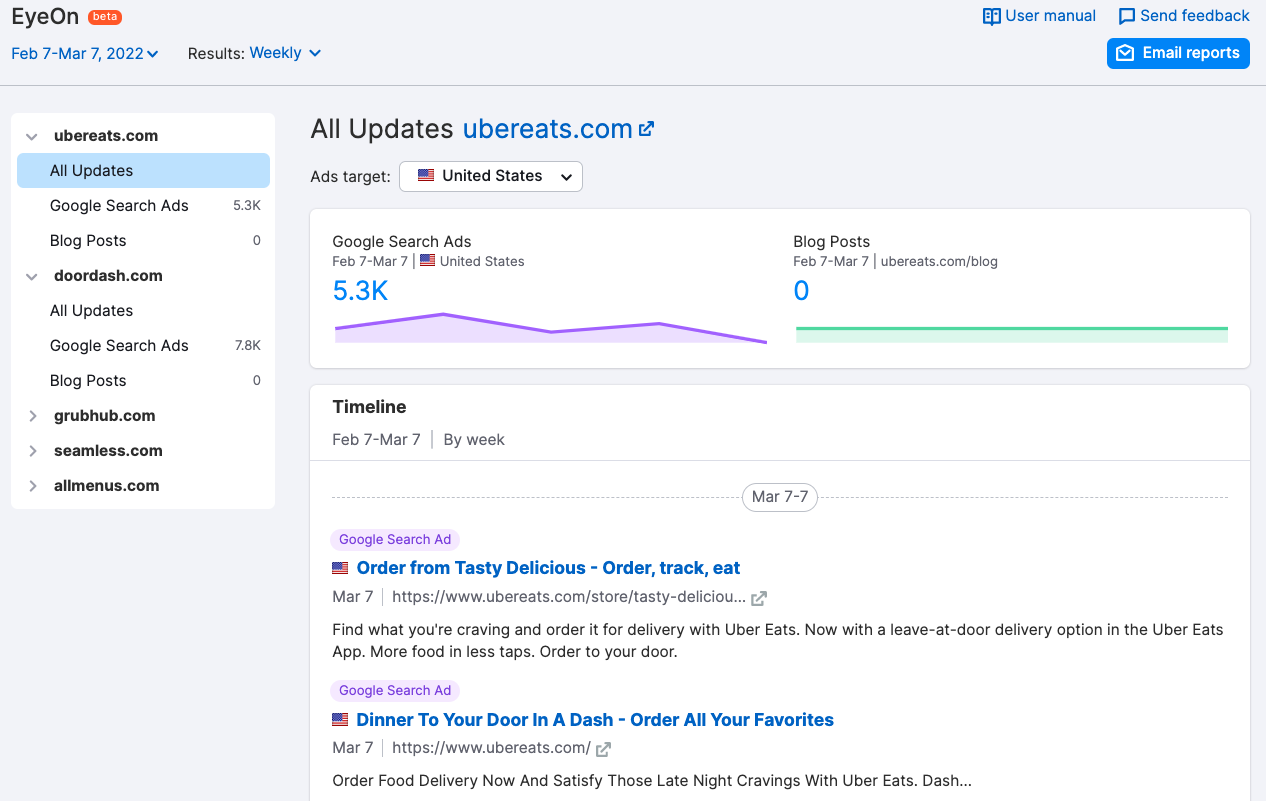
In terms of tracking products and services, the Timeline feature depicts an overall view of what products competitors are offering and which ones are getting the most promo attention. For example, Doordash is looking to attract new businesses to utilize their services.

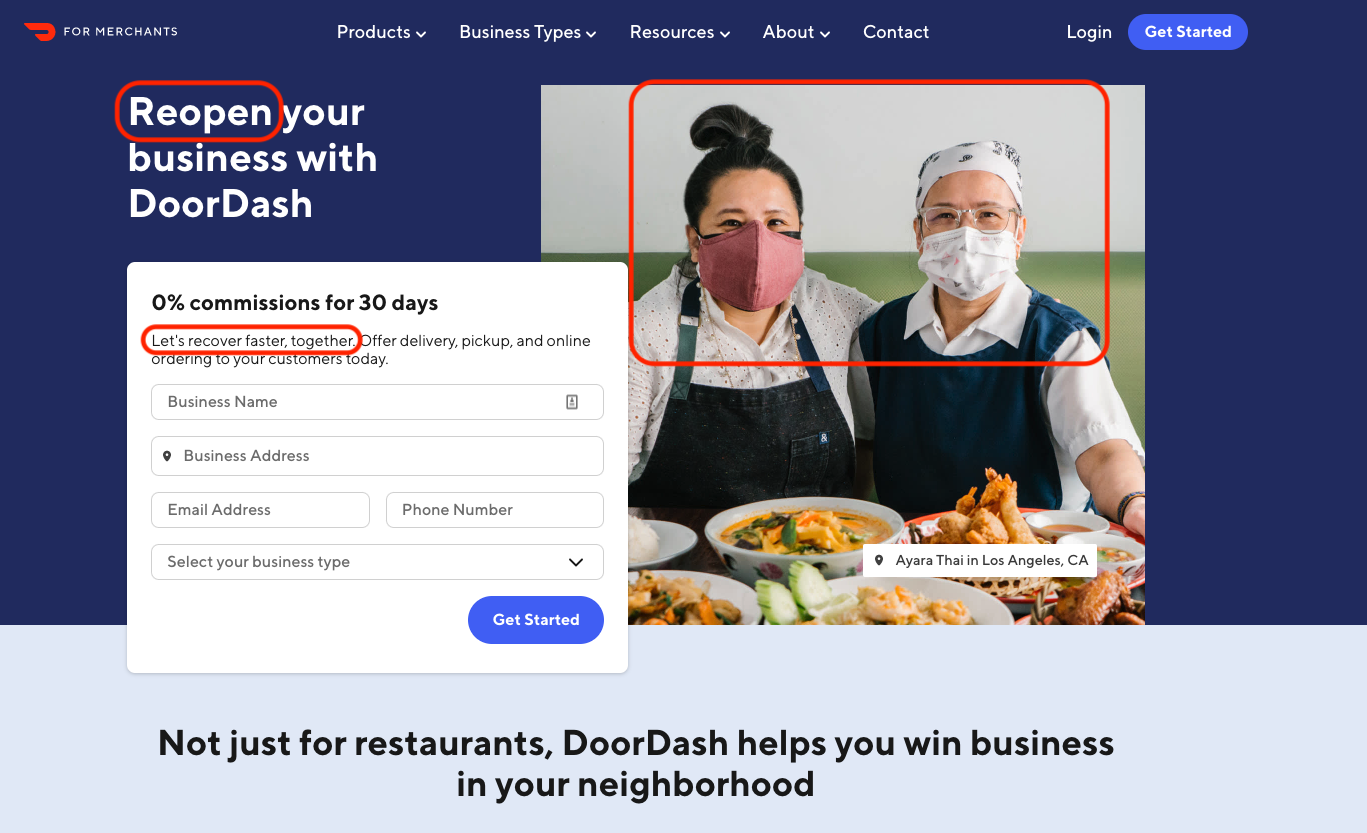
From the EyeOn timeline, you can navigate directly to the landing page to peek at how they’re promoting a particular product or service.
Digging deeper can provide important context about competitors’ marketing strategy. For example, the ad itself doesn’t say anything about COVID, but notice the image of restaurant owners in masks and the focus on “reopening” and “recovery” as a marketing strategy to attract customers in a COVID influenced market.
EyeOn will also send you a weekly email detailing your competitors ads and blog activity. With the combination of the trends graphs, Timeline, and weekly emails, you’ll be able to keep a close watch on your competitors' new product and service rollouts, their most popular promos, and trends in their marketing activity.
Your Competitive Landscape Report
Once you’ve uncovered your competitors, selected a framework for analyzing the competition, and gathered data, you’ll need to organize your findings. Again, understanding the lay of the land for strategic planning is the entire point of the competitive landscape analysis.
This often involves sharing your findings with other stakeholders. A variety of tools exist to help you share your findings. For simple analyses, a simple spreadsheet or a white board may work. For other research, you may want to use a tool like Google Data Studio or Tableau.
Either way, because landscape analyses focus on relationships between businesses, it can help to study and present your findings visually. Don’t be afraid to get creative! Often, looking at data in different ways helps draw better conclusions and explain your findings to stakeholders with more clarity.
Innovative SEO services
SEO is a patience game; no secret there. We`ll work with you to develop a Search strategy focused on producing increased traffic rankings in as early as 3-months.
A proven Allinclusive. SEO services for measuring, executing, and optimizing for Search Engine success. We say what we do and do what we say.
Our company as Semrush Agency Partner has designed a search engine optimization service that is both ethical and result-driven. We use the latest tools, strategies, and trends to help you move up in the search engines for the right keywords to get noticed by the right audience.
Today, you can schedule a Discovery call with us about your company needs.
Source:


